On the Surface
On the Surface
On the Surface

Create successful ePaper yourself
Turn your PDF publications into a flip-book with our unique Google optimized e-Paper software.
International revenues for fiscal 2007 amounted to $263.9 million, an increase of $29.2 million, or 12.4%, as compared to fiscal<br />
2006. The increase in year-over-year international revenues was attributable to a 14.9% increase in capital revenues primarily within <strong>the</strong><br />
European and Canadian marketplaces. Within Europe, fiscal 2007 capital revenues reflect <strong>the</strong> continued success of surgical tables and<br />
related accessories in <strong>the</strong> Healthcare segment and increases in <strong>the</strong> Life Sciences segment’s revenues from VHP technologies and water<br />
systems. This increase was partially offset by a decrease in Asia Pacific and Latin America capital revenues in our Life Sciences segment<br />
during fiscal 2007. The increase in international capital revenues was supplemented by an increase of 9.4% in recurring revenue streams year<br />
over year.<br />
United States revenues for fiscal 2007 amounted to $933.5 million, an increase of $7.9 million, or 0.9%, as compared to fiscal<br />
2006. United States revenues were positively impacted by a 4.1% increase in recurring revenues, which were driven by increases in service<br />
revenues in all segments. Year over year, United States capital revenues decreased 3.9%, reflecting fluctuating demand within <strong>the</strong> Healthcare<br />
segment for sterile processing capital products generally associated with new construction projects and as a result of <strong>the</strong> strong price<br />
competition experienced by <strong>the</strong> Life Sciences segment for capital equipment being sold into <strong>the</strong> United States research market.<br />
Revenues by segment are fur<strong>the</strong>r discussed in <strong>the</strong> section of MD&A titled, “Business Segment Results of Operations.”<br />
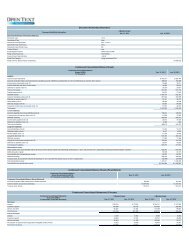
Gross Profit. The following table compares our gross profit for <strong>the</strong> year ended March 31, 2007 to <strong>the</strong> year ended March 31, 2006:<br />
Years Ended March 31,<br />
(dollars in thousands) 2007 2006<br />
Change<br />
Percent<br />
Change<br />
Gross Profit:<br />
Product $ 319,066 $ 314,386 $ 4,680 1.5%<br />
Service 185,741 169,799 15,942 9.4%<br />
Total Gross Profit $ 504,807 $ 484,185 $ 20,622 4.3%<br />
Gross Profit Percentage:<br />
Product 41.2% 41.4%<br />
Service 43.8% 42.4%<br />
Total Gross Profit Percentage 42.2% 41.7%<br />
Our gross profit (margin) is affected by <strong>the</strong> volume, pricing, and mix of sales of our products and services, as well as <strong>the</strong> costs<br />
associated with <strong>the</strong> products and services that are sold. Our gross margin increased to 42.2% for fiscal 2007. Overall, our fiscal 2007<br />
margins increased due to improved productivity and pricing, which more than offset increases in labor and raw material costs. Gross<br />
margins also benefited from a shift towards higher margin recurring revenue products within <strong>the</strong> Life Sciences segment. Gross margins for<br />
fiscal 2007 include $1.1 million in share-based compensation expense as a result of <strong>the</strong> impact of SFAS No. 123R.<br />
The gross margins related to our operating segments are fur<strong>the</strong>r discussed in <strong>the</strong> section of MD&A titled, “Business Segment<br />
Results of Operations.”<br />
38