On the Surface
On the Surface
On the Surface

You also want an ePaper? Increase the reach of your titles
YUMPU automatically turns print PDFs into web optimized ePapers that Google loves.
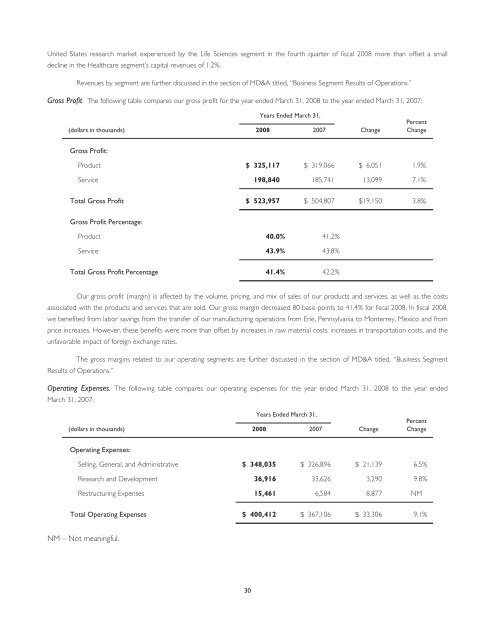
United States research market experienced by <strong>the</strong> Life Sciences segment in <strong>the</strong> fourth quarter of fiscal 2008 more than offset a small<br />
decline in <strong>the</strong> Healthcare segment’s capital revenues of 1.2%.<br />
Revenues by segment are fur<strong>the</strong>r discussed in <strong>the</strong> section of MD&A titled, “Business Segment Results of Operations.”<br />
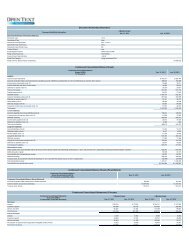
Gross Profit. The following table compares our gross profit for <strong>the</strong> year ended March 31, 2008 to <strong>the</strong> year ended March 31, 2007:<br />
Years Ended March 31,<br />
(dollars in thousands) 2008 2007<br />
Change<br />
Percent<br />
Change<br />
Gross Profit:<br />
Product $ 325,117 $ 319,066 $ 6,051 1.9%<br />
Service 198,840 185,741 13,099 7.1%<br />
Total Gross Profit $ 523,957 $ 504,807 $19,150 3.8%<br />
Gross Profit Percentage:<br />
Product 40.0% 41.2%<br />
Service 43.9% 43.8%<br />
Total Gross Profit Percentage 41.4% 42.2%<br />
Our gross profit (margin) is affected by <strong>the</strong> volume, pricing, and mix of sales of our products and services, as well as <strong>the</strong> costs<br />
associated with <strong>the</strong> products and services that are sold. Our gross margin decreased 80 basis points to 41.4% for fiscal 2008. In fiscal 2008,<br />
we benefited from labor savings from <strong>the</strong> transfer of our manufacturing operations from Erie, Pennsylvania to Monterrey, Mexico and from<br />
price increases. However, <strong>the</strong>se benefits were more than offset by increases in raw material costs, increases in transportation costs, and <strong>the</strong><br />
unfavorable impact of foreign exchange rates.<br />
The gross margins related to our operating segments are fur<strong>the</strong>r discussed in <strong>the</strong> section of MD&A titled, “Business Segment<br />
Results of Operations.”<br />
Operating Expenses. The following table compares our operating expenses for <strong>the</strong> year ended March 31, 2008 to <strong>the</strong> year ended<br />
March 31, 2007:<br />
Years Ended March 31,<br />
(dollars in thousands) 2008 2007<br />
Change<br />
Percent<br />
Change<br />
Operating Expenses:<br />
Selling, General, and Administrative $ 348,035 $ 326,896 $ 21,139 6.5%<br />
Research and Development 36,916 33,626 3,290 9.8%<br />
Restructuring Expenses 15,461 6,584 8,877 NM<br />
Total Operating Expenses $ 400,412 $ 367,106 $ 33,306 9.1%<br />
NM – Not meaningful.<br />
30