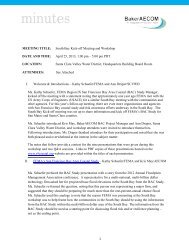
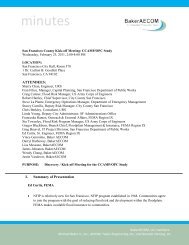
TABLE 9 FLOODING SOURCE FLOODWAY 1-PERCENT-ANNUAL-CHANCE FLOOD WATER SURFACE ELEVATION Oak Creek CROSS SECTION DISTANCE 1 WIDTH (FEET) SECTION AREA (SQUARE FEET) MEAN VELOCITY (FEET PER SECOND) REGULATORY (FEET NAVD) WITHOUT FLOODWAY (FEET NAVD) (FEET NGVD) WITH FLOODWAY (FEET NAVD) INCREASE (FEET) A 300 510 9,558 5.4 3,203.7 3,203.7 3,204.7 1.0 B 2,120 476 7,542 6.8 3,205.3 3,205.3 3,206.2 0.9 C 3,900 290 4,759 10.7 3,208.1 3,208.1 3,208.9 0.8 D 5,050 320 6,411 8.0 3,212.2 3,212.2 3,212.8 0.6 E 5,950 247 5,160 9.9 3,213.7 3,213.7 3,214.4 0.7 F 7,450 370 7,476 6.8 3,219.1 3,219.1 3,220.0 0.9 G 8,030 500 10,151 5.0 3,220.1 3,220.1 3,220.9 0.8 H 9,760 670 11,041 4.6 3,221.8 3,221.8 3,222.6 0.8 I 12,050 287 5,971 8.5 3,225.6 3,225.6 3,225.9 0.3 J 13,610 414 7,291 7.0 3,230.1 3,230.1 3,230.6 0.5 K 15,720 363 6,330 8.0 3,234.0 3,234.0 3,234.8 0.8 L 16,470 414 6,735 7.5 3,236.8 3,237.0 3,237.7 0.7 M 17,620 470 7,634 6.7 3,238.6 3,238.8 3,239.5 0.7 N 19,170 502 7,588 6.7 3,241.8 3,241.8 3,242.6 0.8 O 20,120 599 10,679 4.8 3,244.4 3,244.4 3,245.0 0.6 P 21,520 454 8,514 6.0 3,246.3 3,246.3 3,247.0 0.7 Q 23,870 394 7,543 6.7 3,251.1 3,251.1 3,252.1 1.0 R 25,620 300 5,540 9.2 3,255.5 3,255.5 3,256.2 0.7 S 26,870 290 6,146 8.3 3,258.3 3,258.3 3,259.0 0.7 T 28,070 356 7,324 6.9 3,261.8 3,261.8 3,262.5 0.7 1 Feet above confluence with Verde River. FEDERAL EMERGENCY MANAGEMENT AGENCY <strong>YAVAPAI</strong> <strong>COUNTY</strong>, AZ AND INCORPORATED AREAS FLOODWAY DATA OAK CREEK
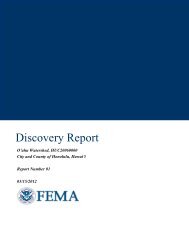
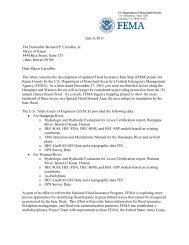
TABLE 9 FLOODING SOURCE FLOODWAY 1-PERCENT-ANNUAL-CHANCE FLOOD WATER SURFACE ELEVATION Verde River CROSS SECTION DISTANCE 1 WIDTH (FEET) SECTION AREA (SQUARE FEET) MEAN VELOCITY (FEET PER SECOND) REGULATORY (FEET NAVD) WITHOUT FLOODWAY (FEET NAVD) (FEET NGVD) WITH FLOODWAY (FEET NAVD) INCREASE (FEET) A 339 526 13173 11.1 2988.4 2988.4 2989.2 0.8 B 1693 1079 22748 7.4 2991.7 2991.7 2992.5 0.8 C 3908 938 15900 8.8 2993.6 2993.6 2994.3 0.7 D 4896 1063 12052 14.9 2995.8 2995.8 2996.4 0.6 E 5275 1538 19013 8.8 2999.1 2999.1 2999.3 0.2 F 7163 2162 33934 4.5 3001.3 3001.3 3001.5 0.2 G 9353 1146 17779 7.7 3002.2 3002.2 3002.4 0.2 H 11095 1620 21376 7.9 3005.5 3005.5 3006.0 0.5 I 12562 2285 25131 6.7 3007.8 3007.8 3008.3 0.5 J 13295 2494 23385 7.6 3008.8 3008.8 3009.3 0.5 K 15003 2426 21754 8.5 3009.8 3009.8 3010.4 0.6 L 16246 1882 15635 11.1 3011.2 3011.2 3012.0 0.8 M 17405 1147 12401 12.0 3013.2 3013.2 3014.1 0.9 N 19011 942 14846 9.1 3018.5 3018.5 3018.9 0.4 O 20712 1525 22022 7.4 3023.8 3023.8 3024.4 0.6 P 21674 2165 24481 5.9 3024.8 3024.8 3025.4 0.6 Q 22957 2320 22777 6.0 3026.5 3026.5 3027.2 0.7 R 23759 1981 20983 7.3 3027.8 3027.8 3028.6 0.8 S 24840 1407 17792 9.3 3029.5 3029.5 3030.2 0.7 1 Stream Distance In Feet South of Camp Verde to the Forest Service Boundary FEDERAL EMERGENCY MANAGEMENT AGENCY <strong>YAVAPAI</strong> <strong>COUNTY</strong>, AZ AND INCORPORATED AREAS FLOODWAY DATA VERDE RIVER
- Page 1 and 2:
YAVAPAI COUNTY, ARIZONA AND INCORPO
- Page 3 and 4:
TABLE OF CONTENTS - Volume 1 Page 1
- Page 5 and 6:
TABLE OF CONTENTS - Volume 3 - cont
- Page 7 and 8:
TABLE OF CONTENTS - Volume 5 - cont
- Page 9 and 10:
authority and acknowledgments for e
- Page 11 and 12:
In the March 29, 1983, revision, up
- Page 13 and 14:
The September 20, 1996, revision al
- Page 15 and 16:
update corporate limits, to change
- Page 17 and 18:
TABLE 2 - STREAMS STUDIED BY DETAIL
- Page 19 and 20:
TABLE 3 - LETTERS OF MAP CHANGE - c
- Page 21 and 22:
Precipitation in the study area is
- Page 23 and 24:
TABLE 4 - HISTORIC RECORDED DISCHAR
- Page 25 and 26:
The Verde Lakes Estates in the Town
- Page 27 and 28:
Problems created by large magnitude
- Page 29 and 30:
All flooding sources were analyzed
- Page 31 and 32:
approximately 1,600 feet downstream
- Page 33 and 34:
TABLE 5 - SUMMARY OF DISCHARGES FLO
- Page 35 and 36: TABLE 5 - SUMMARY OF DISCHARGES - c
- Page 37 and 38: TABLE 5 - SUMMARY OF DISCHARGES - c
- Page 39 and 40: TABLE 5 - SUMMARY OF DISCHARGES - c
- Page 41 and 42: TABLE 5 - SUMMARY OF DISCHARGES - c
- Page 43 and 44: TABLE 5 - SUMMARY OF DISCHARGES - c
- Page 45 and 46: TABLE 5 - SUMMARY OF DISCHARGES - c
- Page 47 and 48: Mapping, Inc. (Kenney Aerial Mappin
- Page 49 and 50: 1985. It was determined from the si
- Page 51 and 52: Values for the roughness coefficien
- Page 53 and 54: TABLE 6 - MANNING'S "n" VALUES - co
- Page 55 and 56: To minimize the impact of the levee
- Page 57 and 58: ecommended as the approximate areas
- Page 59 and 60: TABLE 8 - VERTICAL DATUM CONVERSION
- Page 61 and 62: Approximate 1-percent annual chance
- Page 63 and 64: e feasible in view of extremely hig
- Page 65 and 66: average depths are between 1 and 3
- Page 67 and 68: COMMUNITY NAME INITIAL IDENTIFICATI
- Page 69 and 70: The only other study completed for
- Page 71 and 72: Cooper Aerial Surveys, Aerial Photo
- Page 73 and 74: Kenny Aerial Mapping, Topographic M
- Page 75 and 76: U.S. Department of the Army, Corps
- Page 77 and 78: Joes Hill, Arizona (1969); King Can
- Page 79 and 80: Pipe Creek Railroad Wash Silver Spr
- Page 81 and 82: Manning’s “n” values were ass
- Page 83 and 84: FLOODING SOURCE FLOODWAY 1-PERCENT-
- Page 85: FLOODING SOURCE FLOODWAY 1-PERCENT-
- Page 89 and 90: TABLE 9 FLOODING SOURCE FLOODWAY 1-
- Page 91 and 92: TABLE 9 FLOODING SOURCE FLOODWAY 1-
- Page 93: TABLE 9 FLOODING SOURCE FLOODWAY 1-