Section 9 - Ground Transport Plan - Melbourne Airport
Section 9 - Ground Transport Plan - Melbourne Airport
Section 9 - Ground Transport Plan - Melbourne Airport

Create successful ePaper yourself
Turn your PDF publications into a flip-book with our unique Google optimized e-Paper software.
<strong>Ground</strong> <strong>Transport</strong> <strong>Plan</strong> :: 9<br />
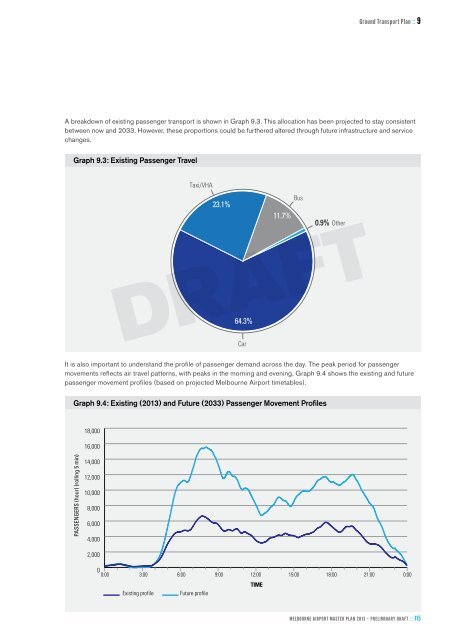
A breakdown of existing passenger transport is shown in Graph 9.3. This allocation has been projected to stay consistent<br />
between now and 2033. However, these proportions could be furthered altered through future infrastructure and service<br />
changes.<br />
Graph 9.3: Existing Passenger Travel<br />
Taxi/VHA<br />
Bus<br />
23.1%<br />
11.7%<br />
64.3%<br />
Car<br />
0.9% Other<br />
DRAFT<br />
It is also important to understand the profile of passenger demand across the day. The peak period for passenger<br />
movements reflects air travel patterns, with peaks in the morning and evening. Graph 9.4 shows the existing and future<br />
passenger movement profiles (based on projected <strong>Melbourne</strong> <strong>Airport</strong> timetables).<br />
Graph 9.4: Existing (2013) and Future (2033) Passenger Movement Profiles<br />
18,000<br />
16,000<br />
PASSENGERS (hour) (rolling 5 min)<br />
14,000<br />
12,000<br />
10,000<br />
8,000<br />
6,000<br />
4,000<br />
2,000<br />
0<br />
0:00<br />
3:00 6:00 9:00 12:00 15:00 18:00 21:00 0:00<br />
TIME<br />
Existing profile<br />
Future profile<br />
MELBOURNE <strong>Airport</strong> Master plan 2013 – PRELIMINARY DRAFT : : 115