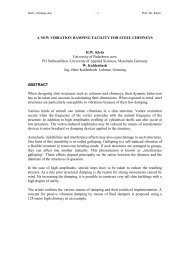
ABSTRACT A vibration isolation system using spring units and visco ...
ABSTRACT A vibration isolation system using spring units and visco ...
ABSTRACT A vibration isolation system using spring units and visco ...

You also want an ePaper? Increase the reach of your titles
YUMPU automatically turns print PDFs into web optimized ePapers that Google loves.
<strong>ABSTRACT</strong><br />
(Revised English Version)<br />
A <strong>vibration</strong> <strong>isolation</strong> <strong>system</strong> <strong>using</strong> <strong>spring</strong> <strong>units</strong> <strong>and</strong> <strong>visco</strong>-elastic dampers can reduce <strong>vibration</strong> <strong>and</strong><br />
structure borne noise in a building near subway or other traffic facilities effectively. For applying<br />
this <strong>system</strong> in Japan, it is necessary to confirm the seismic safety. So an experimental <strong>and</strong><br />
analytical study was done.<br />
At first static loading tests of the <strong>spring</strong> <strong>units</strong> <strong>and</strong> dynamic loading tests of a <strong>visco</strong>-elastic damper<br />
were carried out. Then analytical models for the <strong>spring</strong>s <strong>and</strong> <strong>visco</strong>-elastic dampers were<br />
developed. At the next stage shaking table tests with the model of a <strong>vibration</strong> isolated building<br />
were performed in order to examine the <strong>vibration</strong> characteristics <strong>and</strong> behaviours of the structure.<br />
Finally a four story <strong>vibration</strong> isolated building supported by such a <strong>system</strong> was designed with the<br />
confirmation of the seismic safety of the building by analysis based on the proposed model.<br />
KEYWORDS<br />
<strong>vibration</strong> <strong>isolation</strong> <strong>system</strong>, helical steel <strong>spring</strong>, <strong>visco</strong>-elastic damper, loading test, shaking table<br />
test, response analysis.<br />
1. INTRODUCTION<br />
Recently many buildings have been constructed near subways or other traffic facilities in inner city<br />
areas of Japan where <strong>vibration</strong> or structure borne noise reduces the quality of life of the people<br />
living here. To avoid this problem, it is useful to adopt <strong>vibration</strong> <strong>isolation</strong> <strong>system</strong>s <strong>using</strong> <strong>spring</strong> <strong>units</strong><br />
<strong>and</strong> <strong>visco</strong>-elastic dampers. For this purpose, an experimental <strong>and</strong> analytical study has been done<br />
including the design of a four story building with consideration of its seismic safety.
2. VIBRATION ISOLATION SYSTEM<br />
2.1 Details of the <strong>system</strong><br />
Helical steel <strong>spring</strong>s are used to support the weight of the building providing a low vertical natural<br />
frequency of the <strong>spring</strong> supported building, so that the higher frequency parts of the traffic<br />
<strong>vibration</strong>s can be isolated to a high degree. The <strong>visco</strong>-elastic dampers react in all three<br />
dimensions. They can, therefore, be placed near to the corners of the building.<br />
Both, <strong>spring</strong>s <strong>and</strong> dampers, are concentrated in several locations where the number of <strong>spring</strong> <strong>units</strong><br />
<strong>and</strong> dampers is controlled by the load distribution of the upper structure.<br />
The <strong>system</strong> has the following characteristics:<br />
1) With helical <strong>spring</strong> support of the building its natural frequencies, both in vertical <strong>and</strong> horizontal<br />
direction, can be set quite low, so that <strong>vibration</strong> <strong>and</strong> structure borne noise from subways or<br />
other traffic is highly reduced.<br />
2) Since <strong>visco</strong>-elastic dampers react three dimensionally, it is needless to arrange dampers for<br />
vertical <strong>and</strong> horizontal direction independently, <strong>and</strong> it is, therefore, easy to concentrate the<br />
devices in the corners.<br />
Fig. 1 Sectional plan of the building Fig. 2 Arrangement of devices in the building
2.2 Composition of the <strong>system</strong><br />
2.2.1 Helical steel <strong>spring</strong> elements<br />
Several helical steel <strong>spring</strong>s are used as a <strong>spring</strong> unit. Usually a <strong>spring</strong> unit, consisting of the<br />
<strong>spring</strong>s <strong>and</strong> a top <strong>and</strong> bottom plate, can resist only compression forces. But in this special <strong>system</strong>,<br />
<strong>spring</strong>s can resist compression <strong>and</strong> tension force because both ends of the <strong>spring</strong>s are fixed to the<br />
end plates (see Fig. 3).<br />
Fig. 3 Spring unit Fig. 4 Damper<br />
2.2.2 Visco-elastic dampers<br />
Visco-elastic dampers consist of three parts as shown in Fig. 4.<br />
(1) Lower cylindrical vessel<br />
(2) Visco-elastic liquid in the vessel<br />
(3) Cylindrical piston submerged in the <strong>visco</strong>-elastic liquid.<br />
The cylindrical piston can move in the <strong>visco</strong>-elastic liquid three-dimensionally relative to the<br />
movement of the lower vessel transferring <strong>vibration</strong> energy in this way into heat.<br />
3. DYNAMIC TEST OF THE DEVICES<br />
Several dynamic tests of the <strong>spring</strong> <strong>units</strong> <strong>and</strong> the <strong>visco</strong>-elastic dampers were done.<br />
3.1 Dynamic test of the characteristics of the <strong>spring</strong> unit<br />
3.1.1 Outline of the test<br />
The <strong>spring</strong> unit contains seven helical steel <strong>spring</strong>s fixed to the end plates. The natural frequency<br />
in the vertical direction of the <strong>spring</strong> supported <strong>system</strong> is 2.5 Hz.<br />
The test pattern is<br />
(1) Horizontal loading test at different displacements in vertical direction.<br />
(2) Vertical loading test at some displacements in horizontal direction.
3.1.2 Cyclic horizontal loading test<br />
(1) Loading<br />
At first the <strong>spring</strong> unit is deformed vertically by - 20 mm, - 10 mm (tension), 5 mm, 15 mm, 40 mm<br />
(compression). Then the unit is pushed in two horizontal directions in a right angle by a cyclic load<br />
of a hydraulic jack.<br />
(2) Displacements<br />
The horizontal displacement is ± 10 mm in the first cycle, ± 20 mm in the second cycle, ± 30 mm in<br />
the third cycle <strong>and</strong> ± 42 mm in the forth cycle.<br />
(3) Results<br />
Fig. 5 shows the relation between horizontal load <strong>and</strong> displacement.<br />
Fig. 6 shows the relation between horizontal <strong>spring</strong> rate <strong>and</strong> vertical displacement.<br />
According to Fig. 6, the horizontal <strong>spring</strong> rate increases with increasing vertical displacements. The<br />
results are the same in both horizontal directions.<br />
Fig. 5 Horizontal load-displacement line Fig. 6 Relation between horizontal <strong>spring</strong> rate<br />
<strong>and</strong> vertical displacement<br />
3.1.3 Cyclic vertical loading test<br />
(1) Loading<br />
At first the <strong>spring</strong> unit is deformed horizontally by 0 mm, 30 mm, 42 mm. Then the unit is<br />
dynamically loaded in vertical direction cyclically by a hydraulic jack.<br />
(2) Displacements<br />
At first the <strong>spring</strong> unit is compressed statically by 40 mm. Then it is vertically loaded by ± 20 mm in<br />
the first cycle, ± 30 mm in the second cycle, ± 40 mm in the third cycle <strong>and</strong> ± 50 mm in the fourth<br />
cycle.
(3) Results<br />
Fig. 7 shows the relation between vertical load <strong>and</strong> displacement.<br />
Fig. 8 shows the relation between vertical stiffness <strong>and</strong> horizontal displacement.<br />
According to Fig. 8 vertical stiffness increases at increasing horizontal displacements.<br />
Fig. 7 Vertical load displacement line Fig. 8 Vertical stiffness versus horizontal displacement<br />
3.2 Test of the characteristics of the <strong>visco</strong>-elastic damper<br />
3.2.1 Outline of the test<br />
The vertical <strong>and</strong> horizontal characteristics of the <strong>visco</strong>-elastic damper were found in a test with<br />
r<strong>and</strong>om noise excitation <strong>and</strong> tests with sinusoidal force excitation at several frequencies.<br />
3.2.2 Vibration test in vertical <strong>and</strong> horizontal direction<br />
(1) Vibration<br />
Vibrations were excited by r<strong>and</strong>om noise or sinusoidal loads. The frequency range of the r<strong>and</strong>om<br />
noise was 0 to 5 Hz <strong>and</strong> 3 to 50 Hz. The amplitude range was very small. The amplitude range of<br />
the vertical sinusoidal excitation was 5 ~ 45 mm at 1 Hz, 5 ~ 15 mm at 2 Hz <strong>and</strong> 2 ~ 12 mm at<br />
5 Hz. The amplitude range of the horizontal sinusoidal excitation was 5 ~ 30 mm at 1 Hz,<br />
5 ~ 15 mm at 1,5 Hz <strong>and</strong> 2 ~ 15 mm at 3 Hz.<br />
�� Results of r<strong>and</strong>om noise excitation<br />
Fig. 9 Displacement dependency<br />
of damping resistance
(2) Result<br />
According to the tests, the damping coefficient decreases <strong>and</strong> the stiffness increases with<br />
increasing frequency.<br />
Fig. 9 shows the displacement dependency of the damping coefficient. The horizontal damping<br />
coefficient decreased down to 87 % compared to that at r<strong>and</strong>om noise excitation when the<br />
amplitude was 30 mm. The vertical damping coefficient decreased down to 60 % compared to that<br />
at r<strong>and</strong>om noise excitation when the amplitude was 45 mm.<br />
4. SEISMIC RESPONSE ANALYSIS OF THE VIBRATION ISOLATED BUILDING<br />
4.1 Analysis model<br />
The analysis model is shown in Fig. 10<br />
(1) The upper parts of the building were assumed as concentrated masses connected by <strong>spring</strong>s.<br />
(2) The ground floor was assumed as a solid slab.<br />
(3) The <strong>spring</strong> elements <strong>and</strong> <strong>visco</strong>-elastic dampers were put under the columns of the ground floor.<br />
(4) The analysis model was designed as a three dimensional model.<br />
The data for the analysis are shown in Table 1.<br />
Fig. 10 Analysis model of the building<br />
4.1.1 Modelling of the <strong>spring</strong>s<br />
The <strong>spring</strong> coefficients of the <strong>spring</strong> depend on the deformation of the <strong>spring</strong>. The model of the<br />
<strong>spring</strong> (shown in Fig. 11) was, therefore, composed of a vertical <strong>spring</strong> <strong>and</strong> a multi <strong>spring</strong> element<br />
for the horizontal shear direction. Both elements were given restoration characteristics gained from<br />
the experiments. The response calculation was done step by step with the tangential stiffness at<br />
each step.
4.1.2 Modelling of the damper<br />
The damping coefficients have a displacement dependency according to the experiments. These<br />
dynamic characteristics of the damper are introduced into a four parameter model as shown in<br />
Fig 12,<br />
Fig. 11 Isolation <strong>spring</strong> element Fig. 12 4 parameter model Table 2 Parameters of the 4 parameter model<br />
where the damping coefficients <strong>and</strong> the damper stiffnesses are taken into account according to the<br />
experiments for every frequency. According to Fig. 9 the damping coefficients were reduced to<br />
87 % in the horizontal direction <strong>and</strong> to 60 % in the vertical direction. The parameters of the<br />
4 parameter model are shown in Table 2.<br />
4.2 The procedure of the response analysis<br />
With the help of a three dimensional frequency response analysis program <strong>and</strong> a three<br />
dimensional time history response analysis program the response analysis was done as follows.<br />
(1) The <strong>spring</strong> rates of the <strong>spring</strong> unit were assumed to be linear. In this way the three dimensional<br />
frequency response analysis program was run. Next, the three dimensional time history response<br />
analysis program was run. Then the similarity of the two wave forms gained from the two analysis<br />
was compared.<br />
(2) The <strong>spring</strong> was modeled as a combination of a vertical <strong>spring</strong> element <strong>and</strong> a multi <strong>spring</strong><br />
element for the horizontal shear direction. The damper was modeled as a four parameter model as<br />
shown in Fig. 12. Then the three dimensional frequency response analysis program was run.<br />
4.3 Earthquake records used<br />
Earthquake records used in this analysis were modified from those of El Centro, Taft <strong>and</strong><br />
Hachinohe Earthquakes. The strength levels of the earthquake records were 50 kine for the<br />
horizontal NS <strong>and</strong> EW direction vectors.
4.4 Results<br />
The acceleration time histories of X <strong>and</strong> Y directions for the roof floor resulting from the three<br />
dimensional frequency response analysis <strong>and</strong> the three dimensional time history response analysis<br />
based on the EW wave of El Centro in X direction are shown in Fig. 13. Both time histories are<br />
very similar in wave form <strong>and</strong> maximum acceleration.<br />
(a) Frequency response analysis (b) Time history response analysis<br />
Fig. 13 Acceleration response (RFX,Y-direction)<br />
(a) Frequency response analysis (b) Time history response analysis Table 3 Maximum response<br />
Fig. 14 Transfer function (RF X-direction)<br />
The transfer functions of the two response analyses are shown in Fig. 14. Both are very similar<br />
below 10 Hz, but above 10 Hz the response of the time history analysis is lower than that of the<br />
frequency response analysis.<br />
The detailed analysis results are shown in Table 3.
5. SHAKING TABLE TEST OF THE ISOLATED BUILDING MODEL<br />
5.1 Shaking table test<br />
5.1.1 Model<br />
The model was designed to have the same natural frequency <strong>and</strong> the same damping ratio as the<br />
real building. The <strong>isolation</strong> <strong>system</strong> was composed of six <strong>spring</strong>s <strong>and</strong> four dampers. The<br />
accelerations at the top <strong>and</strong> bottom of the frame, <strong>and</strong> the relative displacement between the<br />
bottom of the frame <strong>and</strong> the top of the shaking table were measured. Fig. 15 shows the model <strong>and</strong><br />
measurement points.<br />
5.1.2 Loading<br />
(1) Sinusoidal sweep excitation<br />
The model was shaken by a sinusoidal sweep wave in the direction of the longer side (X), the<br />
shorter side (Y) <strong>and</strong> the vertical direction (Z). The acceleration was 20 gal <strong>and</strong> the range of<br />
frequency was 0.3 Hz - 10.0 Hz.<br />
(2) Seismic excitation<br />
Taft wave, El Centro wave <strong>and</strong> Hachinohe wave were used for the input of the shaking table. For<br />
each seismic wave the model was shaken in Y direction only, Y <strong>and</strong> Z directions combined <strong>and</strong> all<br />
three directions.<br />
5.2 Analytical method<br />
The analytical method of the shaking table test was the same as the one explained already above.<br />
The analysis model is shown in Fig. 16. The upper structure was assumed to be a shear beam<br />
element. The weight of the model was concentrated in two separate masses at the top <strong>and</strong> the<br />
bottom. The material properties of the analysis model were based on the results of a r<strong>and</strong>om noise<br />
test without the <strong>isolation</strong> <strong>system</strong>.<br />
4-parameter model<br />
Longitudinal cross section Lateral cross section<br />
Fig. 15 Specimen Fig. 16 Analysis model
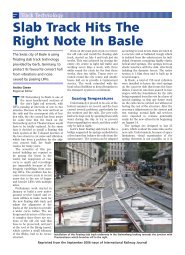
5.3 Comparison of the shaking table test <strong>and</strong> the simulation<br />
5.3.1 Vibration properties<br />
The natural frequencies are in both cases very similar. The amplitude of the simulation is a little<br />
smaller than that of the shaking table test.<br />
5.3.2 Seismic excitation<br />
The Y direction response time history for the three dimensional Taft wave excitation is shown in<br />
Fig. 17. The amplitudes of the simulation are smaller than those of the table test. But acceleration<br />
<strong>and</strong> displacement are very similar. The similarity confirms the accuracy of the model.<br />
The maximum response acceleration ratio of the model at the maximum acceleration of the<br />
shaking table is shown in Table 4. In the cases of El Centro wave <strong>and</strong> Hachinohe wave the results<br />
are for one dimensional excitation. In the case of Taft wave those are for one, two <strong>and</strong> three<br />
dimensional excitation.<br />
The response acceleration ratio increased only a little bit horizontally, but vertically more for the<br />
three dimensional excitation than for the two dimensional one.<br />
Fig. 17 Y-direction time history response (for TAFT 3-D) Table 4 Maximum acceleration response amplitude<br />
6. CONCLUSION<br />
A four story building was designed <strong>and</strong> certified for the maximum response. From our<br />
investigations the following can be concluded.<br />
1) In the <strong>vibration</strong> isolated building supported by <strong>spring</strong>s <strong>and</strong> <strong>visco</strong>-elastic dampers <strong>vibration</strong> <strong>and</strong><br />
structure borne noise levels caused by traffic will be effectively reduced.<br />
2) The characteristics of the dampers can be modelled properly by a 4 parameter model<br />
respectively those of the <strong>spring</strong>s by a multi-direction shear <strong>spring</strong>.<br />
3) The 3 dimensional analysis of the models shows a good coincidence with the shaking table test,<br />
so that it can be used for analyzing a real building with a <strong>vibration</strong> <strong>isolation</strong> <strong>system</strong>.