- Page 1 and 2:
TEAMFLY
- Page 6:
Data Mining Techniques For Marketin
- Page 10:
To Stephanie, Sasha, and Nathaniel.
- Page 16:
xx Acknowledgments And, of course,
- Page 20:
TEAMFLY Team-Fly ®
- Page 24:
xxiv Introduction Even if the techn
- Page 30:
Contents Acknowledgments About the
- Page 34:
Contents vii Learning Things That A
- Page 38:
Contents ix Different Kinds of Chur
- Page 42:
Contents xi Chapter 8 How Does a Ne
- Page 46:
Contents xiii Case Study: Who Is Us
- Page 50:
Contents xv Chapter 14 Data Mining
- Page 54:
Contents xvii Availability of Train
- Page 58:
CHAPTER 1 Why and What Is Data Mini
- Page 62:
Why and What Is Data Mining? 3 In t
- Page 66:
Why and What Is Data Mining? 5 many
- Page 70:
Why and What Is Data Mining? 7 DATA
- Page 74:
Why and What Is Data Mining? 9 Clas
- Page 78:
Why and What Is Data Mining? 11 cho
- Page 82:
Why and What Is Data Mining? 13 man
- Page 86:
Why and What Is Data Mining? 15 Com
- Page 90:
Why and What Is Data Mining? 17 sit
- Page 94:
Why and What Is Data Mining? 19 And
- Page 100:
22 Chapter 2 Data is at the heart o
- Page 104:
24 Chapter 2 Marketing literature f
- Page 108:
26 Chapter 2 What Is the Virtuous C
- Page 112:
28 Chapter 2 that lurking inside th
- Page 116:
30 Chapter 2 possible to identify t
- Page 120:
32 Chapter 2 All of these measureme
- Page 124:
34 Chapter 2 Data mining results ch
- Page 128:
36 Chapter 2 Quota Savings Randomiz
- Page 132:
38 Chapter 2 Some of these fields r
- Page 136:
40 Chapter 2 How Data Mining Was Ap
- Page 140:
42 Chapter 2 smaller group of likel
- Page 144:
44 Chapter 3 years, the authors hav
- Page 148:
46 Chapter 3 Ford is the only one w
- Page 152:
48 Chapter 3 Figure 3.2 shows anoth
- Page 156:
50 Chapter 3 The data mining method
- Page 160:
52 Chapter 3 In the most general se
- Page 164:
54 Chapter 3 of maleness. It seems
- Page 168:
56 Chapter 3 Step One: Translate th
- Page 172:
58 Chapter 3 ■■ ■■ ■■ C
- Page 176:
60 Chapter 3 Data mining is often p
- Page 180:
62 Chapter 3 These operational syst
- Page 184:
64 Chapter 3 Often, variables that
- Page 188:
66 Chapter 3 90% 80% 70% 60% 50% 40
- Page 192:
68 Chapter 3 advantage as smarter p
- Page 196:
70 Chapter 3 Including Multiple Tim
- Page 200:
72 Chapter 3 People often find it h
- Page 204:
74 Chapter 3 When missing values mu
- Page 208:
76 Chapter 3 category, such as bake
- Page 212:
78 Chapter 3 Step Eight: Assess Mod
- Page 216:
80 Chapter 3 Percent of Row Frequen
- Page 220:
82 Chapter 3 An example helps to ex
- Page 224:
84 Chapter 3 Lift Value 1.5 1.4 1.3
- Page 228:
86 Chapter 3 before. The newly disc
- Page 232:
88 Chapter 4 comes from traditional
- Page 236:
90 Chapter 4 based on price will no
- Page 240:
92 Chapter 4 The problem with this
- Page 244:
94 Chapter 4 DATA BY CENSUS TRACT T
- Page 248:
96 Chapter 4 Actually, the first le
- Page 252:
98 Chapter 4 ROC CURVES Models are
- Page 256:
100 Chapter 4 The upper, curved lin
- Page 260:
102 Chapter 4 BENEFIT (continued) A
- Page 264:
104 Chapter 4 A smaller, better-tar
- Page 268:
106 Chapter 4 Reaching the People M
- Page 272:
108 Chapter 4 Difference in respons
- Page 276:
110 Chapter 4 Among the most useful
- Page 280:
112 Chapter 4 More typically, a bus
- Page 284:
114 Chapter 4 Nonrepayment of debt
- Page 288:
116 Chapter 4 Making Recommendation
- Page 292:
118 Chapter 4 Retention campaigns c
- Page 296:
120 Chapter 4 information than simp
- Page 300:
122 Chapter 4 From a data mining pe
- Page 304:
124 Chapter 5 What is remarkable an
- Page 308:
126 Chapter 5 TIP The simplest expl
- Page 312:
128 Chapter 5 Time Series Histogram
- Page 316:
130 Chapter 5 The Central Limit The
- Page 320:
132 Chapter 5 A QUESTION OF TERMINO
- Page 324:
134 Chapter 5 small probability. Pr
- Page 328:
136 Chapter 5 Cross-Tabulations Tim
- Page 332:
138 Chapter 5 In addition, various
- Page 336:
140 Chapter 5 the challenger offer.
- Page 340:
142 Chapter 5 Table 5.2 The 95 Perc
- Page 344:
144 Chapter 5 Table 5.3 The 95 Perc
- Page 348:
146 Chapter 5 What the Confidence I
- Page 352:
148 Chapter 5 says that with contro
- Page 356:
150 Chapter 5 The appeal of the chi
- Page 360:
152 Chapter 5 distribution depends
- Page 364:
154 Chapter 5 Table 5.7 Chi-Square
- Page 368:
156 Chapter 5 Table 5.8 Chi-Square
- Page 372:
158 Chapter 5 100% 80% 60% 40% 20%
- Page 376:
160 Chapter 5 There Is a Lot of Dat
- Page 380:
162 Chapter 5 Figure 5.11 shows ano
- Page 386:
CHAPTER 6 Decision Trees Decision t
- Page 390:
Decision Trees 167 thinks of a part
- Page 394:
Decision Trees 169 Scoring Figure 6
- Page 398:
Decision Trees 171 50% tot units de
- Page 402:
Decision Trees 173 The first split
- Page 406:
Decision Trees 175 the best splits,
- Page 410:
Decision Trees 177 Purity and Diver
- Page 414:
Decision Trees 179 Entropy Reductio
- Page 418:
Decision Trees 181 COMPARING TWO SP
- Page 422:
Decision Trees 183 statistical rela
- Page 426:
Decision Trees 185 The CART Pruning
- Page 430:
Decision Trees 187 COMPARING MISCLA
- Page 434:
Decision Trees 189 Picking the Best
- Page 438:
Decision Trees 191 The trees grown
- Page 442:
Decision Trees 193 WARNING Small no
- Page 446:
Decision Trees 195 Taking Cost into
- Page 450:
Decision Trees 197 Voter #1 and Vot
- Page 454:
Decision Trees 199 Neural Trees One
- Page 458:
Decision Trees 201 part of the targ
- Page 462:
Decision Trees 203 Decision Trees i
- Page 466:
Decision Trees 205 Applying Decisio
- Page 470:
Decision Trees 207 USING DECISION T
- Page 474:
Decision Trees 209 enjoyed using th
- Page 480:
212 Chapter 7 probing neural networ
- Page 484:
214 Chapter 7 of the value of the p
- Page 488:
216 Chapter 7 Table 7.1 Common Feat
- Page 492:
218 Chapter 7 Year_Built (1923), su
- Page 496:
220 Chapter 7 The solution is to in
- Page 500:
222 Chapter 7 Feed-forward networks
- Page 504:
224 Chapter 7 magnitude of the weig
- Page 508:
226 Chapter 7 Feed-Forward Neural N
- Page 512:
228 Chapter 7 last purchase age gen
- Page 516:
230 Chapter 7 TRAINING AS OPTIMIZAT
- Page 520:
232 Chapter 7 networks now takes se
- Page 524:
234 Chapter 7 Size of Training Set
- Page 528:
236 Chapter 7 This transformation (
- Page 532:
238 Chapter 7 Features with Ordered
- Page 536:
240 Chapter 7 be mapped to -1.0, -0
- Page 540:
242 Chapter 7 pattern the network f
- Page 544:
244 Chapter 7 1.0 B B B B A A B 0.0
- Page 548:
246 Chapter 7 Notice that the time-
- Page 552:
248 Chapter 7 2. Measure the output
- Page 556:
250 Chapter 7 The output units comp
- Page 560:
252 Chapter 7 unknown instance is f
- Page 564:
254 Chapter 7 The story continues w
- Page 570:
CHAPTER 8 Nearest Neighbor Approach
- Page 574:
Memory-Based Reasoning and Collabor
- Page 578:
Memory-Based Reasoning and Collabor
- Page 582:
Memory-Based Reasoning and Collabor
- Page 586:
Memory-Based Reasoning and Collabor
- Page 590:
Memory-Based Reasoning and Collabor
- Page 594:
Memory-Based Reasoning and Collabor
- Page 598:
Memory-Based Reasoning and Collabor
- Page 602:
Memory-Based Reasoning and Collabor
- Page 606:
Memory-Based Reasoning and Collabor
- Page 610:
Memory-Based Reasoning and Collabor
- Page 614:
Memory-Based Reasoning and Collabor
- Page 618:
Memory-Based Reasoning and Collabor
- Page 622:
Memory-Based Reasoning and Collabor
- Page 626:
Memory-Based Reasoning and Collabor
- Page 630:
CHAPTER 9 Market Basket Analysis an
- Page 634:
Market Basket Analysis and Associat
- Page 638:
Market Basket Analysis and Associat
- Page 642:
Market Basket Analysis and Associat
- Page 646:
Market Basket Analysis and Associat
- Page 650:
Market Basket Analysis and Associat
- Page 654:
Market Basket Analysis and Associat
- Page 658:
Market Basket Analysis and Associat
- Page 662:
Market Basket Analysis and Associat
- Page 666:
Market Basket Analysis and Associat
- Page 670:
Market Basket Analysis and Associat
- Page 674:
Market Basket Analysis and Associat
- Page 678:
Market Basket Analysis and Associat
- Page 682:
Market Basket Analysis and Associat
- Page 686:
Market Basket Analysis and Associat
- Page 690:
Market Basket Analysis and Associat
- Page 694:
Market Basket Analysis and Associat
- Page 698:
CHAPTER 10 Link Analysis The intern
- Page 702:
Link Analysis 323 four people, all
- Page 706:
Link Analysis 325 Bananas Red Leaf
- Page 710:
Link Analysis 327 WHY DO THE DEGREE
- Page 714:
Link Analysis 329 This lack of scal
- Page 718:
Link Analysis 331 cannot be part of
- Page 722:
Link Analysis 333 a link to Harvard
- Page 726:
Link Analysis 335 Hubs Authorities
- Page 730:
Link Analysis 337 There are many ap
- Page 734:
Link Analysis 339 is good for guida
- Page 738:
Link Analysis 341 Figure 10.10 show
- Page 742:
Link Analysis 343 Case Study: Segme
- Page 746:
Link Analysis 345 Jane also racks u
- Page 750:
Link Analysis 347 Although link ana
- Page 756:
350 Chapter 11 autumn, typically to
- Page 760:
352 Chapter 11 Two different astron
- Page 764:
354 Chapter 11 Unlike the tradition
- Page 768:
356 Chapter 11 X 2 X 1 Figure 11.4
- Page 772:
358 Chapter 11 Figure 11.6 These ex
- Page 776:
360 Chapter 11 True measures are in
- Page 780:
362 Chapter 11 The angle between ve
- Page 784:
364 Chapter 11 But what if X is mea
- Page 788:
366 Chapter 11 Gaussian mixture mod
- Page 792:
368 Chapter 11 Agglomerative Cluste
- Page 796:
370 Chapter 11 Clusters and Trees T
- Page 800:
372 Chapter 11 algorithm is to supp
- Page 804:
374 Chapter 11 Case Study: Clusteri
- Page 808:
376 Chapter 11 Each of the scores o
- Page 812:
378 Chapter 11 N W E S 0 2.5 5 mile
- Page 816:
380 Chapter 11 Using Thematic Clust
- Page 820:
TEAMFLY Team-Fly ®
- Page 824:
384 Chapter 12 of loyalty—that th
- Page 828:
386 Chapter 12 may be one-time only
- Page 832:
388 Chapter 12 100% 90% 80% Percent
- Page 836:
390 Chapter 12 100% 90% 80% Percent
- Page 840:
392 Chapter 12 PARAMETRIC APPROACHE
- Page 844:
394 Chapter 12 Hazards The precedin
- Page 848:
396 Chapter 12 The same idea can be
- Page 852:
398 Chapter 12 When the contract is
- Page 856:
400 Chapter 12 time Figure 12.7 In
- Page 860:
402 Chapter 12 Table 12.4 From Time
- Page 864:
404 Chapter 12 These two customers
- Page 868:
406 Chapter 12 At any point in time
- Page 872:
408 Chapter 12 A NOTE ABOUT SURVIVA
- Page 876:
410 Chapter 12 Stratification: Meas
- Page 880:
412 Chapter 12 The biggest assumpti
- Page 884:
Hazard Probability ("Risk" of React
- Page 888:
416 Chapter 12 Number Actual Predic
- Page 892:
418 Chapter 12 100% 90% 80% 70% Sur
- Page 898:
CHAPTER 13 Genetic Algorithms Like
- Page 902:
Genetic Algorithms 423 The first wo
- Page 906:
Genetic Algorithms 425 GAs work by
- Page 910:
Genetic Algorithms 427 SIMPLE OVERV
- Page 914:
Genetic Algorithms 429 Selection Th
- Page 918:
Genetic Algorithms 431 Table 13.4 T
- Page 922:
Genetic Algorithms 433 the genome.
- Page 926:
Genetic Algorithms 435 which were v
- Page 930:
Genetic Algorithms 437 010 011 01*
- Page 934:
Genetic Algorithms 439 Application
- Page 938:
Genetic Algorithms 441 ■■ ■
- Page 942:
Genetic Algorithms 443 The comment
- Page 946:
Genetic Algorithms 445 easily confu
- Page 950:
CHAPTER 14 Data Mining throughout t
- Page 954:
Data Mining throughout the Customer
- Page 958:
Data Mining throughout the Customer
- Page 962:
Data Mining throughout the Customer
- Page 966:
Data Mining throughout the Customer
- Page 970:
Data Mining throughout the Customer
- Page 974:
Data Mining throughout the Customer
- Page 978:
Data Mining throughout the Customer
- Page 982:
Data Mining throughout the Customer
- Page 986:
Data Mining throughout the Customer
- Page 990:
Data Mining throughout the Customer
- Page 994:
Data Mining throughout the Customer
- Page 998:
Data Mining throughout the Customer
- Page 1002:
CHAPTER 15 Data Warehousing, OLAP,
- Page 1006:
Data Warehousing, OLAP, and Data Mi
- Page 1010:
Data Warehousing, OLAP, and Data Mi
- Page 1014:
Data Warehousing, OLAP, and Data Mi
- Page 1018:
Data Warehousing, OLAP, and Data Mi
- Page 1022:
Data Warehousing, OLAP, and Data Mi
- Page 1026:
Data Warehousing, OLAP, and Data Mi
- Page 1030:
Data Warehousing, OLAP, and Data Mi
- Page 1034:
Data Warehousing, OLAP, and Data Mi
- Page 1038:
Data Warehousing, OLAP, and Data Mi
- Page 1042:
Data Warehousing, OLAP, and Data Mi
- Page 1046:
Data Warehousing, OLAP, and Data Mi
- Page 1050:
Data Warehousing, OLAP, and Data Mi
- Page 1054:
Data Warehousing, OLAP, and Data Mi
- Page 1058:
Data Warehousing, OLAP, and Data Mi
- Page 1062:
Data Warehousing, OLAP, and Data Mi
- Page 1066:
Data Warehousing, OLAP, and Data Mi
- Page 1070:
Data Warehousing, OLAP, and Data Mi
- Page 1074:
Data Warehousing, OLAP, and Data Mi
- Page 1078:
Data Warehousing, OLAP, and Data Mi
- Page 1082:
CHAPTER 16 Building the Data Mining
- Page 1086:
Building the Data Mining Environmen
- Page 1090:
Building the Data Mining Environmen
- Page 1094:
Building the Data Mining Environmen
- Page 1098:
Building the Data Mining Environmen
- Page 1102:
Building the Data Mining Environmen
- Page 1106:
Building the Data Mining Environmen
- Page 1110:
Building the Data Mining Environmen
- Page 1114:
Building the Data Mining Environmen
- Page 1118:
Building the Data Mining Environmen
- Page 1122:
Building the Data Mining Environmen
- Page 1126:
Building the Data Mining Environmen
- Page 1130:
Building the Data Mining Environmen
- Page 1134:
CHAPTER 17 Preparing Data for Minin
- Page 1138:
Preparing Data for Mining 541 a sig
- Page 1142:
Preparing Data for Mining 543 Histo
- Page 1146:
Preparing Data for Mining 545 data
- Page 1150:
Preparing Data for Mining 547 varia
- Page 1154:
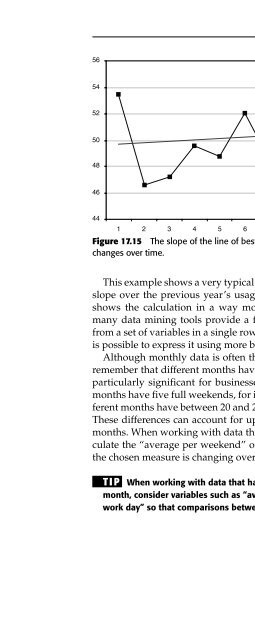
Preparing Data for Mining 549 Figur
- Page 1158:
Preparing Data for Mining 551 7,000
- Page 1162: Preparing Data for Mining 553 Chara
- Page 1166: Preparing Data for Mining 555 Ameri
- Page 1170: Preparing Data for Mining 557 Our r
- Page 1174: Preparing Data for Mining 559 Once
- Page 1178: Preparing Data for Mining 561 RESI
- Page 1182: Preparing Data for Mining 563 This
- Page 1186: Preparing Data for Mining 565 error
- Page 1190: Preparing Data for Mining 567 10,00
- Page 1194: Preparing Data for Mining 569 The f
- Page 1198: Preparing Data for Mining 571 Somet
- Page 1202: Preparing Data for Mining 573 PIVOT
- Page 1206: Preparing Data for Mining 575 ■
- Page 1210: Preparing Data for Mining 577 Purch
- Page 1216: 580 Chapter 17 Revolvers, Transacto
- Page 1220: 582 Chapter 17 Table 17.5 Six Credi
- Page 1224: 584 Chapter 17 Table 17.6 Potential
- Page 1228: 586 Chapter 17 $2,000 $1,500 $1,000
- Page 1232: 588 Chapter 17 120 Payment as Multi
- Page 1236: 590 Chapter 17 The Dark Side of Dat
- Page 1240: 592 Chapter 17 Dirty Data Dirty dat
- Page 1244: 594 Chapter 17 and so on. However,
- Page 1248: 596 Chapter 17 varies from tool to
- Page 1252: 598 Chapter 18 Getting Started The
- Page 1256: 600 Chapter 18 These are areas wher
- Page 1260: 602 Chapter 18 proof-of-concept pro
- Page 1264:
604 Chapter 18 Although the details
- Page 1268:
606 Chapter 18 less likely to churn
- Page 1272:
608 Chapter 18 from one record to a
- Page 1276:
610 Chapter 18 are appropriate for
- Page 1280:
612 Chapter 18 serial number and ph
- Page 1284:
614 Chapter 18 plan allows. Since t
- Page 1288:
616 Index analysis differential res
- Page 1292:
618 Index auxiliary information, 56
- Page 1296:
620 Index champion-challenger appro
- Page 1300:
622 Index creative process, data mi
- Page 1304:
624 Index data (continued) missing
- Page 1308:
626 Index discrete outcomes, classi
- Page 1312:
628 Index genetic algorithms case s
- Page 1316:
630 Index intuition, data explorati
- Page 1320:
632 Index memory-based reasoning (M
- Page 1324:
634 Index new customer information
- Page 1328:
636 Index proof-of-concept projects
- Page 1332:
638 Index response, survey response
- Page 1336:
640 Index SQL data, time series ana
- Page 1340:
642 Index testing (continued) KS (K