- Page 1 and 2:
TEAMFLY
- Page 6:
Data Mining Techniques For Marketin
- Page 10:
To Stephanie, Sasha, and Nathaniel.
- Page 16:
xx Acknowledgments And, of course,
- Page 20:
TEAMFLY Team-Fly ®
- Page 24:
xxiv Introduction Even if the techn
- Page 30:
Contents Acknowledgments About the
- Page 34:
Contents vii Learning Things That A
- Page 38:
Contents ix Different Kinds of Chur
- Page 42:
Contents xi Chapter 8 How Does a Ne
- Page 46:
Contents xiii Case Study: Who Is Us
- Page 50:
Contents xv Chapter 14 Data Mining
- Page 54:
Contents xvii Availability of Train
- Page 58:
CHAPTER 1 Why and What Is Data Mini
- Page 62:
Why and What Is Data Mining? 3 In t
- Page 66:
Why and What Is Data Mining? 5 many
- Page 70:
Why and What Is Data Mining? 7 DATA
- Page 74:
Why and What Is Data Mining? 9 Clas
- Page 78:
Why and What Is Data Mining? 11 cho
- Page 82:
Why and What Is Data Mining? 13 man
- Page 86:
Why and What Is Data Mining? 15 Com
- Page 90:
Why and What Is Data Mining? 17 sit
- Page 94:
Why and What Is Data Mining? 19 And
- Page 100:
22 Chapter 2 Data is at the heart o
- Page 104:
24 Chapter 2 Marketing literature f
- Page 108:
26 Chapter 2 What Is the Virtuous C
- Page 112:
28 Chapter 2 that lurking inside th
- Page 116:
30 Chapter 2 possible to identify t
- Page 120:
32 Chapter 2 All of these measureme
- Page 124:
34 Chapter 2 Data mining results ch
- Page 128:
36 Chapter 2 Quota Savings Randomiz
- Page 132:
38 Chapter 2 Some of these fields r
- Page 136:
40 Chapter 2 How Data Mining Was Ap
- Page 140:
42 Chapter 2 smaller group of likel
- Page 144:
44 Chapter 3 years, the authors hav
- Page 148:
46 Chapter 3 Ford is the only one w
- Page 152:
48 Chapter 3 Figure 3.2 shows anoth
- Page 156:
50 Chapter 3 The data mining method
- Page 160:
52 Chapter 3 In the most general se
- Page 164:
54 Chapter 3 of maleness. It seems
- Page 168:
56 Chapter 3 Step One: Translate th
- Page 172:
58 Chapter 3 ■■ ■■ ■■ C
- Page 176:
60 Chapter 3 Data mining is often p
- Page 180:
62 Chapter 3 These operational syst
- Page 184:
64 Chapter 3 Often, variables that
- Page 188:
66 Chapter 3 90% 80% 70% 60% 50% 40
- Page 192:
68 Chapter 3 advantage as smarter p
- Page 196:
70 Chapter 3 Including Multiple Tim
- Page 200:
72 Chapter 3 People often find it h
- Page 204:
74 Chapter 3 When missing values mu
- Page 208:
76 Chapter 3 category, such as bake
- Page 212: 78 Chapter 3 Step Eight: Assess Mod
- Page 216: 80 Chapter 3 Percent of Row Frequen
- Page 220: 82 Chapter 3 An example helps to ex
- Page 224: 84 Chapter 3 Lift Value 1.5 1.4 1.3
- Page 228: 86 Chapter 3 before. The newly disc
- Page 232: 88 Chapter 4 comes from traditional
- Page 236: 90 Chapter 4 based on price will no
- Page 240: 92 Chapter 4 The problem with this
- Page 244: 94 Chapter 4 DATA BY CENSUS TRACT T
- Page 248: 96 Chapter 4 Actually, the first le
- Page 252: 98 Chapter 4 ROC CURVES Models are
- Page 256: 100 Chapter 4 The upper, curved lin
- Page 260: 102 Chapter 4 BENEFIT (continued) A
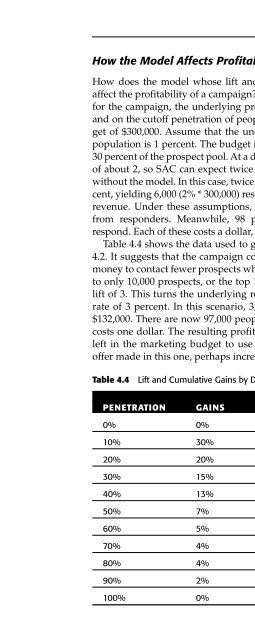
- Page 266: Data Mining Applications 105 $400,0
- Page 270: Data Mining Applications 107 before
- Page 274: Data Mining Applications 109 Start
- Page 278: Data Mining Applications 111 can be
- Page 282: Data Mining Applications 113 The bi
- Page 286: Data Mining Applications 115 Costs
- Page 290: Data Mining Applications 117 and so
- Page 294: Data Mining Applications 119 From a
- Page 298: Data Mining Applications 121 to ass
- Page 302: CHAPTER 5 The Lure of Statistics: D
- Page 306: The Lure of Statistics: Data Mining
- Page 310: Cumulative Proportion The Lure of S
- Page 314:
The Lure of Statistics: Data Mining
- Page 318:
The Lure of Statistics: Data Mining
- Page 322:
The Lure of Statistics: Data Mining
- Page 326:
The Lure of Statistics: Data Mining
- Page 330:
The Lure of Statistics: Data Mining
- Page 334:
The Lure of Statistics: Data Mining
- Page 338:
The Lure of Statistics: Data Mining
- Page 342:
The Lure of Statistics: Data Mining
- Page 346:
The Lure of Statistics: Data Mining
- Page 350:
The Lure of Statistics: Data Mining
- Page 354:
The Lure of Statistics: Data Mining
- Page 358:
The Lure of Statistics: Data Mining
- Page 362:
The Lure of Statistics: Data Mining
- Page 366:
The Lure of Statistics: Data Mining
- Page 370:
The Lure of Statistics: Data Mining
- Page 374:
The Lure of Statistics: Data Mining
- Page 378:
The Lure of Statistics: Data Mining
- Page 382:
The Lure of Statistics: Data Mining
- Page 388:
166 Chapter 6 rule (such as income
- Page 392:
168 Chapter 6 1 1 lifetime orders <
- Page 396:
170 Chapter 6 For many applications
- Page 400:
172 Chapter 6 Finding the Splits At
- Page 404:
174 Chapter 6 Splitting on a Catego
- Page 408:
176 Chapter 6 claims were paid auto
- Page 412:
178 Chapter 6 Purity measures for e
- Page 416:
180 Chapter 6 To calculate the tota
- Page 420:
182 Chapter 6 COMPARING TWO SPLITS
- Page 424:
184 Chapter 6 does for continuous v
- Page 428:
186 Chapter 6 COMPARING MISCLASSIFI
- Page 432:
188 Chapter 6 COMPARING MISCLASSIFI
- Page 436:
190 Chapter 6 Error Rate Prune here
- Page 440:
192 Chapter 6 Miner using its defau
- Page 444:
194 Chapter 6 Watch the game? No Ye
- Page 448:
196 Chapter 6 Table 6.1 All Possibl
- Page 452:
198 Chapter 6 space, the correspond
- Page 456:
200 Chapter 6 Last Movie in Group L
- Page 460:
202 Chapter 6 TEAMFLY Figure 6.15 A
- Page 464:
204 Chapter 6 Figure 6.16 Miner. A
- Page 468:
206 Chapter 6 Simulating the Future
- Page 472:
208 Chapter 6 USING DECISION TREES
- Page 478:
CHAPTER 7 Artificial Neural Network
- Page 482:
Artificial Neural Networks 213 This
- Page 486:
Artificial Neural Networks 215 The
- Page 490:
Artificial Neural Networks 217 Tabl
- Page 494:
Artificial Neural Networks 219 Neur
- Page 498:
Artificial Neural Networks 221 inpu
- Page 502:
Artificial Neural Networks 223 outp
- Page 506:
Artificial Neural Networks 225 SIGM
- Page 510:
Artificial Neural Networks 227 The
- Page 514:
Artificial Neural Networks 229 to c
- Page 518:
Artificial Neural Networks 231 The
- Page 522:
Artificial Neural Networks 233 This
- Page 526:
Artificial Neural Networks 235 TIP
- Page 530:
Artificial Neural Networks 237 can
- Page 534:
Artificial Neural Networks 239 The
- Page 538:
Artificial Neural Networks 241 Othe
- Page 542:
Artificial Neural Networks 243 The
- Page 546:
Artificial Neural Networks 245 or d
- Page 550:
Artificial Neural Networks 247 Tabl
- Page 554:
Artificial Neural Networks 249 Self
- Page 558:
Artificial Neural Networks 251 The
- Page 562:
Artificial Neural Networks 253 ther
- Page 566:
Artificial Neural Networks 255 can
- Page 572:
258 Chapter 8 obvious geometric int
- Page 576:
260 Chapter 8 The first stage of MB
- Page 580:
262 Chapter 8 One possible combinat
- Page 584:
264 Chapter 8 1 0.9 0.8 0.7 0.6 0.5
- Page 588:
266 Chapter 8 What Are the Codes? T
- Page 592:
268 Chapter 8 USING RELEVANCE FEEDB
- Page 596:
270 Chapter 8 Choosing the Number o
- Page 600:
272 Chapter 8 3. Commutativity. Dir
- Page 604:
274 Chapter 8 MEASURING THE EFFECTI
- Page 608:
276 Chapter 8 Gender is an example
- Page 612:
278 Chapter 8 Furthermore, there is
- Page 616:
280 Chapter 8 In Table 8.12, the fi
- Page 620:
282 Chapter 8 Table 8.16 Confidence
- Page 624:
284 Chapter 8 Comparing Profiles On
- Page 628:
286 Chapter 8 produces better resul
- Page 632:
288 Chapter 9 In this shopping bask
- Page 636:
290 Chapter 9 The order is the fund
- Page 640:
292 Chapter 9 Order Characteristics
- Page 644:
294 Chapter 9 450 400 Mail Drop 350
- Page 648:
296 Chapter 9 Association Rules One
- Page 652:
298 Chapter 9 explanation: Is the d
- Page 656:
300 Chapter 9 This simple co-occurr
- Page 660:
302 Chapter 9 Detergent 1 0 0 1 1 S
- Page 664:
304 Chapter 9 Table 9.3 Transaction
- Page 668:
306 Chapter 9 The number of combina
- Page 672:
308 Chapter 9 Data Quality The data
- Page 676:
310 Chapter 9 Table 9.6 Confidence
- Page 680:
312 Chapter 9 For instance, in the
- Page 684:
314 Chapter 9 A pizza restaurant ha
- Page 688:
316 Chapter 9 TIP Adding virtual tr
- Page 692:
318 Chapter 9 Sequential Analysis U
- Page 696:
320 Chapter 9 Market basket analysi
- Page 700:
322 Chapter 10 often yields very in
- Page 704:
324 Chapter 10 Oops! These edges in
- Page 708:
326 Chapter 10 A C D Pregel River N
- Page 712:
328 Chapter 10 leaves the car in th
- Page 716:
330 Chapter 10 Directed Graphs The
- Page 720:
332 Chapter 10 The Kleinberg Algori
- Page 724:
334 Chapter 10 Identifying the Cand
- Page 728:
336 Chapter 10 Hubs and Authorities
- Page 732:
338 Chapter 10 353 3658 00:00:41
- Page 736:
169 44 61 340 Chapter 10 The proces
- Page 740:
342 Chapter 10 USING SQL TO COLOR A
- Page 744:
5 MOU 344 Chapter 10 customer behav
- Page 748:
346 Chapter 10 Second, link analysi
- Page 754:
CHAPTER 11 Automatic Cluster Detect
- Page 758:
Automatic Cluster Detection 351 the
- Page 762:
Automatic Cluster Detection 353 The
- Page 766:
Automatic Cluster Detection 355 the
- Page 770:
Automatic Cluster Detection 357 X 2
- Page 774:
Automatic Cluster Detection 359 thi
- Page 778:
Automatic Cluster Detection 361 DIS
- Page 782:
Automatic Cluster Detection 363 Man
- Page 786:
Automatic Cluster Detection 365 Use
- Page 790:
Automatic Cluster Detection 367 The
- Page 794:
Automatic Cluster Detection 369 sub
- Page 798:
Automatic Cluster Detection 371 Dis
- Page 802:
Automatic Cluster Detection 373 is
- Page 806:
Automatic Cluster Detection 375 sig
- Page 810:
Automatic Cluster Detection 377 Cre
- Page 814:
Automatic Cluster Detection 379 Pop
- Page 818:
Automatic Cluster Detection 381 Les
- Page 822:
CHAPTER 12 Knowing When to Worry: H
- Page 826:
Hazard Functions and Survival Analy
- Page 830:
Hazard Functions and Survival Analy
- Page 834:
Hazard Functions and Survival Analy
- Page 838:
Hazard Functions and Survival Analy
- Page 842:
Hazard Functions and Survival Analy
- Page 846:
Hazard Functions and Survival Analy
- Page 850:
Hazard Functions and Survival Analy
- Page 854:
Hazard Functions and Survival Analy
- Page 858:
1 Hazard Functions and Survival Ana
- Page 862:
Hazard Functions and Survival Analy
- Page 866:
Hazard Functions and Survival Analy
- Page 870:
Hazard Functions and Survival Analy
- Page 874:
Hazard Functions and Survival Analy
- Page 878:
Hazard Functions and Survival Analy
- Page 882:
Hazard Functions and Survival Analy
- Page 886:
Hazard Functions and Survival Analy
- Page 890:
Hazard Functions and Survival Analy
- Page 894:
Hazard Functions and Survival Analy
- Page 900:
422 Chapter 13 problems involving c
- Page 904:
424 Chapter 13 template for the hum
- Page 908:
426 Chapter 13 generation n generat
- Page 912:
428 Chapter 13 SIMPLE OVERVIEW OF G
- Page 916:
430 Chapter 13 Table 13.3 The Popul
- Page 920:
432 Chapter 13 Table 13.5 The Popul
- Page 924:
434 Chapter 13 So far, this problem
- Page 928:
436 Chapter 13 schema match the cor
- Page 932:
438 Chapter 13 The Schema Theorem e
- Page 936:
440 Chapter 13 The first problem fa
- Page 940:
442 Chapter 13 trained to fill in a
- Page 944:
444 Chapter 13 Figure 13.7 The Gena
- Page 948:
446 Chapter 13 Lessons Learned Gene
- Page 952:
448 Chapter 14 has largely replaced
- Page 956:
450 Chapter 14 NO CUSTOMER RELATION
- Page 960:
452 Chapter 14 ■■ ■■ Automa
- Page 964:
454 Chapter 14 Such agent relations
- Page 968:
456 Chapter 14 Larger businesses, o
- Page 972:
458 Chapter 14 Subscription Relatio
- Page 976:
Respond from Some Channel Not Pay 4
- Page 980:
462 Chapter 14 Who Are the Prospect
- Page 984:
464 Chapter 14 What Is the Role of
- Page 988:
466 Chapter 14 New sales come in th
- Page 992:
468 Chapter 14 AN ENGINE FOR CHURN
- Page 996:
470 Chapter 14 Winback Once custome
- Page 1000:
TEAMFLY Team-Fly ®
- Page 1004:
474 Chapter 15 believe that, over t
- Page 1008:
476 Chapter 15 The level of abstrac
- Page 1012:
478 Chapter 15 effort. One of the g
- Page 1016:
480 Chapter 15 WHAT IS A RELATIONAL
- Page 1020:
482 Chapter 15 WHAT IS A RELATIONAL
- Page 1024:
484 Chapter 15 warehouse must be re
- Page 1028:
486 Chapter 15 One or more of these
- Page 1032:
488 Chapter 15 Central Repository T
- Page 1036:
490 Chapter 15 BACKGROUND ON PARALL
- Page 1040:
492 Chapter 15 important type of da
- Page 1044:
494 Chapter 15 The data warehouse i
- Page 1048:
496 Chapter 15 In the middle are of
- Page 1052:
498 Chapter 15 Shop Date Product sh
- Page 1056:
500 Chapter 15 The third type of cu
- Page 1060:
502 Chapter 15 ranges of customer v
- Page 1064:
504 Chapter 15 Conformed Dimensions
- Page 1068:
506 Chapter 15 In diagrams, the dim
- Page 1072:
508 Chapter 15 One of the problems
- Page 1076:
510 Chapter 15 graph. Neural networ
- Page 1080:
512 Chapter 15 A typical data wareh
- Page 1084:
514 Chapter 16 A Customer-Centric O
- Page 1088:
516 Chapter 16 data is not readily
- Page 1092:
518 Chapter 16 Operational Data (bi
- Page 1096:
520 Chapter 16 Collecting the Right
- Page 1100:
522 Chapter 16 devising new product
- Page 1104:
524 Chapter 16 direct mail decrease
- Page 1108:
526 Chapter 16 A new data mining gr
- Page 1112:
528 Chapter 16 Scoring is not compl
- Page 1116:
530 Chapter 16 three major modules,
- Page 1120:
532 Chapter 16 What is appealing ab
- Page 1124:
534 Chapter 16 account future growt
- Page 1128:
536 Chapter 16 Comprehensible Outpu
- Page 1132:
538 Chapter 16 step is to create a
- Page 1136:
540 Chapter 17 budget for buying ha
- Page 1140:
542 Chapter 17 It is perhaps unfort
- Page 1144:
544 Chapter 17 The distribution of
- Page 1148:
546 Chapter 17 Before ignoring a co
- Page 1152:
548 Chapter 17 Figure 17.4 Angoss K
- Page 1156:
550 Chapter 17 ■■ True numeric
- Page 1160:
552 Chapter 17 Dates and Times Date
- Page 1164:
554 Chapter 17 Neural networks and
- Page 1168:
556 Chapter 17 One of the most impo
- Page 1172:
558 Chapter 17 Constructing the Cus
- Page 1176:
560 Chapter 17 Identifying the Cust
- Page 1180:
562 Chapter 17 business customers o
- Page 1184:
564 Chapter 17 Making Progress Alth
- Page 1188:
566 Chapter 17 Changes over Time Pe
- Page 1192:
568 Chapter 17 DM TM WEB Credit Car
- Page 1196:
570 Chapter 17 When the lookup tabl
- Page 1200:
572 Chapter 17 Pivoting Regular Tim
- Page 1204:
574 Chapter 17 Summarizing Transact
- Page 1208:
576 Chapter 17 One method of calcul
- Page 1212:
578 Chapter 17 TIP When many differ
- Page 1216:
580 Chapter 17 Revolvers, Transacto
- Page 1220:
582 Chapter 17 Table 17.5 Six Credi
- Page 1224:
584 Chapter 17 Table 17.6 Potential
- Page 1228:
586 Chapter 17 $2,000 $1,500 $1,000
- Page 1232:
588 Chapter 17 120 Payment as Multi
- Page 1236:
590 Chapter 17 The Dark Side of Dat
- Page 1240:
592 Chapter 17 Dirty Data Dirty dat
- Page 1244:
594 Chapter 17 and so on. However,
- Page 1248:
596 Chapter 17 varies from tool to
- Page 1252:
598 Chapter 18 Getting Started The
- Page 1256:
600 Chapter 18 These are areas wher
- Page 1260:
602 Chapter 18 proof-of-concept pro
- Page 1264:
604 Chapter 18 Although the details
- Page 1268:
606 Chapter 18 less likely to churn
- Page 1272:
608 Chapter 18 from one record to a
- Page 1276:
610 Chapter 18 are appropriate for
- Page 1280:
612 Chapter 18 serial number and ph
- Page 1284:
614 Chapter 18 plan allows. Since t
- Page 1288:
616 Index analysis differential res
- Page 1292:
618 Index auxiliary information, 56
- Page 1296:
620 Index champion-challenger appro
- Page 1300:
622 Index creative process, data mi
- Page 1304:
624 Index data (continued) missing
- Page 1308:
626 Index discrete outcomes, classi
- Page 1312:
628 Index genetic algorithms case s
- Page 1316:
630 Index intuition, data explorati
- Page 1320:
632 Index memory-based reasoning (M
- Page 1324:
634 Index new customer information
- Page 1328:
636 Index proof-of-concept projects
- Page 1332:
638 Index response, survey response
- Page 1336:
640 Index SQL data, time series ana
- Page 1340:
642 Index testing (continued) KS (K