Undergraduate Research Journal
Undergraduate Research Journal
Undergraduate Research Journal

Create successful ePaper yourself
Turn your PDF publications into a flip-book with our unique Google optimized e-Paper software.
Molecular Analysis of the Interaction Between Staphylococcus aureus Protein Sbi and Immune System Protein C3d<br />
Wilson Rodriguez<br />
in terms of their electrostatic interactions. AESOP as a<br />
computational tool serves to provide researchers with a<br />
theoretical insight to protein physicochemical properties.<br />
The analysis can also be used in the design of proteins<br />
with desired functions, if these functions depend on the<br />
physicochemical properties under consideration (in our<br />
case electrostatic potentials). Molecular visualization and<br />
analysis outside AESOP was performed using the programs<br />
Chimera 10 and VMD. 11<br />
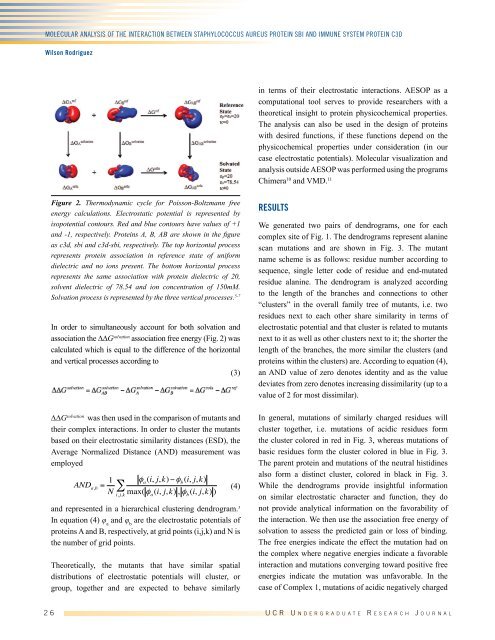
Figure 2. Thermodynamic cycle for Poisson-Boltzmann free<br />
energy calculations. Electrostatic potential is represented by<br />
isopotential contours. Red and blue contours have values of +1<br />
and -1, respectively. Proteins A, B, AB are shown in the figure<br />
as c3d, sbi and c3d-sbi, respectively. The top horizontal process<br />
represents protein association in reference state of uniform<br />
dielectric and no ions present. The bottom horizontal process<br />
represents the same association with protein dielectric of 20,<br />
solvent dielectric of 78.54 and ion concentration of 150mM.<br />
Solvation process is represented by the three vertical processes. 5-7<br />
In order to simultaneously account for both solvation and<br />
association the ∆∆G solvation association free energy (Fig. 2) was<br />
calculated which is equal to the difference of the horizontal<br />
and vertical processes according to<br />
(3)<br />
∆∆G solvation was then used in the comparison of mutants and<br />
their complex interactions. In order to cluster the mutants<br />
based on their electrostatic similarity distances (ESD), the<br />
Average Normalized Distance (AND) measurement was<br />
employed<br />
AND a,b<br />
= 1 ! a<br />
(i, j, k)!! b<br />
(i, j, k)<br />
" (4)<br />
N<br />
i, j,k<br />
max(! a<br />
(i, j, k) , ! b<br />
(i, j, k) )'<br />
and represented in a hierarchical clustering dendrogram. 5<br />
In equation (4) φ a<br />
and φ b<br />
are the electrostatic potentials of<br />
proteins A and B, respectively, at grid points (i,j,k) and N is<br />
the number of grid points.<br />
Theoretically, the mutants that have similar spatial<br />
distributions of electrostatic potentials will cluster, or<br />
group, together and are expected to behave similarly<br />
RESULTS<br />
We generated two pairs of dendrograms, one for each<br />
complex site of Fig. 1. The dendrograms represent alanine<br />
scan mutations and are shown in Fig. 3. The mutant<br />
name scheme is as follows: residue number according to<br />
sequence, single letter code of residue and end-mutated<br />
residue alanine. The dendrogram is analyzed according<br />
to the length of the branches and connections to other<br />
“clusters” in the overall family tree of mutants, i.e. two<br />
residues next to each other share similarity in terms of<br />
electrostatic potential and that cluster is related to mutants<br />
next to it as well as other clusters next to it; the shorter the<br />
length of the branches, the more similar the clusters (and<br />
proteins within the clusters) are. According to equation (4),<br />
an AND value of zero denotes identity and as the value<br />
deviates from zero denotes increasing dissimilarity (up to a<br />
value of 2 for most dissimilar).<br />
In general, mutations of similarly charged residues will<br />
cluster together, i.e. mutations of acidic residues form<br />
the cluster colored in red in Fig. 3, whereas mutations of<br />
basic residues form the cluster colored in blue in Fig. 3.<br />
The parent protein and mutations of the neutral histidines<br />
also form a distinct cluster, colored in black in Fig. 3.<br />
While the dendrograms provide insightful information<br />
on similar electrostatic character and function, they do<br />
not provide analytical information on the favorability of<br />
the interaction. We then use the association free energy of<br />
solvation to assess the predicted gain or loss of binding.<br />
The free energies indicate the effect the mutation had on<br />
the complex where negative energies indicate a favorable<br />
interaction and mutations converging toward positive free<br />
energies indicate the mutation was unfavorable. In the<br />
case of Complex 1, mutations of acidic negatively charged<br />
2 6 U C R U n d e r g r a d u a t e R e s e a r c h J o u r n a l