Undergraduate Research Journal
Undergraduate Research Journal
Undergraduate Research Journal

You also want an ePaper? Increase the reach of your titles
YUMPU automatically turns print PDFs into web optimized ePapers that Google loves.
Glassy-Winged Sharpshooter Population Survey and Xylella fastidiosa Detection<br />
Candice A. Sanscartier<br />
in the number of GWSS visiting the plants. After the<br />
population peak in August of 25 GWSSs collected,<br />
GWSS visitation declined steadily, reaching a low of<br />
3 insects collected. After the second, smaller peak in<br />
early October, with a maximum count of 9 GWSSs,<br />
the population dropped to 0 then increased to a few<br />
GWSSs for the remainder of the season.<br />
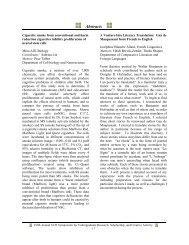
Real-time PCR analysis successfully detected the<br />
presence or absence of X. fastidiosa in collected<br />
samples (Figure 2), revealing an overall frequency<br />
of infection of 76 percent. We tested 83 of the 103<br />
GWSSs collected for the X. fastidiosa bacterium. Of<br />
those tested, 63 GWSSs showed positive results for X.<br />
fastidiosa. We saw two peaks in infection rates, the first<br />
from July 23rd to September 9th and the second peak<br />
from September 17th to October 15th. There were also<br />
two dramatic decreases in infection rate with 0 percent<br />
infection on dates September 10th and October 22nd.<br />
The weekly infection rates during the survey ranged<br />
from 50% to 100% positive per date, except those of<br />
September 10th and October 22nd.<br />
DISCUSSION<br />
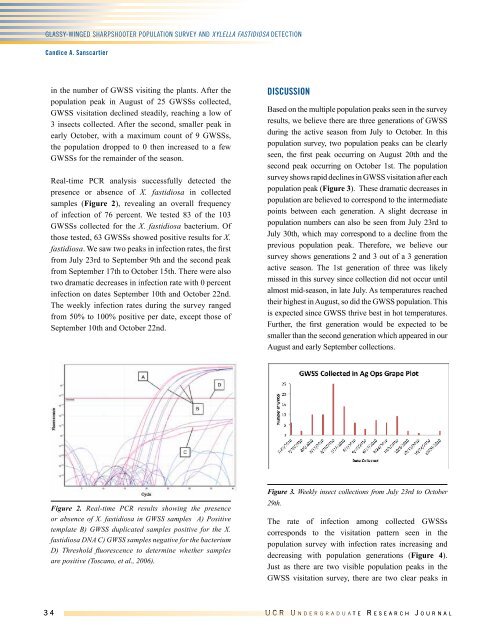
Based on the multiple population peaks seen in the survey<br />
results, we believe there are three generations of GWSS<br />
during the active season from July to October. In this<br />
population survey, two population peaks can be clearly<br />
seen, the first peak occurring on August 20th and the<br />
second peak occurring on October 1st. The population<br />
survey shows rapid declines in GWSS visitation after each<br />
population peak (Figure 3). These dramatic decreases in<br />
population are believed to correspond to the intermediate<br />
points between each generation. A slight decrease in<br />
population numbers can also be seen from July 23rd to<br />
July 30th, which may correspond to a decline from the<br />
previous population peak. Therefore, we believe our<br />
survey shows generations 2 and 3 out of a 3 generation<br />
active season. The 1st generation of three was likely<br />
missed in this survey since collection did not occur until<br />
almost mid-season, in late July. As temperatures reached<br />
their highest in August, so did the GWSS population. This<br />
is expected since GWSS thrive best in hot temperatures.<br />
Further, the first generation would be expected to be<br />
smaller than the second generation which appeared in our<br />
August and early September collections.<br />
Figure 2. Real-time PCR results showing the presence<br />
or absence of X. fastidiosa in GWSS samples A) Positive<br />
template B) GWSS duplicated samples positive for the X.<br />
fastidiosa DNA C) GWSS samples negative for the bacterium<br />
D) Threshold fluorescence to determine whether samples<br />
are positive (Toscano, et al., 2006).<br />
Figure 3. Weekly insect collections from July 23rd to October<br />
29th.<br />
The rate of infection among collected GWSSs<br />
corresponds to the visitation pattern seen in the<br />
population survey with infection rates increasing and<br />
decreasing with population generations (Figure 4).<br />
Just as there are two visible population peaks in the<br />
GWSS visitation survey, there are two clear peaks in<br />
3 4 U C R U n d e r g r a d u a t e R e s e a r c h J o u r n a l