Nipissing District Housing Needs, Supply & Affordability ... - dnssab
Nipissing District Housing Needs, Supply & Affordability ... - dnssab
Nipissing District Housing Needs, Supply & Affordability ... - dnssab

Create successful ePaper yourself
Turn your PDF publications into a flip-book with our unique Google optimized e-Paper software.
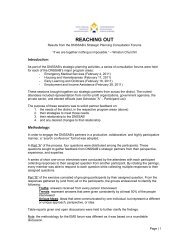
Figure 6: Social Assistance, General <strong>Affordability</strong> Gaps, 2007<br />
Rent ($ /month)<br />
$500<br />
$400<br />
$300<br />
$200<br />
$100<br />
$0<br />
Examples of <strong>Affordability</strong> Gaps for Social Assistance<br />
Recipients: North Bay, 2007<br />
$900<br />
Ave. Rent,<br />
$800<br />
2-bdrm: $740<br />
$700 Ave. Rent,<br />
1-bdrm: $594<br />
$600<br />
$281<br />
$294<br />
ODSP<br />
$300<br />
ODSP<br />
$459<br />
Single Single<br />
Parent &<br />
Child<br />
Average Rent,<br />
3-bdrm: $851<br />
$266<br />
ODSP<br />
$585<br />
Couple<br />
with Two<br />
Children<br />
OW & ODSP: Maximum Rent @ 30% of Income<br />
Average Rent,<br />
3-bdrm: $851<br />
Average Rent,<br />
2-bdrm: $740<br />
Average Rent,<br />
1-bdrm: $594<br />
$431<br />
$426<br />
OW<br />
$168<br />
OW<br />
$309<br />
Single Single<br />
Parent &<br />
Child<br />
<strong>Affordability</strong> Gap<br />
$460<br />
OW<br />
$391<br />
Couple<br />
with Two<br />
Children<br />
Source, Rents: Canada Mortgage and <strong>Housing</strong> Corporation (CMHC) Rental Market Report<br />
(Ontario Highlights), Oct. 2007. Social assistance incomes: MCSS Rate Chart, OW<br />
(Dec. 2007), ODSP (Nov. 2007). Note: income includes the Basic <strong>Needs</strong> & Shelter<br />
Benefit only – no additional income or benefits.<br />
• Significant housing<br />
affordability gaps<br />
exist for people on<br />
social assistance<br />
(OW & ODSP).<br />
• For example, a<br />
single ODSP<br />
recipient (far left bar<br />
chart) has a starting<br />
income of $999 /mo.<br />
This leaves $300<br />
/mo. to spend on<br />
affordable housing<br />
(the yellow part of<br />
the bar chart).<br />
Average market rent<br />
however is $594<br />
which leaves a<br />
shortfall (gap) of<br />
$294 (the red part of<br />
the bar chart).<br />
• There are also housing supply issues: 80% of the caseload is single or are couples without children –<br />
this high demand for affordable, 1-bdrm. units exceeds the current supply:<br />
Figure 7: Central Social <strong>Housing</strong> Waiting List, 2002 - 2006<br />
Total Waiting List (# people /mo.)<br />
1600<br />
1400<br />
1200<br />
1000<br />
800<br />
600<br />
400<br />
200<br />
0<br />
Social <strong>Housing</strong>, Total Waiting List (RGI & Market Rent combined):<br />
<strong>Nipissing</strong> <strong>District</strong>, 2006 - 2007<br />
Jan 2006<br />
Feb<br />
Mar<br />
Apr<br />
May<br />
June<br />
July<br />
Aug<br />
Sept<br />
Oct<br />
Nov<br />
Dec<br />
Jan 2007<br />
Feb<br />
Mar<br />
Apr<br />
May<br />
June<br />
July<br />
Aug<br />
Sept<br />
Oct<br />
Nov<br />
Dec<br />
Total Waiting List Applicants Placed Trendline<br />
Data Source: <strong>Nipissing</strong> <strong>District</strong> <strong>Housing</strong> Corporation (NDHC).<br />
120<br />
100<br />
80<br />
60<br />
40<br />
20<br />
0<br />
Applicants Placed (# people /mo.)<br />
• <strong>Nipissing</strong>’s central<br />
housing waiting list<br />
is a key indicator of<br />
the demand for<br />
social housing.<br />
• Currently there are<br />
approximately 1,325<br />
people waiting for<br />
social housing<br />
(either RGI or<br />
market-rent).<br />
• The list has<br />
increased 19.5%<br />
over the past 2-<br />
years. This increase<br />
is primarily from<br />
people waiting for<br />
market-rent housing<br />
vs., those waiting for<br />
RGI housing.<br />
• On average, 2.5% of the list is placed into housing each month (30 people) but this is offset by new<br />
applications.<br />
• The average waiting time for a 1-bdrm. social housing unit in North Bay is presently 4 years and for a<br />
2-3 bdrm. unit it’s 2 years.<br />
<strong>Nipissing</strong> <strong>District</strong> <strong>Housing</strong> <strong>Needs</strong>, <strong>Supply</strong> & <strong>Affordability</strong> Study, May 2008. 9