BIOS Performance and Power Tuning Guidelines ... - Dell Community
BIOS Performance and Power Tuning Guidelines ... - Dell Community
BIOS Performance and Power Tuning Guidelines ... - Dell Community

Create successful ePaper yourself
Turn your PDF publications into a flip-book with our unique Google optimized e-Paper software.
Normalized <strong>Power</strong> <strong>and</strong> <strong>Performance</strong><br />
<strong>BIOS</strong> <strong>Performance</strong> <strong>and</strong> <strong>Power</strong> <strong>Tuning</strong> <strong>Guidelines</strong> for <strong>Dell</strong> <strong>Power</strong>Edge 12th Generation Servers<br />
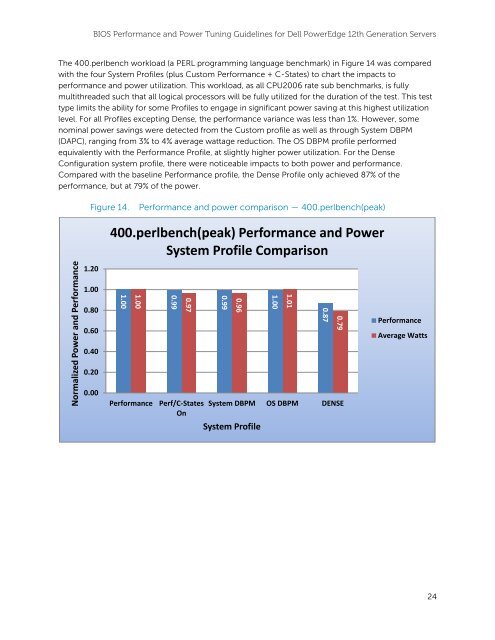
The 400.perlbench workload (a PERL programming language benchmark) in Figure 14 was compared<br />
with the four System Profiles (plus Custom <strong>Performance</strong> + C-States) to chart the impacts to<br />
performance <strong>and</strong> power utilization. This workload, as all CPU2006 rate sub benchmarks, is fully<br />
multithreaded such that all logical processors will be fully utilized for the duration of the test. This test<br />
type limits the ability for some Profiles to engage in significant power saving at this highest utilization<br />
level. For all Profiles excepting Dense, the performance variance was less than 1%. However, some<br />
nominal power savings were detected from the Custom profile as well as through System DBPM<br />
(DAPC), ranging from 3% to 4% average wattage reduction. The OS DBPM profile performed<br />
equivalently with the <strong>Performance</strong> Profile, at slightly higher power utilization. For the Dense<br />
Configuration system profile, there were noticeable impacts to both power <strong>and</strong> performance.<br />
Compared with the baseline <strong>Performance</strong> profile, the Dense Profile only achieved 87% of the<br />
performance, but at 79% of the power.<br />
Figure 14.<br />
<strong>Performance</strong> <strong>and</strong> power comparison — 400.perlbench(peak)<br />
400.perlbench(peak) <strong>Performance</strong> <strong>and</strong> <strong>Power</strong><br />
System Profile Comparison<br />
1.20<br />
1.00<br />
0.80<br />
0.60<br />
1.00<br />
1.00<br />
0.99<br />
0.97<br />
0.99<br />
0.96<br />
1.00<br />
1.01<br />
0.87<br />
0.79<br />
<strong>Performance</strong><br />
Average Watts<br />
0.40<br />
0.20<br />
0.00<br />
<strong>Performance</strong><br />
Perf/C-States<br />
On<br />
System DBPM OS DBPM DENSE<br />
System Profile<br />
24