BIOS Performance and Power Tuning Guidelines ... - Dell Community
BIOS Performance and Power Tuning Guidelines ... - Dell Community
BIOS Performance and Power Tuning Guidelines ... - Dell Community

Create successful ePaper yourself
Turn your PDF publications into a flip-book with our unique Google optimized e-Paper software.
Normalized <strong>Power</strong> <strong>and</strong> Perforamnce<br />
<strong>BIOS</strong> <strong>Performance</strong> <strong>and</strong> <strong>Power</strong> <strong>Tuning</strong> <strong>Guidelines</strong> for <strong>Dell</strong> <strong>Power</strong>Edge 12th Generation Servers<br />
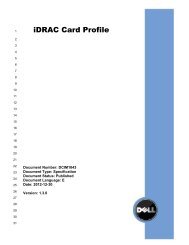
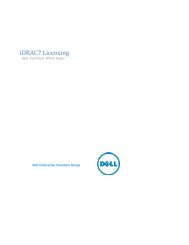
The 471.omnetpp workload (a Discrete Event Simulation benchmark in Figure 15), was compared with<br />
the four System Profiles <strong>and</strong> the Custom profile described in the beginning of this section. Similar to<br />
400.perlbench, all Profiles except Dense achieved performance levels within 1% of each other. The<br />
average power utilization was also within 1% for the first four Profile selections, which sets this<br />
workload apart from 400.perlbench. For the Dense Configuration system profile, there were again<br />
noticeable impacts to both power <strong>and</strong> performance. Compared with the baseline <strong>Performance</strong> profile,<br />
the Dense Profile only achieved 86% of the performance, <strong>and</strong> consumed 84% of the power.<br />
Figure 15.<br />
<strong>Performance</strong> <strong>and</strong> power comparison — 471.omnetpp(base)<br />
471.omnetpp(base) <strong>Performance</strong> <strong>and</strong> <strong>Power</strong><br />
System Profile Comparison<br />
1.20<br />
1.00<br />
0.80<br />
0.60<br />
1.00<br />
1.00<br />
0.99<br />
0.99<br />
0.99<br />
1.00<br />
1.00<br />
1.01<br />
0.86<br />
0.84<br />
<strong>Performance</strong><br />
0.40<br />
Average Watts<br />
0.20<br />
0.00<br />
<strong>Performance</strong><br />
Perf/C-States<br />
On<br />
System DBPM OS DBPM DENSE<br />
System Profile<br />
25