
Create successful ePaper yourself
Turn your PDF publications into a flip-book with our unique Google optimized e-Paper software.
36 ANNUAL<br />
THE GROUP<br />
<strong>Capgemini</strong><br />
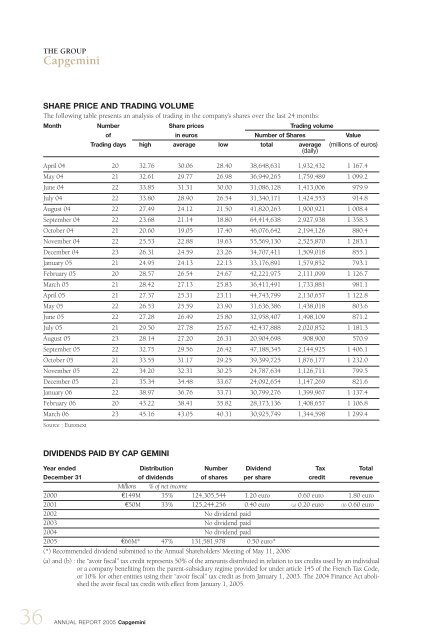
SHARE PRICE AND TRADING VOLUME<br />
The following table presents an analysis of trading in the company’s shares over the last 24 months:<br />
Month Number Share prices Trading volume<br />
of in euros Number of Shares Value<br />
Trading days high average low total average<br />
(daily)<br />
(millions of euros)<br />
April 04 20 32.76 30.06 28.40 38,648,631 1,932,432 1 167.4<br />
May 04 21 32.61 29.77 26.98 36,949,265 1,759,489 1 099.2<br />
June 04 22 33.85 31.31 30.00 31,086,128 1,413,006 979.9<br />
July 04 22 33.80 28.90 26.54 31,340,171 1,424,553 914.8<br />
August 04 22 27.49 24.12 21.50 41,820,263 1,900,921 1 008.4<br />
September 04 22 23.68 21.14 18.80 64,414,638 2,927,938 1 358.3<br />
October 04 21 20.60 19.05 17.40 46,076,642 2,194,126 880.4<br />
November 04 22 25.53 22.88 19.63 55,569,130 2,525,870 1 283.1<br />
December 04 23 26.31 24.59 23.26 34,707,411 1,509,018 855.1<br />
January 05 21 24.95 24.13 22.13 33,176,891 1,579,852 793.1<br />
February 05 20 28.57 26.54 24.67 42,221,975 2,111,099 1 126.7<br />
March 05 21 28.42 27.13 25.83 36,411,491 1,733,881 981.1<br />
April 05 21 27.37 25.31 23.11 44,743,799 2,130,657 1 122.8<br />
May 05 22 26.53 25.59 23.90 31,636,386 1,438,018 803.6<br />
June 05 22 27.28 26.49 25.80 32,958,407 1,498,109 871.2<br />
July 05 21 29.50 27.78 25.67 42,437,888 2,020,852 1 181.3<br />
August 05 23 28.14 27.20 26.31 20,904,698 908,900 570.9<br />
September 05 22 32.75 29.56 26.42 47,188,345 2,144,925 1 406.1<br />
October 05 21 33.55 31.17 29.25 39,399,725 1,876,177 1 232.0<br />
November 05 22 34.20 32.31 30.25 24,787,634 1,126,711 799.5<br />
December 05 21 35.34 34.48 33.67 24,092,654 1,147,269 821.6<br />
January 06 22 38.97 36.76 33.71 30,799,276 1,399,967 1 137.4<br />
February 06 20 43.22 38.41 35.82 28,173,136 1,408,657 1 106.8<br />
March 06<br />
Source : Euronext<br />
23 45.16 43.05 40.31 30,925,749 1,344,598 1 299.4<br />
DIVIDENDS PAID BY CAP GEMINI<br />
Year ended Distribution Number Dividend Tax Total<br />
December 31 of dividends of shares per share credit revenue<br />
Millions % of net income<br />
2000 €149M 35% 124,305,544 1.20 euro 0.60 euro 1.80 euro<br />
2001 €50M 33% 125,244,256 0.40 euro (a) 0.20 euro (b) 0.60 euro<br />
2002 No dividend paid<br />
2003 No dividend paid<br />
2004 No dividend paid<br />
<strong>2005</strong> €66M* 47% 131,581,978 0.50 euro*<br />
(*) Recommended dividend submitted to the Annual Shareholders’ Meeting of May 11, 2006<br />
(a) and (b) : the “avoir fiscal” tax credit represents 50% of the amounts distributed in relation to tax credits used by an individual<br />
or a company benefiting from the parent-subsidiary regime provided for under article 145 of the French Tax Code,<br />
or 10% for other entities using their “avoir fiscal” tax credit as from January 1, 2003. The 2004 Finance Act abolished<br />
the avoir fiscal tax credit with effect from January 1, <strong>2005</strong>.<br />
REPORT <strong>2005</strong> <strong>Capgemini</strong>