Solar PV water pumping study - FINAL REPORT ... - UNDP, Namibia
Solar PV water pumping study - FINAL REPORT ... - UNDP, Namibia
Solar PV water pumping study - FINAL REPORT ... - UNDP, Namibia

You also want an ePaper? Increase the reach of your titles
YUMPU automatically turns print PDFs into web optimized ePapers that Google loves.
Feasibility Assessment for the Replacement of Diesel Pumps with <strong>Solar</strong> Pumps<br />
<strong>FINAL</strong> <strong>REPORT</strong>: September 2006<br />
The numbers in the cells represent the years-to-breakeven between <strong>PV</strong>P and DP. The<br />
yellow fields represent years to breakeven for the Grundfos and Lorentz <strong>PV</strong>Ps. The light<br />
green fields represent parallel Grundfos systems in the same borehole (assuming borehole<br />
suitability) and the blue cells represent the Total Energie TSP 2000+ series of pumps. The<br />
grey fields marked “Diesel” indicate that the diesel option is to be selected. This is however<br />
not due to the diesel pump solution being more viable but due to the lack of a <strong>PV</strong>P solution at<br />
these operating points.<br />
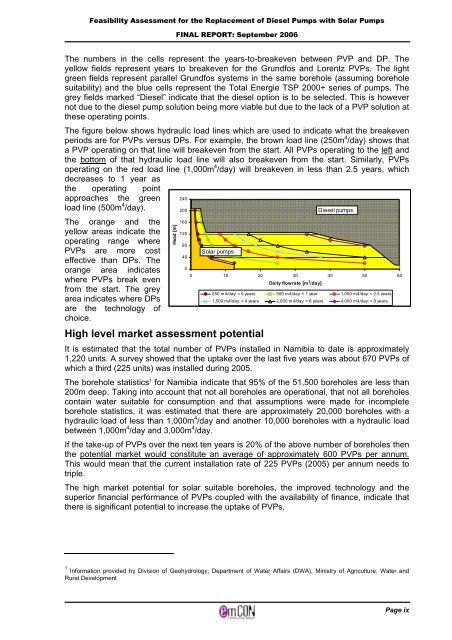
The figure below shows hydraulic load lines which are used to indicate what the breakeven<br />
periods are for <strong>PV</strong>Ps versus DPs. For example, the brown load line (250m 4 /day) shows that<br />
a <strong>PV</strong>P operating on that line will breakeven from the start. All <strong>PV</strong>Ps operating to the left and<br />
the bottom of that hydraulic load line will also breakeven from the start. Similarly, <strong>PV</strong>Ps<br />
operating on the red load line (1,000m 4 /day) will breakeven in less than 2.5 years, which<br />
decreases to 1 year as<br />
the operating point<br />
approaches the green<br />
load line (500m 4 240<br />
/day).<br />
The orange and the<br />
yellow areas indicate the<br />
operating range where<br />
<strong>PV</strong>Ps are more cost<br />
effective than DPs. The<br />
orange area indicates<br />
where <strong>PV</strong>Ps break even<br />
from the start. The grey<br />
area indicates where DPs<br />
are the technology of<br />
choice.<br />
High level market assessment potential<br />
It is estimated that the total number of <strong>PV</strong>Ps installed in <strong>Namibia</strong> to date is approximately<br />
1,220 units. A survey showed that the uptake over the last five years was about 670 <strong>PV</strong>Ps of<br />
which a third (225 units) was installed during 2005.<br />
The borehole statistics 1 for <strong>Namibia</strong> indicate that 95% of the 51,500 boreholes are less than<br />
200m deep. Taking into account that not all boreholes are operational, that not all boreholes<br />
contain <strong>water</strong> suitable for consumption and that assumptions were made for incomplete<br />
borehole statistics, it was estimated that there are approximately 20,000 boreholes with a<br />
hydraulic load of less than 1,000m 4 /day and another 10,000 boreholes with a hydraulic load<br />
between 1,000m 4 /day and 3,000m 4 /day.<br />
If the take-up of <strong>PV</strong>Ps over the next ten years is 20% of the above number of boreholes then<br />
the potential market would constitute an average of approximately 600 <strong>PV</strong>Ps per annum.<br />
This would mean that the current installation rate of 225 <strong>PV</strong>Ps (2005) per annum needs to<br />
triple.<br />
The high market potential for solar suitable boreholes, the improved technology and the<br />
superior financial performance of <strong>PV</strong>Ps coupled with the availability of finance, indicate that<br />
there is significant potential to increase the uptake of <strong>PV</strong>Ps.<br />
1 Information provided by Division of Geohydrology, Department of Water Affairs (DWA), Ministry of Agriculture, Water and<br />
Rural Development<br />
Head [m]<br />
200<br />
160<br />
120<br />
80<br />
40<br />
0<br />
<strong>Solar</strong> pumps<br />
0 10 20 30 40 50 60<br />
Daily flowrate [m 3 /day]<br />
Diesel pumps<br />
250 m4/day: = 0 years 500 m4/day: < 1 year 1,000 m4/day: < 2.5 years<br />
1,500 m4/day: < 4 years 2,000 m4/day: < 6 years 4,000 m4/day: < 8 years<br />
Page ix