Solar PV water pumping study - FINAL REPORT ... - UNDP, Namibia
Solar PV water pumping study - FINAL REPORT ... - UNDP, Namibia
Solar PV water pumping study - FINAL REPORT ... - UNDP, Namibia

Create successful ePaper yourself
Turn your PDF publications into a flip-book with our unique Google optimized e-Paper software.
Feasibility Assessment for the Replacement of Diesel Pumps with <strong>Solar</strong> Pumps<br />
3.1.2 Operating range<br />
<strong>FINAL</strong> <strong>REPORT</strong>: September 2006<br />
The <strong>study</strong> covers <strong>water</strong> supply systems that are able to deliver over a head of up to 200m<br />
with a maximum daily delivery of 60m 3 /day for the <strong>PV</strong>P option and a maximum hourly<br />
delivery of 12m 3 /h for the diesel <strong>pumping</strong> option.<br />
The head used in the calculations refers to the total dynamic head, and therefore includes<br />
the possible drawdown in the borehole.<br />
Comparing pumps is slightly more complex than comparing energy systems since a pump<br />
delivers a flowrate over a head depending on the array size whereas an energy system<br />
delivers energy (kWh/day) for a particular array size. A pump therefore has two parameters,<br />
flowrate and vertical lift. A useful comparison basis for pumps is therefore given by the value<br />
referred to as the daily hydraulic load. This is stated as:<br />
Daily hydraulic load [m 4 /day] = daily flowrate [m 3 /day] x head [m]<br />
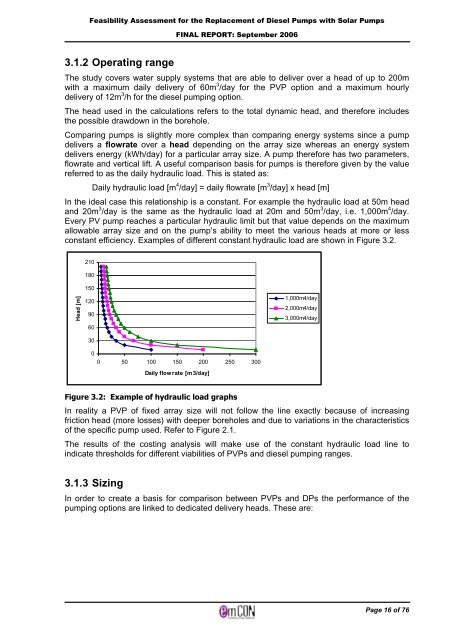
In the ideal case this relationship is a constant. For example the hydraulic load at 50m head<br />
and 20m 3 /day is the same as the hydraulic load at 20m and 50m 3 /day, i.e. 1,000m 4 /day.<br />
Every <strong>PV</strong> pump reaches a particular hydraulic limit but that value depends on the maximum<br />
allowable array size and on the pump’s ability to meet the various heads at more or less<br />
constant efficiency. Examples of different constant hydraulic load are shown in Figure 3.2.<br />
Head [m]<br />
210<br />
180<br />
150<br />
120<br />
90<br />
60<br />
30<br />
0<br />
0 50 100 150 200 250 300<br />
Daily flow rate [m3/day]<br />
Figure 3.2: Example of hydraulic load graphs<br />
1,000m4/day<br />
2,000m4/day<br />
3,000m4/day<br />
In reality a <strong>PV</strong>P of fixed array size will not follow the line exactly because of increasing<br />
friction head (more losses) with deeper boreholes and due to variations in the characteristics<br />
of the specific pump used. Refer to Figure 2.1.<br />
The results of the costing analysis will make use of the constant hydraulic load line to<br />
indicate thresholds for different viabilities of <strong>PV</strong>Ps and diesel <strong>pumping</strong> ranges.<br />
3.1.3 Sizing<br />
In order to create a basis for comparison between <strong>PV</strong>Ps and DPs the performance of the<br />
<strong>pumping</strong> options are linked to dedicated delivery heads. These are:<br />
Page 16 of 76