Solar PV water pumping study - FINAL REPORT ... - UNDP, Namibia
Solar PV water pumping study - FINAL REPORT ... - UNDP, Namibia
Solar PV water pumping study - FINAL REPORT ... - UNDP, Namibia

Create successful ePaper yourself
Turn your PDF publications into a flip-book with our unique Google optimized e-Paper software.
Feasibility Assessment for the Replacement of Diesel Pumps with <strong>Solar</strong> Pumps<br />
<strong>FINAL</strong> <strong>REPORT</strong>: September 2006<br />
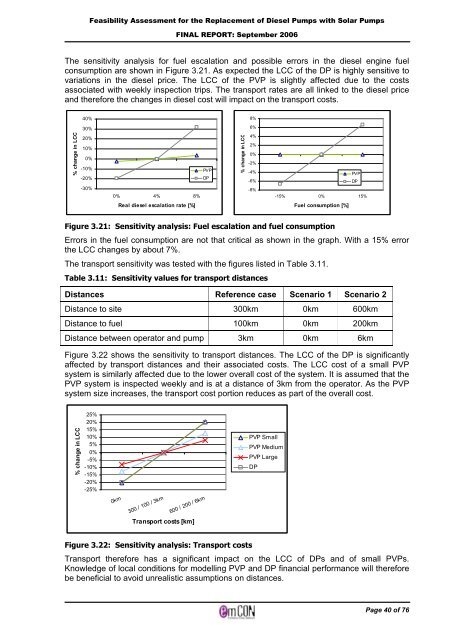
The sensitivity analysis for fuel escalation and possible errors in the diesel engine fuel<br />
consumption are shown in Figure 3.21. As expected the LCC of the DP is highly sensitive to<br />
variations in the diesel price. The LCC of the <strong>PV</strong>P is slightly affected due to the costs<br />
associated with weekly inspection trips. The transport rates are all linked to the diesel price<br />
and therefore the changes in diesel cost will impact on the transport costs.<br />
% change in LCC<br />
40%<br />
30%<br />
20%<br />
10%<br />
0%<br />
-10%<br />
-20%<br />
-30%<br />
0% 4% 8%<br />
Real diesel escalation rate [%]<br />
<strong>PV</strong>P<br />
DP<br />
8%<br />
6%<br />
4%<br />
2%<br />
0%<br />
-2%<br />
-4%<br />
-6%<br />
-8%<br />
-15% 0% 15%<br />
Fuel consumption [%]<br />
Figure 3.21: Sensitivity analysis: Fuel escalation and fuel consumption<br />
Errors in the fuel consumption are not that critical as shown in the graph. With a 15% error<br />
the LCC changes by about 7%.<br />
The transport sensitivity was tested with the figures listed in Table 3.11.<br />
Table 3.11: Sensitivity values for transport distances<br />
Distances Reference case Scenario 1 Scenario 2<br />
Distance to site 300km 0km 600km<br />
Distance to fuel 100km 0km 200km<br />
Distance between operator and pump 3km 0km 6km<br />
Figure 3.22 shows the sensitivity to transport distances. The LCC of the DP is significantly<br />
affected by transport distances and their associated costs. The LCC cost of a small <strong>PV</strong>P<br />
system is similarly affected due to the lower overall cost of the system. It is assumed that the<br />
<strong>PV</strong>P system is inspected weekly and is at a distance of 3km from the operator. As the <strong>PV</strong>P<br />
system size increases, the transport cost portion reduces as part of the overall cost.<br />
% change in LCC<br />
25%<br />
20%<br />
15%<br />
10%<br />
5%<br />
0%<br />
-5%<br />
-10%<br />
-15%<br />
-20%<br />
-25%<br />
0km<br />
300 / 100 / 3km<br />
600 / 200 / 6km<br />
Transport costs [km]<br />
Figure 3.22: Sensitivity analysis: Transport costs<br />
% change in LCC<br />
<strong>PV</strong>P Small<br />
<strong>PV</strong>P Medium<br />
<strong>PV</strong>P Large<br />
Transport therefore has a significant impact on the LCC of DPs and of small <strong>PV</strong>Ps.<br />
Knowledge of local conditions for modelling <strong>PV</strong>P and DP financial performance will therefore<br />
be beneficial to avoid unrealistic assumptions on distances.<br />
DP<br />
<strong>PV</strong>P<br />
DP<br />
Page 40 of 76