Solar PV water pumping study - FINAL REPORT ... - UNDP, Namibia
Solar PV water pumping study - FINAL REPORT ... - UNDP, Namibia
Solar PV water pumping study - FINAL REPORT ... - UNDP, Namibia

You also want an ePaper? Increase the reach of your titles
YUMPU automatically turns print PDFs into web optimized ePapers that Google loves.
Feasibility Assessment for the Replacement of Diesel Pumps with <strong>Solar</strong> Pumps<br />
<strong>FINAL</strong> <strong>REPORT</strong>: September 2006<br />
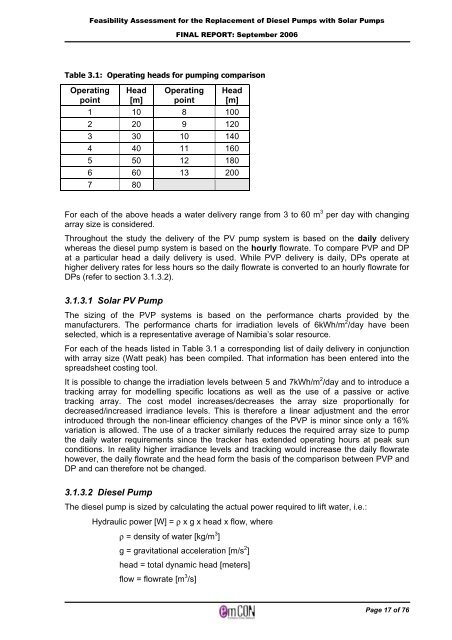
Table 3.1: Operating heads for <strong>pumping</strong> comparison<br />
Operating<br />
point<br />
Head<br />
[m]<br />
Operating<br />
point<br />
Head<br />
[m]<br />
1 10 8 100<br />
2 20 9 120<br />
3 30 10 140<br />
4 40 11 160<br />
5 50 12 180<br />
6 60 13 200<br />
7 80<br />
For each of the above heads a <strong>water</strong> delivery range from 3 to 60 m 3 per day with changing<br />
array size is considered.<br />
Throughout the <strong>study</strong> the delivery of the <strong>PV</strong> pump system is based on the daily delivery<br />
whereas the diesel pump system is based on the hourly flowrate. To compare <strong>PV</strong>P and DP<br />
at a particular head a daily delivery is used. While <strong>PV</strong>P delivery is daily, DPs operate at<br />
higher delivery rates for less hours so the daily flowrate is converted to an hourly flowrate for<br />
DPs (refer to section 3.1.3.2).<br />
3.1.3.1 <strong>Solar</strong> <strong>PV</strong> Pump<br />
The sizing of the <strong>PV</strong>P systems is based on the performance charts provided by the<br />
manufacturers. The performance charts for irradiation levels of 6kWh/m 2 /day have been<br />
selected, which is a representative average of <strong>Namibia</strong>’s solar resource.<br />
For each of the heads listed in Table 3.1 a corresponding list of daily delivery in conjunction<br />
with array size (Watt peak) has been compiled. That information has been entered into the<br />
spreadsheet costing tool.<br />
It is possible to change the irradiation levels between 5 and 7kWh/m 2 /day and to introduce a<br />
tracking array for modelling specific locations as well as the use of a passive or active<br />
tracking array. The cost model increases/decreases the array size proportionally for<br />
decreased/increased irradiance levels. This is therefore a linear adjustment and the error<br />
introduced through the non-linear efficiency changes of the <strong>PV</strong>P is minor since only a 16%<br />
variation is allowed. The use of a tracker similarly reduces the required array size to pump<br />
the daily <strong>water</strong> requirements since the tracker has extended operating hours at peak sun<br />
conditions. In reality higher irradiance levels and tracking would increase the daily flowrate<br />
however, the daily flowrate and the head form the basis of the comparison between <strong>PV</strong>P and<br />
DP and can therefore not be changed.<br />
3.1.3.2 Diesel Pump<br />
The diesel pump is sized by calculating the actual power required to lift <strong>water</strong>, i.e.:<br />
Hydraulic power [W] = ρ x g x head x flow, where<br />
ρ = density of <strong>water</strong> [kg/m 3 ]<br />
g = gravitational acceleration [m/s 2 ]<br />
head = total dynamic head [meters]<br />
flow = flowrate [m 3 /s]<br />
Page 17 of 76