Solar PV water pumping study - FINAL REPORT ... - UNDP, Namibia
Solar PV water pumping study - FINAL REPORT ... - UNDP, Namibia
Solar PV water pumping study - FINAL REPORT ... - UNDP, Namibia

You also want an ePaper? Increase the reach of your titles
YUMPU automatically turns print PDFs into web optimized ePapers that Google loves.
Feasibility Assessment for the Replacement of Diesel Pumps with <strong>Solar</strong> Pumps<br />
<strong>FINAL</strong> <strong>REPORT</strong>: September 2006<br />
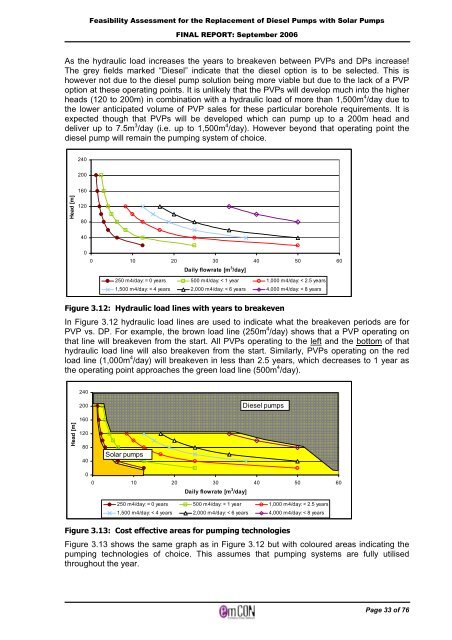
As the hydraulic load increases the years to breakeven between <strong>PV</strong>Ps and DPs increase!<br />
The grey fields marked “Diesel” indicate that the diesel option is to be selected. This is<br />
however not due to the diesel pump solution being more viable but due to the lack of a <strong>PV</strong>P<br />
option at these operating points. It is unlikely that the <strong>PV</strong>Ps will develop much into the higher<br />
heads (120 to 200m) in combination with a hydraulic load of more than 1,500m 4 /day due to<br />
the lower anticipated volume of <strong>PV</strong>P sales for these particular borehole requirements. It is<br />
expected though that <strong>PV</strong>Ps will be developed which can pump up to a 200m head and<br />
deliver up to 7.5m 3 /day (i.e. up to 1,500m 4 /day). However beyond that operating point the<br />
diesel pump will remain the <strong>pumping</strong> system of choice.<br />
Head [m]<br />
240<br />
200<br />
160<br />
120<br />
80<br />
40<br />
0<br />
0 10 20 30 40 50 60<br />
Daily flowrate [m 3 /day]<br />
250 m4/day: = 0 years 500 m4/day: < 1 year 1,000 m4/day: < 2.5 years<br />
1,500 m4/day: < 4 years 2,000 m4/day: < 6 years 4,000 m4/day: < 8 years<br />
Figure 3.12: Hydraulic load lines with years to breakeven<br />
In Figure 3.12 hydraulic load lines are used to indicate what the breakeven periods are for<br />
<strong>PV</strong>P vs. DP. For example, the brown load line (250m 4 /day) shows that a <strong>PV</strong>P operating on<br />
that line will breakeven from the start. All <strong>PV</strong>Ps operating to the left and the bottom of that<br />
hydraulic load line will also breakeven from the start. Similarly, <strong>PV</strong>Ps operating on the red<br />
load line (1,000m 4 /day) will breakeven in less than 2.5 years, which decreases to 1 year as<br />
the operating point approaches the green load line (500m 4 /day).<br />
Head [m]<br />
240<br />
200<br />
160<br />
120<br />
80<br />
40<br />
0<br />
<strong>Solar</strong> pumps<br />
0 10 20 30 40 50 60<br />
Daily flowrate [m 3 /day]<br />
Diesel pumps<br />
250 m4/day: = 0 years 500 m4/day: < 1 year 1,000 m4/day: < 2.5 years<br />
1,500 m4/day: < 4 years 2,000 m4/day: < 6 years 4,000 m4/day: < 8 years<br />
Figure 3.13: Cost effective areas for <strong>pumping</strong> technologies<br />
Figure 3.13 shows the same graph as in Figure 3.12 but with coloured areas indicating the<br />
<strong>pumping</strong> technologies of choice. This assumes that <strong>pumping</strong> systems are fully utilised<br />
throughout the year.<br />
Page 33 of 76