Solar PV water pumping study - FINAL REPORT ... - UNDP, Namibia
Solar PV water pumping study - FINAL REPORT ... - UNDP, Namibia
Solar PV water pumping study - FINAL REPORT ... - UNDP, Namibia

You also want an ePaper? Increase the reach of your titles
YUMPU automatically turns print PDFs into web optimized ePapers that Google loves.
Impact on Years-tobreakeven<br />
Feasibility Assessment for the Replacement of Diesel Pumps with <strong>Solar</strong> Pumps<br />
40%<br />
30%<br />
20%<br />
10%<br />
0%<br />
<strong>FINAL</strong> <strong>REPORT</strong>: September 2006<br />
-10%<br />
5.00 7.00 9.00 11.00 13.00 15.00<br />
Diesel price [N$/litre]<br />
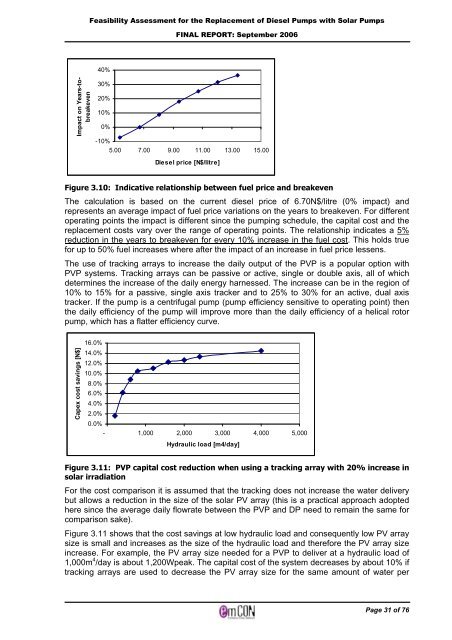
Figure 3.10: Indicative relationship between fuel price and breakeven<br />
The calculation is based on the current diesel price of 6.70N$/litre (0% impact) and<br />
represents an average impact of fuel price variations on the years to breakeven. For different<br />
operating points the impact is different since the <strong>pumping</strong> schedule, the capital cost and the<br />
replacement costs vary over the range of operating points. The relationship indicates a 5%<br />
reduction in the years to breakeven for every 10% increase in the fuel cost. This holds true<br />
for up to 50% fuel increases where after the impact of an increase in fuel price lessens.<br />
The use of tracking arrays to increase the daily output of the <strong>PV</strong>P is a popular option with<br />
<strong>PV</strong>P systems. Tracking arrays can be passive or active, single or double axis, all of which<br />
determines the increase of the daily energy harnessed. The increase can be in the region of<br />
10% to 15% for a passive, single axis tracker and to 25% to 30% for an active, dual axis<br />
tracker. If the pump is a centrifugal pump (pump efficiency sensitive to operating point) then<br />
the daily efficiency of the pump will improve more than the daily efficiency of a helical rotor<br />
pump, which has a flatter efficiency curve.<br />
Capex cost savings [N$]<br />
16.0%<br />
14.0%<br />
12.0%<br />
10.0%<br />
8.0%<br />
6.0%<br />
4.0%<br />
2.0%<br />
0.0%<br />
- 1,000 2,000 3,000 4,000 5,000<br />
Hydraulic load [m4/day]<br />
Figure 3.11: <strong>PV</strong>P capital cost reduction when using a tracking array with 20% increase in<br />
solar irradiation<br />
For the cost comparison it is assumed that the tracking does not increase the <strong>water</strong> delivery<br />
but allows a reduction in the size of the solar <strong>PV</strong> array (this is a practical approach adopted<br />
here since the average daily flowrate between the <strong>PV</strong>P and DP need to remain the same for<br />
comparison sake).<br />
Figure 3.11 shows that the cost savings at low hydraulic load and consequently low <strong>PV</strong> array<br />
size is small and increases as the size of the hydraulic load and therefore the <strong>PV</strong> array size<br />
increase. For example, the <strong>PV</strong> array size needed for a <strong>PV</strong>P to deliver at a hydraulic load of<br />
1,000m 4 /day is about 1,200Wpeak. The capital cost of the system decreases by about 10% if<br />
tracking arrays are used to decrease the <strong>PV</strong> array size for the same amount of <strong>water</strong> per<br />
Page 31 of 76