Solar PV water pumping study - FINAL REPORT ... - UNDP, Namibia
Solar PV water pumping study - FINAL REPORT ... - UNDP, Namibia
Solar PV water pumping study - FINAL REPORT ... - UNDP, Namibia

Create successful ePaper yourself
Turn your PDF publications into a flip-book with our unique Google optimized e-Paper software.
Feasibility Assessment for the Replacement of Diesel Pumps with <strong>Solar</strong> Pumps<br />
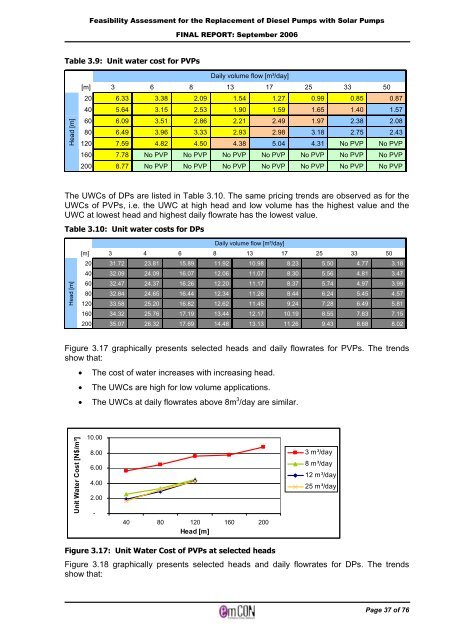
Table 3.9: Unit <strong>water</strong> cost for <strong>PV</strong>Ps<br />
Head [m]<br />
<strong>FINAL</strong> <strong>REPORT</strong>: September 2006<br />
Daily volume flow [m³/day]<br />
[m] 3 6 8 13 17 25 33 50<br />
20 6.33<br />
40 5.64<br />
60 6.09<br />
80 6.49<br />
120 7.59<br />
160 7.78<br />
200 8.77<br />
3.38<br />
3.15<br />
3.51<br />
3.96<br />
4.82<br />
2.09<br />
2.53<br />
2.86<br />
3.33<br />
4.50<br />
1.54<br />
1.90<br />
2.21<br />
2.93<br />
4.38<br />
1.27<br />
1.59<br />
2.49<br />
2.98<br />
5.04<br />
0.99<br />
1.65<br />
1.97<br />
3.18<br />
4.31<br />
0.85<br />
1.40<br />
2.38<br />
2.75<br />
0.87<br />
1.57<br />
2.08<br />
2.43<br />
No <strong>PV</strong>P No <strong>PV</strong>P<br />
No <strong>PV</strong>P No <strong>PV</strong>P No <strong>PV</strong>P No <strong>PV</strong>P No <strong>PV</strong>P No <strong>PV</strong>P No <strong>PV</strong>P<br />
No <strong>PV</strong>P No <strong>PV</strong>P No <strong>PV</strong>P No <strong>PV</strong>P No <strong>PV</strong>P No <strong>PV</strong>P No <strong>PV</strong>P<br />
The UWCs of DPs are listed in Table 3.10. The same pricing trends are observed as for the<br />
UWCs of <strong>PV</strong>Ps, i.e. the UWC at high head and low volume has the highest value and the<br />
UWC at lowest head and highest daily flowrate has the lowest value.<br />
Table 3.10: Unit <strong>water</strong> costs for DPs<br />
Head [m]<br />
Figure 3.17 graphically presents selected heads and daily flowrates for <strong>PV</strong>Ps. The trends<br />
show that:<br />
Unit Water Cost [N$/m³]<br />
• The cost of <strong>water</strong> increases with increasing head.<br />
• The UWCs are high for low volume applications.<br />
• The UWCs at daily flowrates above 8m 3 /day are similar.<br />
10.00<br />
8.00<br />
6.00<br />
4.00<br />
2.00<br />
-<br />
Daily volume flow [m³/day]<br />
[m] 3 4 6 8 13 17 25 33 50<br />
20 31.72<br />
40 32.09<br />
60 32.47<br />
80 32.84<br />
120 33.58<br />
160 34.32<br />
200 35.07<br />
23.81<br />
24.09<br />
24.37<br />
24.65<br />
25.20<br />
25.76<br />
26.32<br />
15.89<br />
16.07<br />
16.26<br />
16.44<br />
16.82<br />
17.19<br />
17.69<br />
11.92<br />
12.06<br />
12.20<br />
12.34<br />
12.62<br />
13.44<br />
14.48<br />
40 80 120 160 200<br />
Head [m]<br />
Figure 3.17: Unit Water Cost of <strong>PV</strong>Ps at selected heads<br />
3 m³/day<br />
8 m³/day<br />
12 m³/day<br />
25 m³/day<br />
Figure 3.18 graphically presents selected heads and daily flowrates for DPs. The trends<br />
show that:<br />
10.98<br />
11.07<br />
11.17<br />
11.26<br />
11.45<br />
12.17<br />
13.13<br />
8.23<br />
8.30<br />
8.37<br />
8.44<br />
9.24<br />
10.19<br />
11.26<br />
5.50<br />
5.56<br />
5.74<br />
6.24<br />
7.28<br />
8.55<br />
9.43<br />
4.77<br />
4.81<br />
4.97<br />
5.45<br />
6.49<br />
7.83<br />
8.68<br />
3.18<br />
3.47<br />
3.99<br />
4.57<br />
5.81<br />
7.15<br />
8.02<br />
Page 37 of 76