Consumption and the environment (SOER2010) - European ...
Consumption and the environment (SOER2010) - European ...
Consumption and the environment (SOER2010) - European ...

You also want an ePaper? Increase the reach of your titles
YUMPU automatically turns print PDFs into web optimized ePapers that Google loves.
Thematic assessment | <strong>Consumption</strong> <strong>and</strong> <strong>the</strong> <strong>environment</strong><br />
2.5 Low-pressure households<br />
— a good example of more<br />
<strong>environment</strong>ally sustainable<br />
consumption?<br />
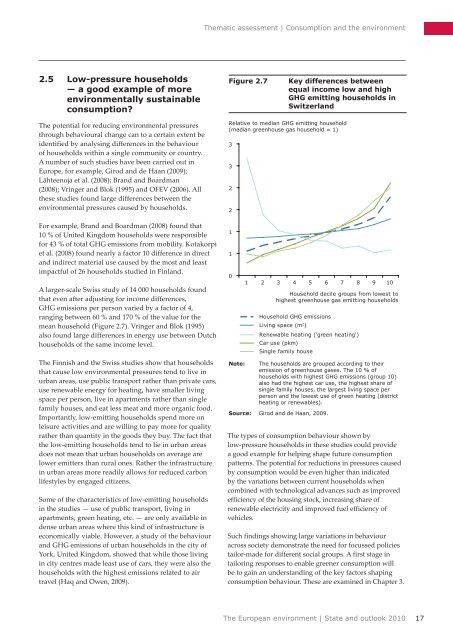
Figure 2.7<br />
Key differences between<br />
equal income low <strong>and</strong> high<br />
GHG emitting households in<br />
Switzerl<strong>and</strong><br />
The potential for reducing <strong>environment</strong>al pressures<br />
through behavioural change can to a certain extent be<br />
identified by analysing differences in <strong>the</strong> behaviour<br />
of households within a single community or country.<br />
A number of such studies have been carried out in<br />
Europe, for example, Girod <strong>and</strong> de Haan (2009);<br />
Lähteenoja et al. (2008); Br<strong>and</strong> <strong>and</strong> Boardman<br />
(2008); Vringer <strong>and</strong> Blok (1995) <strong>and</strong> OFEV (2006). All<br />
<strong>the</strong>se studies found large differences between <strong>the</strong><br />
<strong>environment</strong>al pressures caused by households.<br />
For example, Br<strong>and</strong> <strong>and</strong> Boardman (2008) found that<br />
10 % of United Kingdom households were responsible<br />
for 43 % of total GHG emissions from mobility. Kotakorpi<br />
et al. (2008) found nearly a factor 10 difference in direct<br />
<strong>and</strong> indirect material use caused by <strong>the</strong> most <strong>and</strong> least<br />
impactful of 26 households studied in Finl<strong>and</strong>.<br />
A larger-scale Swiss study of 14 000 households found<br />
that even after adjusting for income differences,<br />
GHG emissions per person varied by a factor of 4,<br />
ranging between 60 % <strong>and</strong> 170 % of <strong>the</strong> value for <strong>the</strong><br />
mean household (Figure 2.7). Vringer <strong>and</strong> Blok (1995)<br />
also found large differences in energy use between Dutch<br />
households of <strong>the</strong> same income level.<br />
The Finnish <strong>and</strong> <strong>the</strong> Swiss studies show that households<br />
that cause low <strong>environment</strong>al pressures tend to live in<br />
urban areas, use public transport ra<strong>the</strong>r than private cars,<br />
use renewable energy for heating, have smaller living<br />
space per person, live in apartments ra<strong>the</strong>r than single<br />
family houses, <strong>and</strong> eat less meat <strong>and</strong> more organic food.<br />
Importantly, low-emitting households spend more on<br />
leisure activities <strong>and</strong> are willing to pay more for quality<br />
ra<strong>the</strong>r than quantity in <strong>the</strong> goods <strong>the</strong>y buy. The fact that<br />
<strong>the</strong> low-emitting households tend to lie in urban areas<br />
does not mean that urban households on average are<br />
lower emitters than rural ones. Ra<strong>the</strong>r <strong>the</strong> infrastructure<br />
in urban areas more readily allows for reduced carbon<br />
lifestyles by engaged citizens.<br />
Some of <strong>the</strong> characteristics of low-emitting households<br />
in <strong>the</strong> studies — use of public transport, living in<br />
apartments, green heating, etc. — are only available in<br />
dense urban areas where this kind of infrastructure is<br />
economically viable. However, a study of <strong>the</strong> behaviour<br />
<strong>and</strong> GHG emissions of urban households in <strong>the</strong> city of<br />
York, United Kingdom, showed that while those living<br />
in city centres made least use of cars, <strong>the</strong>y were also <strong>the</strong><br />
households with <strong>the</strong> highest emissions related to air<br />
travel (Haq <strong>and</strong> Owen, 2009).<br />
Relative to median GHG emitting household<br />
(median greenhouse gas household = 1)<br />
3<br />
3<br />
2<br />
2<br />
1<br />
1<br />
0<br />
Note:<br />
1 2 3 4 5 6 7 8 9 10<br />
Household decile groups from lowest to<br />
highest greenhouse gas emitting households<br />
Household GHG emissions<br />
Living space (m 2 )<br />
Renewable heating ('green heating')<br />
Car use (pkm)<br />
Single family house<br />
The households are grouped according to <strong>the</strong>ir<br />
emission of greenhouse gases. The 10 % of<br />
households with highest GHG emissions (group 10)<br />
also had <strong>the</strong> highest car use, <strong>the</strong> highest share of<br />
single family houses, <strong>the</strong> largest living space per<br />
person <strong>and</strong> <strong>the</strong> lowest use of green heating (district<br />
heating or renewables).<br />
Source: Girod <strong>and</strong> de Haan, 2009.<br />
The types of consumption behaviour shown by<br />
low‐pressure households in <strong>the</strong>se studies could provide<br />
a good example for helping shape future consumption<br />
patterns. The potential for reductions in pressures caused<br />
by consumption would be even higher than indicated<br />
by <strong>the</strong> variations between current households when<br />
combined with technological advances such as improved<br />
efficiency of <strong>the</strong> housing stock, increasing share of<br />
renewable electricity <strong>and</strong> improved fuel efficiency of<br />
vehicles.<br />
Such findings showing large variations in behaviour<br />
across society demonstrate <strong>the</strong> need for focussed policies<br />
tailor-made for different social groups. A first stage in<br />
tailoring responses to enable greener consumption will<br />
be to gain an underst<strong>and</strong>ing of <strong>the</strong> key factors shaping<br />
consumption behaviour. These are examined in Chapter 3.<br />
The <strong>European</strong> <strong>environment</strong> | State <strong>and</strong> outlook 2010<br />
17