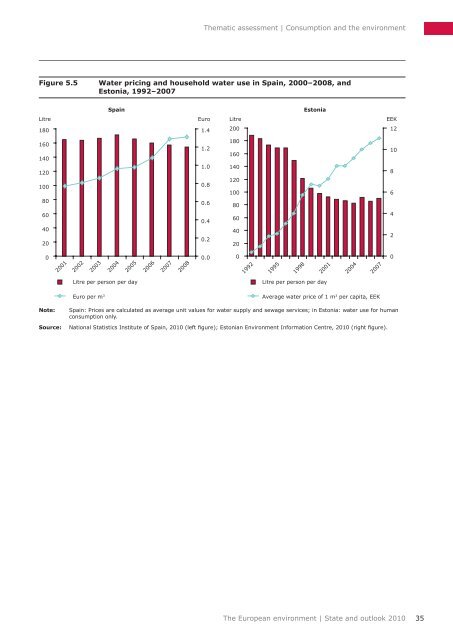
Thematic assessment | <strong>Consumption</strong> <strong>and</strong> <strong>the</strong> <strong>environment</strong> of 160–210 Mt/year CO 2 across <strong>the</strong> EU by 2020, 4–5 % of EU total CO 2 emissions (EC, 2008). However, substantial potential still remains for fur<strong>the</strong>r reductions in energy use in buildings in areas yet to be addressed by policy. For example, if renovation <strong>and</strong> refurbishment of windows, wall insulation <strong>and</strong> roof insulation were always performed to <strong>the</strong> cost-optimal energy efficiency level, GHG emissions could be reduced by a fur<strong>the</strong>r 25–30 % with payback periods of 10–15 years (JRC/IPTS, 2009). In addition, <strong>the</strong> EU's Lead Markets Initiative (EC, 2007), especially <strong>the</strong> initiatives on sustainable construction <strong>and</strong> renewable energies, can help to realise eco-innovation potentials in housing. Actions include, for example, establishing a network of public authorities in charge of construction <strong>and</strong> <strong>the</strong> widening of <strong>European</strong> construction design codes to include sustainability aspects. Making dwellings more energy-efficient, generally requires to make <strong>the</strong>m tighter against cold or hot air from <strong>the</strong> outside, a measure that might be in conflict with providing fresh air for <strong>the</strong> dwellers <strong>and</strong> prevent in-door air pollution or mould. However, good planning <strong>and</strong> implementation of such measures combined with information for dwellers about correct airing of highly energy-efficient buildings can prevent health problems. Driven by front-running stakeholders from business <strong>and</strong> civil society, <strong>the</strong> technology <strong>and</strong> designs for zero‐energy <strong>and</strong> very low energy housing already exist, including super-insulated building envelopes, passive solar heating, cooling <strong>and</strong> lighting, ventilation <strong>and</strong> shower drain heat exchangers, solar water heaters <strong>and</strong> photovoltaic panels on roofs. Several hundred houses have already been built across Europe that meet <strong>the</strong> passive house st<strong>and</strong>ard for heating dem<strong>and</strong> that is factor 4–5 below normal new built houses (Harvey, 2009). O<strong>the</strong>r examples of implementation of <strong>the</strong>se technologies include <strong>the</strong> solar settlement in Freiburg (Heinze <strong>and</strong> Voss, 2009) <strong>and</strong> <strong>the</strong> BedZed development in London (Bioregional, 2009). More ambitious policy targets, economic incentives, green public procurement <strong>and</strong> regulation in Europe could ensure a more rapid development <strong>and</strong> uptake of this kind of housing. The United Kingdom, for example, has a target for all new housing to be zero carbon by 2016 (ETC/SCP, 2010b) backed by an exemption from stamp duty l<strong>and</strong> tax (HM Treasury, 2007). Household water consumption can be effectively influenced by water pricing <strong>and</strong> metering, <strong>and</strong> <strong>the</strong> introduction of metering in households is reaching a high level of implementation in EU Member States (EEA, 2009) as required by <strong>the</strong> Water Framework Directive (EC, 2010c). Water metering <strong>and</strong> charging by volume has been shown to influence household behaviour (OECD, 2010). In eastern Europe, water dem<strong>and</strong> has declined by 40 % since <strong>the</strong> early 1990s as a result of higher water prices, <strong>and</strong> consumption has also decreased in western Europe, albeit at a slower pace (EEA, 2010f; EEA, 2009). Figure 5.5 illustrates that household water consumption has decreased along with increasing water prices in Spain <strong>and</strong> Estonia. In Spain, reduction of water use has been supported by regulatory developments including regulation on watering gardens <strong>and</strong> filling of private swimming pools. So overall <strong>the</strong>re is substantial potential to improve <strong>the</strong> picture for housing through uptake of existing policies <strong>and</strong> coupling <strong>the</strong>m with good urban design <strong>and</strong> spatial planning. Doing so can deliver a wide range of benefits through significantly reducing <strong>the</strong> <strong>environment</strong>al impacts of housing on l<strong>and</strong>-take, biodiversity, soil sealing, materials, water <strong>and</strong> energy consumption <strong>and</strong> people's overall well-being. Box 5.1 Smart metering Smart metering of electricity, space heating <strong>and</strong> gas consumption can help citizens to better control <strong>the</strong>ir energy consumption in <strong>the</strong> home. A smart meter shows <strong>the</strong> energy use in <strong>the</strong> dwelling in a more accessible way, helping citizens to identify <strong>the</strong> appliances which use <strong>the</strong> most energy, <strong>and</strong> also shows <strong>the</strong> consequences of energy behaviour, raising people's awareness of <strong>the</strong> structure of <strong>the</strong>ir energy consumption. The EU's energy market liberalisation package requires 80% of households to be equipped with smart meters by 2020. Finl<strong>and</strong>, Italy <strong>and</strong> Sweden have already widely introduced smart meters for electricity (ESMA, 2010). Experience from pilot projects in <strong>the</strong> United States of America shows that smart metering can be made more effective if combined with smart communication: telling households how efficient <strong>the</strong>y are relative to <strong>the</strong>ir neighbours in similar houses, accompanied by tailored recommendations on how to use less energy led to a reduction of 2–5 % of energy use whereas smart meters alone had only a limited effect (von Renssen, 2009). An experiment where 'smileys' were used to communicate above/below average energy consumption showed a much larger effect compared to information-only communication (Schultz et al., 2007). 34 The <strong>European</strong> <strong>environment</strong> | State <strong>and</strong> outlook 2010
Thematic assessment | <strong>Consumption</strong> <strong>and</strong> <strong>the</strong> <strong>environment</strong> Figure 5.5 Water pricing <strong>and</strong> household water use in Spain, 2000–2008, <strong>and</strong> Estonia, 1992–2007 Spain Estonia Litre Euro Litre EEK 180 1.4 200 12 160 140 120 100 80 60 40 20 1.2 1.0 0.8 0.6 0.4 0.2 180 160 140 120 100 80 60 40 20 10 8 6 4 2 0 2001 0.0 0 Litre per person per day Euro per m 3 2002 2003 2004 2005 2006 2007 2008 1992 1995 1998 2001 Litre per person per day 2004 2007 Average water price of 1 m 3 per capita, EEK 0 Note: Source: Spain: Prices are calculated as average unit values for water supply <strong>and</strong> sewage services; in Estonia: water use for human consumption only. National Statistics Institute of Spain, 2010 (left figure); Estonian Environment Information Centre, 2010 (right figure). The <strong>European</strong> <strong>environment</strong> | State <strong>and</strong> outlook 2010 35