Consumption and the environment (SOER2010) - European ...
Consumption and the environment (SOER2010) - European ...
Consumption and the environment (SOER2010) - European ...

Create successful ePaper yourself
Turn your PDF publications into a flip-book with our unique Google optimized e-Paper software.
Thematic assessment | <strong>Consumption</strong> <strong>and</strong> <strong>the</strong> <strong>environment</strong><br />
6 Mobility<br />
6.1 Trends in mobility dem<strong>and</strong> <strong>and</strong><br />
modal split<br />
In this section, mobility includes life‐cycle based<br />
<strong>environment</strong>al pressures from passenger transport. This<br />
means pressures from <strong>the</strong> provision of transport services<br />
for passengers — railways, metro, buses, airlines,<br />
taxis, ferries <strong>and</strong> cruise services; transport equipment<br />
purchased by households — cars, motor cycles, etc.;<br />
extraction <strong>and</strong> delivery of fuel for private transport as<br />
well as direct <strong>environment</strong>al pressures from <strong>the</strong> use of<br />
private vehicles — exhaust emissions. Freight transport<br />
is not included except for <strong>the</strong> transport of transport<br />
equipment <strong>and</strong> fuel.<br />
<strong>European</strong>s are moving fur<strong>the</strong>r <strong>and</strong> faster than ever<br />
before. The number of kilometres travelled by people<br />
in <strong>the</strong> 32 EEA member countries increased by 20 %<br />
between 1995 <strong>and</strong> 2007 or roughly 1.5 % per year<br />
over <strong>the</strong> past decade, slightly below growth in GDP,<br />
<strong>and</strong> although <strong>the</strong>re are variations between countries,<br />
passenger kilometres continue to grow overall across all<br />
EEA member countries (EEA, 2010a).<br />
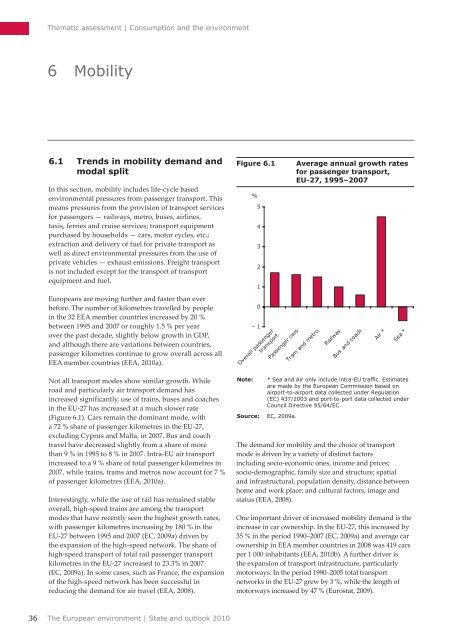
Not all transport modes show similar growth. While<br />
road <strong>and</strong> particularly air transport dem<strong>and</strong> has<br />
increased significantly, use of trains, buses <strong>and</strong> coaches<br />
in <strong>the</strong> EU‐27 has increased at a much slower rate<br />
(Figure 6.1). Cars remain <strong>the</strong> dominant mode, with<br />
a 72 % share of passenger kilometres in <strong>the</strong> EU‐27,<br />
excluding Cyprus <strong>and</strong> Malta, in 2007. Bus <strong>and</strong> coach<br />
travel have decreased slightly from a share of more<br />
than 9 % in 1995 to 8 % in 2007. Intra‐EU air transport<br />
increased to a 9 % share of total passenger kilometres in<br />
2007, while trains, trams <strong>and</strong> metros now account for 7 %<br />
of passenger kilometres (EEA, 2010a).<br />
Interestingly, while <strong>the</strong> use of rail has remained stable<br />
overall, high‐speed trains are among <strong>the</strong> transport<br />
modes that have recently seen <strong>the</strong> highest growth rates,<br />
with passenger kilometres increasing by 180 % in <strong>the</strong><br />
EU‐27 between 1995 <strong>and</strong> 2007 (EC, 2009a) driven by<br />
<strong>the</strong> expansion of <strong>the</strong> high‐speed network. The share of<br />
high‐speed transport of total rail passenger transport<br />
kilometres in <strong>the</strong> EU‐27 increased to 23.3% in 2007<br />
(EC, 2009a). In some cases, such as France, <strong>the</strong> expansion<br />
of <strong>the</strong> high‐speed network has been successful in<br />
reducing <strong>the</strong> dem<strong>and</strong> for air travel (EEA, 2008).<br />
Figure 6.1<br />
Note:<br />
%<br />
5<br />
4<br />
3<br />
2<br />
1<br />
0<br />
– 1<br />
Overall passenger<br />
transport<br />
Passenger cars<br />
Average annual growth rates<br />
for passenger transport,<br />
EU‐27, 1995–2007<br />
* Sea <strong>and</strong> Air only include intra‐EU traffic. Estimates<br />
are made by <strong>the</strong> <strong>European</strong> Commission based on<br />
airport‐to‐airport data collected under Regulation<br />
(EC) 437/2003 <strong>and</strong> port‐to‐port data collected under<br />
Council Directive 95/64/EC.<br />
Source: EC, 2009a.<br />
Tram <strong>and</strong> metro<br />
Railway<br />
Bus <strong>and</strong> coach<br />
Air *<br />
Sea *<br />
The dem<strong>and</strong> for mobility <strong>and</strong> <strong>the</strong> choice of transport<br />
mode is driven by a variety of distinct factors<br />
including socio‐economic ones, income <strong>and</strong> prices;<br />
socio‐demographic, family size <strong>and</strong> structure; spatial<br />
<strong>and</strong> infrastructural, population density, distance between<br />
home <strong>and</strong> work place; <strong>and</strong> cultural factors, image <strong>and</strong><br />
status (EEA, 2008).<br />
One important driver of increased mobility dem<strong>and</strong> is <strong>the</strong><br />
increase in car ownership. In <strong>the</strong> EU‐27, this increased by<br />
35 % in <strong>the</strong> period 1990–2007 (EC, 2009a) <strong>and</strong> average car<br />
ownership in EEA member countries in 2008 was 419 cars<br />
per 1 000 inhabitants (EEA, 2010b). A fur<strong>the</strong>r driver is<br />
<strong>the</strong> expansion of transport infrastructure, particularly<br />
motorways. In <strong>the</strong> period 1990–2005 total transport<br />
networks in <strong>the</strong> EU‐27 grew by 3 %, while <strong>the</strong> length of<br />
motorways increased by 47 % (Eurostat, 2009).<br />
36<br />
The <strong>European</strong> <strong>environment</strong> | State <strong>and</strong> outlook 2010