Consumption and the environment (SOER2010) - European ...
Consumption and the environment (SOER2010) - European ...
Consumption and the environment (SOER2010) - European ...

Create successful ePaper yourself
Turn your PDF publications into a flip-book with our unique Google optimized e-Paper software.
Thematic assessment | <strong>Consumption</strong> <strong>and</strong> <strong>the</strong> <strong>environment</strong><br />
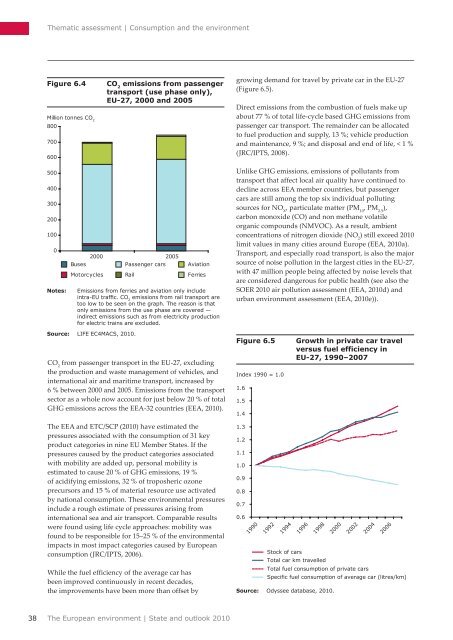
Figure 6.4<br />
Million tonnes CO 2<br />
800<br />
700<br />
600<br />
CO 2<br />
emissions from passenger<br />
transport (use phase only),<br />
EU‐27, 2000 <strong>and</strong> 2005<br />
growing dem<strong>and</strong> for travel by private car in <strong>the</strong> EU‐27<br />
(Figure 6.5).<br />
Direct emissions from <strong>the</strong> combustion of fuels make up<br />
about 77 % of total life‐cycle based GHG emissions from<br />
passenger car transport. The remainder can be allocated<br />
to fuel production <strong>and</strong> supply, 13 %; vehicle production<br />
<strong>and</strong> maintenance, 9 %; <strong>and</strong> disposal <strong>and</strong> end of life, < 1 %<br />
(JRC/IPTS, 2008).<br />
500<br />
400<br />
300<br />
200<br />
100<br />
0<br />
Notes:<br />
Buses<br />
Motorcycles<br />
2000 2005<br />
Passenger cars<br />
Rail<br />
Aviation<br />
Ferries<br />
Emissions from ferries <strong>and</strong> aviation only include<br />
intra‐EU traffic. CO 2<br />
emissions from rail transport are<br />
too low to be seen on <strong>the</strong> graph. The reason is that<br />
only emissions from <strong>the</strong> use phase are covered —<br />
indirect emissions such as from electricity production<br />
for electric trains are excluded.<br />
Unlike GHG emissions, emissions of pollutants from<br />
transport that affect local air quality have continued to<br />
decline across EEA member countries, but passenger<br />
cars are still among <strong>the</strong> top six individual polluting<br />
sources for NO X<br />
, particulate matter (PM 10<br />
, PM 2.5<br />
),<br />
carbon monoxide (CO) <strong>and</strong> non methane volatile<br />
organic compounds (NMVOC). As a result, ambient<br />
concentrations of nitrogen dioxide (NO 2<br />
) still exceed 2010<br />
limit values in many cities around Europe (EEA, 2010a).<br />
Transport, <strong>and</strong> especially road transport, is also <strong>the</strong> major<br />
source of noise pollution in <strong>the</strong> largest cities in <strong>the</strong> EU‐27,<br />
with 47 million people being affected by noise levels that<br />
are considered dangerous for public health (see also <strong>the</strong><br />
SOER 2010 air pollution assessment (EEA, 2010d) <strong>and</strong><br />
urban <strong>environment</strong> assessment (EEA, 2010e)).<br />
Source: LIFE EC4MACS, 2010.<br />
CO 2<br />
from passenger transport in <strong>the</strong> EU‐27, excluding<br />
<strong>the</strong> production <strong>and</strong> waste management of vehicles, <strong>and</strong><br />
international air <strong>and</strong> maritime transport, increased by<br />
6 % between 2000 <strong>and</strong> 2005. Emissions from <strong>the</strong> transport<br />
sector as a whole now account for just below 20 % of total<br />
GHG emissions across <strong>the</strong> EEA‐32 countries (EEA, 2010).<br />
Figure 6.5<br />
Index 1990 = 1.0<br />
1.6<br />
1.5<br />
1.4<br />
Growth in private car travel<br />
versus fuel efficiency in<br />
EU‐27, 1990–2007<br />
The EEA <strong>and</strong> ETC/SCP (2010) have estimated <strong>the</strong><br />
pressures associated with <strong>the</strong> consumption of 31 key<br />
product categories in nine EU Member States. If <strong>the</strong><br />
pressures caused by <strong>the</strong> product categories associated<br />
with mobility are added up, personal mobility is<br />
estimated to cause 20 % of GHG emissions, 19 %<br />
of acidifying emissions, 32 % of troposheric ozone<br />
precursors <strong>and</strong> 15 % of material resource use activated<br />
by national consumption. These <strong>environment</strong>al pressures<br />
include a rough estimate of pressures arising from<br />
international sea <strong>and</strong> air transport. Comparable results<br />
were found using life cycle approaches: mobility was<br />
found to be responsible for 15–25 % of <strong>the</strong> <strong>environment</strong>al<br />
impacts in most impact categories caused by <strong>European</strong><br />
consumption (JRC/IPTS, 2006).<br />
While <strong>the</strong> fuel efficiency of <strong>the</strong> average car has<br />
been improved continuously in recent decades,<br />
<strong>the</strong> improvements have been more than offset by<br />
1.3<br />
1.2<br />
1.1<br />
1.0<br />
0.9<br />
0.8<br />
0.7<br />
0.6<br />
1990<br />
1992<br />
1994<br />
1996<br />
1998<br />
2000<br />
2002<br />
2004<br />
2006<br />
Stock of cars<br />
Total car km travelled<br />
Total fuel consumption of private cars<br />
Specific fuel consumption of average car (litres/km)<br />
Source: Odyssee database, 2010.<br />
38<br />
The <strong>European</strong> <strong>environment</strong> | State <strong>and</strong> outlook 2010