Consumption and the environment (SOER2010) - European ...
Consumption and the environment (SOER2010) - European ...
Consumption and the environment (SOER2010) - European ...

You also want an ePaper? Increase the reach of your titles
YUMPU automatically turns print PDFs into web optimized ePapers that Google loves.
Thematic assessment | <strong>Consumption</strong> <strong>and</strong> <strong>the</strong> <strong>environment</strong><br />
6.3 Mobility outlooks <strong>and</strong> scenarios<br />
Current GHG emissions caused by transport are already<br />
close to what we can emit from all our consumption<br />
activities by 2050 if Europe is to meet <strong>the</strong> strategic objective<br />
adopted by <strong>the</strong> <strong>European</strong> Council of limiting <strong>the</strong> global<br />
average temperature increase to not more than 2 °C above<br />
pre‐industrial levels (Council, 2007 <strong>and</strong> ETC/SCP, 2009).<br />
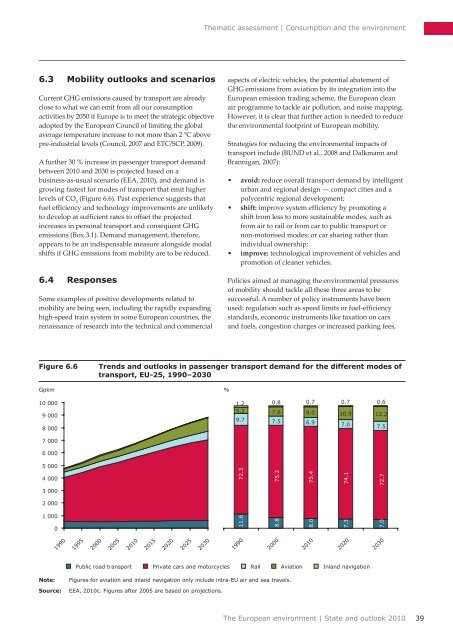
A fur<strong>the</strong>r 30 % increase in passenger transport dem<strong>and</strong><br />
between 2010 <strong>and</strong> 2030 is projected based on a<br />
business‐as‐usual scenario (EEA, 2010), <strong>and</strong> dem<strong>and</strong> is<br />
growing fastest for modes of transport that emit higher<br />
levels of CO 2<br />
(Figure 6.6). Past experience suggests that<br />
fuel efficiency <strong>and</strong> technology improvements are unlikely<br />
to develop at sufficient rates to offset <strong>the</strong> projected<br />
increases in personal transport <strong>and</strong> consequent GHG<br />
emissions (Box 3.1). Dem<strong>and</strong> management, <strong>the</strong>refore,<br />
appears to be an indispensable measure alongside modal<br />
shifts if GHG emissions from mobility are to be reduced.<br />
6.4 Responses<br />
Some examples of positive developments related to<br />
mobility are being seen, including <strong>the</strong> rapidly exp<strong>and</strong>ing<br />
high‐speed train system in some <strong>European</strong> countries, <strong>the</strong><br />
renaissance of research into <strong>the</strong> technical <strong>and</strong> commercial<br />
aspects of electric vehicles, <strong>the</strong> potential abatement of<br />
GHG emissions from aviation by its integration into <strong>the</strong><br />
<strong>European</strong> emission trading scheme, <strong>the</strong> <strong>European</strong> clean<br />
air programme to tackle air pollution, <strong>and</strong> noise mapping.<br />
However, it is clear that fur<strong>the</strong>r action is needed to reduce<br />
<strong>the</strong> <strong>environment</strong>al footprint of <strong>European</strong> mobility.<br />
Strategies for reducing <strong>the</strong> <strong>environment</strong>al impacts of<br />
transport include (BUND et al., 2008 <strong>and</strong> Dalkmann <strong>and</strong><br />
Brannigan, 2007):<br />
• avoid: reduce overall transport dem<strong>and</strong> by intelligent<br />
urban <strong>and</strong> regional design — compact cities <strong>and</strong> a<br />
polycentric regional development;<br />
• shift: improve system efficiency by promoting a<br />
shift from less to more sustainable modes, such as<br />
from air to rail or from car to public transport or<br />
non‐motorised modes; or car sharing ra<strong>the</strong>r than<br />
individual ownership;<br />
• improve: technological improvement of vehicles <strong>and</strong><br />
promotion of cleaner vehicles.<br />
Policies aimed at managing <strong>the</strong> <strong>environment</strong>al pressures<br />
of mobility should tackle all <strong>the</strong>se three areas to be<br />
successful. A number of policy instruments have been<br />
used: regulation such as speed limits or fuel‐efficiency<br />
st<strong>and</strong>ards, economic instruments like taxation on cars<br />
<strong>and</strong> fuels, congestion charges or increased parking fees,<br />
Figure 6.6<br />
Gpkm<br />
10 000<br />
9 000<br />
8 000<br />
Trends <strong>and</strong> outlooks in passenger transport dem<strong>and</strong> for <strong>the</strong> different modes of<br />
transport, EU‐25, 1990–2030<br />
%<br />
1.2 0.8 0.7 0.7 0.6<br />
5.2 7.6 9.0 10.9 12.2<br />
9.7 7.5 6.9 7.0 7.5<br />
7 000<br />
6 000<br />
5 000<br />
4 000<br />
72.3<br />
75.2<br />
75.4<br />
74.1<br />
72.7<br />
3 000<br />
2 000<br />
1 000<br />
0<br />
11.6<br />
8.8<br />
8.0<br />
7.3<br />
7.0<br />
1990<br />
1995<br />
2000<br />
2005<br />
2010<br />
2015<br />
2020<br />
2025<br />
2030<br />
1990<br />
2000<br />
2010<br />
2020<br />
2030<br />
Public road transport Private cars <strong>and</strong> motorcycles Rail Aviation Inl<strong>and</strong> navigation<br />
Note:<br />
Source:<br />
Figures for aviation <strong>and</strong> inl<strong>and</strong> navigation only include intra‐EU air <strong>and</strong> sea travels.<br />
EEA, 2010c. Figures after 2005 are based on projections.<br />
The <strong>European</strong> <strong>environment</strong> | State <strong>and</strong> outlook 2010<br />
39