review the material found here - JoCo Serve
review the material found here - JoCo Serve
review the material found here - JoCo Serve

Create successful ePaper yourself
Turn your PDF publications into a flip-book with our unique Google optimized e-Paper software.
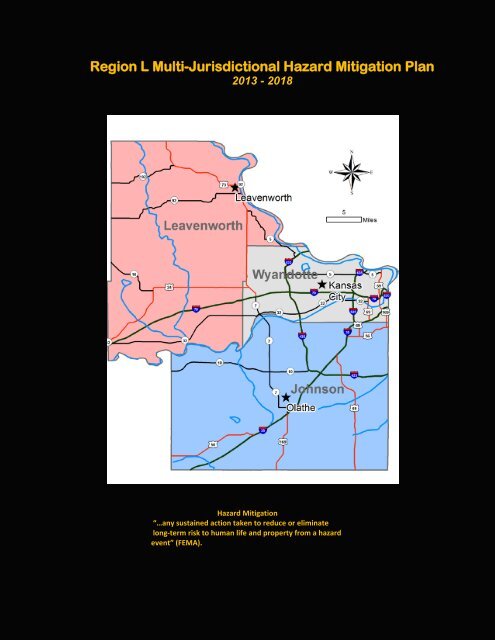
Region L Multi-Jurisdictional Hazard Mitigation Plan<br />
2013 - 2018<br />
Hazard Mitigation<br />
“…any sustained action taken to reduce or eliminate<br />
long-term risk to human life and property from a hazard<br />
event” (FEMA).
Special Thanks and Acknowledgement<br />
The help and support of <strong>the</strong> following individuals<br />
were instrumental in ensuring a smooth transition<br />
of information. Without <strong>the</strong>ir selfless dedication,<br />
sacrifice, and perseverance this plan would have<br />
been close to impossible.<br />
Leavenworth County<br />
To: Kim Buchanan, Assistant Director of Emergency<br />
Management Operations for Leavenworth County.<br />
To: Mike Baughman, Program Coordinator,<br />
Emergency Operation Management Operations for<br />
<strong>the</strong> Unified Government of Wyandotte County.<br />
To: Cary Gerst, Assistant Director Emergency<br />
Management Operations, Planning, for Johnson<br />
County.<br />
Wyandotte County<br />
To: The Planning Committee for <strong>the</strong>ir relentless<br />
questions, input, corrections, critique’s, and<br />
presence.<br />
AMEC – for <strong>the</strong>ir superior facilitation and writing of<br />
<strong>the</strong> State HMP in a regional format. Many thanks<br />
for setting <strong>the</strong> ‘stage’ for <strong>the</strong> Regional Plan.<br />
Johnson County
Executive Summary<br />
The Regional Hazard Mitigation Plan is a multi-jurisdictional plan written and prepared with <strong>the</strong><br />
participation of Johnson, Leavenworth, and Wyandotte County governments and <strong>the</strong> following<br />
communities, school districts, special districts, universities:<br />
• Wyandotte County<br />
• Unified Government of Wyandotte County which includes Kansas City, Kansas<br />
• City of Bonner Springs<br />
• City of Edwardsville<br />
• Kansas State School for <strong>the</strong> Deaf and Blind (Blind)<br />
• Kansas University Medical Center<br />
• Unified Government Health Department<br />
• University of Kansas Hospital<br />
• Fairfax Drainage District<br />
• Kaw Valley Drainage District<br />
• USD 204<br />
• Heart of America Boy Scouts<br />
• Leavenworth County<br />
• County<br />
• City of Basehor<br />
• City of Easton<br />
• City of Lansing<br />
• City of Leavenworth<br />
• City of Linwood<br />
• City of Tonganoxie<br />
• USD 207<br />
• USD 453<br />
• USD 449<br />
• USD 458<br />
• USD 464<br />
• USD 469<br />
• University of Saint Mary<br />
• Leavenworth RWD 7<br />
• Johnson County<br />
• County<br />
• City of Edgerton<br />
• City of DeSoto<br />
• City of Fairway<br />
• City of Gardner<br />
• City of Lake Quivira<br />
• City of Leawood<br />
• City of Lenexa<br />
• City of Merriam<br />
iv
• City of Mission<br />
• City of Mission Hills<br />
• City of Mission Woods<br />
• City of Ola<strong>the</strong><br />
• City of Overland Park<br />
• City of Prairie Village<br />
• City of Roeland Park<br />
• City of Shawnee<br />
• City of Spring Hill<br />
• City of Westwood<br />
• City of Westwood Hills<br />
• Board of Public Utilities<br />
• Kansas City Power & Light<br />
• Kansas Gas Service<br />
• Kansas State School for <strong>the</strong> Deaf & Blind (Deaf)<br />
• Johnson County Community College<br />
• University of Kansas, Edwards Campus<br />
• USD 229<br />
• USD 230<br />
• USD 231<br />
• USD 232<br />
• USD 233<br />
• USD 512<br />
• Consolidated Fire District No. 2<br />
• Fire District No. 1<br />
• Fire District No. 2<br />
• Fire District No. 3<br />
This Regional Hazard Mitigation Plan profiles <strong>the</strong> 22 hazards which <strong>the</strong> State of Kansas has<br />
identified as being <strong>the</strong> greatest threats to lives and property within its borders. These hazards<br />
were evaluated with regard to historical occurrences, probability, magnitude, duration, warning<br />
time, existing mitigation strategies, and <strong>the</strong> potential impacts on each jurisdiction.<br />
The mitigation strategy contained within this update was developed through <strong>the</strong> consideration of<br />
potential threats, hazards, resources, and <strong>the</strong> willpower available to mitigate <strong>the</strong>ir effects. The<br />
planning committee for <strong>the</strong> Region has defined <strong>the</strong> following goals to support this mitigation<br />
strategy:<br />
• Goal 1: Reduce or eliminate risk to <strong>the</strong> people and property of Region L from <strong>the</strong><br />
impacts of <strong>the</strong> identified hazards in this plan.<br />
• Goal 2: Strive to protect all vulnerable populations, structures, and critical facilities in<br />
Region L from <strong>the</strong> impacts of <strong>the</strong> identified hazards.<br />
• Goal 3: Improve public outreach initiatives to include education, awareness and<br />
partnerships with all entities in order to enhance understanding of <strong>the</strong> risk <strong>the</strong> Region<br />
faces due to <strong>the</strong> impacts of <strong>the</strong> identified hazards.<br />
v
• Goal 4: Enhance communication and coordination among all agencies and between<br />
agencies and <strong>the</strong> public.<br />
Mitigation actions have been developed and prioritized to fur<strong>the</strong>r <strong>the</strong> goals of <strong>the</strong> overall<br />
mitigation strategy in each jurisdiction.<br />
Upon a final draft approval by FEMA, <strong>the</strong> Regional Hazard Mitigation Plan will be formally<br />
adopted by each of <strong>the</strong> participating jurisdictions.<br />
This plan will be updated in five years, as required by FEMA. It will be evaluated and<br />
maintained on an annual basis prior to this update.<br />
Prerequisites: Regional Plan Adoption<br />
Requirement<br />
§201.6(c)(5):<br />
For multi-jurisdictional plans, each jurisdiction requesting approval<br />
of <strong>the</strong> plan must document that is has been formally adopted.<br />
Resolutions adopting <strong>the</strong> plan for <strong>the</strong> participating jurisdictions are included in<br />
Appendix A.<br />
vi
Table of Contents<br />
Executive Summary ................................................................................................................... iv<br />
Prerequisites ............................................................................................................................... v<br />
Chapters<br />
1 Introduction and Planning Process 1.1<br />
1.1 Purpose ............................................................................................................................. 1.1<br />
1.2 Background and Scope ..................................................................................................... 1.1<br />
1.3 Plan Organization .............................................................................................................. 1.2<br />
1.4 Planning Process ............................................................................................................... 1.2<br />
1.5 Update Process ................................................................................................................. 1.6<br />
1.6 Public Involvement ............................................................................................................ 1.8<br />
2 Region L Jurisdictional Profiles and Capabilities2.1<br />
2.1 Region L Planning Are Profile 2.1<br />
2.1.1 Topography .................................................................................................................... 2.1<br />
2.1.2 Population ...................................................................................................................... 2.3<br />
2.1.3 Housing Trends .............................................................................................................. 2.3<br />
2.1.4 Economics .................................................................................................................... 2.4<br />
2.1.5 Climate .......................................................................................................................... 2.4<br />
2.1.6 Capabilities ................................................................................................................... 2.4<br />
2.1.7 Exposure of Built Environment/Cultural Resources 2.5<br />
2.2 Johnson County Planning Area Profile 2.8<br />
2.2.1 Geography/Topography ................................................................................................. 2.8<br />
2.2.2 Climate ........................................................................................................................ 2.10<br />
2.2.3 Population/Demographics ........................................................................................... 2.10<br />
2.2.4 Economics .................................................................................................................. 2.11<br />
2.2.5 Capabilities .................................................................................................................. 2.13<br />
2.2.6 Critical Facilities .......................................................................................................... 2.16<br />
2.2.7 O<strong>the</strong>r Assets ............................................................................................................... 2.17<br />
2.2.8 Cities ............................................................................................................................ 2.18<br />
2.2.9 Unified School Districts ............................................................................................... 2.54<br />
2.2.10 Kansas School for <strong>the</strong> Deaf ....................................................................................... 2.67<br />
2.2.11 Community College and University ............................................................................. 2.68<br />
2.2.12 Fire Districts ............................................................................................................... 2.69<br />
2.3 Leavenworth County Planning Area Profile …………………………………..….….2.73<br />
i
2.3.1 Geography/Topography 2.73<br />
2.3.2 Climate .......................................................................................................................... 2.76<br />
2.3.3 Population/Demographics ............................................................................................. 2.76<br />
2.3.4 Economics ................................................................................................................... 2.77<br />
2.3.5 Capabilities ................................................................................................................. 2.78<br />
2.3.6 Critical Facilities ........................................................................................................... 2.82<br />
2.3.7 O<strong>the</strong>r Assets ............................................................................................................... 2.83<br />
2.3.8 Cities ............................................................................................................................ 2.84<br />
2.3.9 Unified School Districts ............................................................................................... 2.93<br />
2.3.10 University .................................................................................................................. 2.102<br />
2.4 Wyandotte County Planning Area Profile ...................................................... 2.104<br />
2.4.1 Geography/Topography .............................................................................................. 2.104<br />
2.4.2 Climate ....................................................................................................................... 2.105<br />
2.4.3 Population/Demographics ........................................................................................... 2.106<br />
2.4.4 Economics ................................................................................................................. 2.106<br />
2.4.5 Capabilities ................................................................................................................. 2.108<br />
2.4.6 Critical Facilities .......................................................................................................... 2.111<br />
2.4.7 O<strong>the</strong>r Assets ............................................................................................................... 2.112<br />
2.4.8 Cities ........................................................................................................................... 2.113<br />
2.4.9 Unified School Districts ............................................................................................... 2.118<br />
2.4.10 Kansas School for <strong>the</strong> Blind .................................................................................... 2.120<br />
2.4.11 Community College ................................................................................................. 2.121<br />
2.4.12 Medical Care Entities .............................................................................................. 2.122<br />
2.4.13 Drainage and Water Districts ................................................................................... 2.124<br />
2.4.14 Private Non-Profits ................................................................................................... 2.126<br />
3 Risk Assessment .................................................................................................... 3.1<br />
3.1 Hazard Identification ....................................................................................................... 3.2<br />
3.1.1 Methodology3.3<br />
3.1.2 Disaster Declaration History ........................................................................................... 3.5<br />
3.2 Hazard Profiles .............................................................................................................. 3.10<br />
3.2.1 Consequence (Impact) Analysis Methodology ............................................................... 3.10<br />
3.2.2 Agricultural Infestation ................................................................................................... 3.13<br />
3.2.3 Civil Disorder ................................................................................................................. 3.23<br />
3.2.4 Dam and Levee Failure ................................................................................................. 3.30<br />
3.2.5 Drought ......................................................................................................................... 3.55<br />
3.2.6 Earthquake .................................................................................................................... 3.70<br />
3.2.7 Expansive Soils ............................................................................................................. 3.80<br />
3.2.8 Extreme Temperatures .................................................................................................. 3.87<br />
3.2.9 Flood ............................................................................................................................. 3.98<br />
3.2.10 Hailstorm ................................................................................................................... 3.165<br />
3.2.11 Hazardous Materials ................................................................................................. 3.174<br />
ii
3.2.12 Land Subsidence ...................................................................................................... 3.188<br />
3.2.13 Landslide ................................................................................................................... 3.198<br />
3.2.14 Lightning ................................................................................................................... 3.205<br />
3.2.15 Major Disease Outbreak ............................................................................................ 3.213<br />
3.2.16 Radiological .............................................................................................................. 3.224<br />
3.2.17 Soil Erosion and Dust ................................................................................................ 3.230<br />
3.2.18 Terrorism/Agro-terrorism ........................................................................................... 3.234<br />
3.2.19 Tornado..................................................................................................................... 3.243<br />
3.2.20 Utility/Infrastructure FailurE ....................................................................................... 3.256<br />
3.2.21 Wildfire ...................................................................................................................... 3.265<br />
3.2.22 Windstorm ................................................................................................................. 3.274<br />
3.2.23 Winter Storm ............................................................................................................. 3.283<br />
4 Mitigation Strategy ........................................................................................................... 4.1<br />
4.1 Goals ................................................................................................................................. 4.2<br />
4.2 Mitigation Actions ............................................................................................................ 4.2<br />
4.3 Implementation of Mitigation Actions ............................................................................. 4.3<br />
Actions ....................................................................................................................... 4.16<br />
5 Plan Maintenance Process ............................................................................................ 5.1<br />
5.1 Plan Monitoring and Evaluation .......................................................................................... 5.1<br />
5.2 Plan Updating .................................................................................................................... 5.1<br />
5.3 Public Participation in Plan Maintenance ............................................................................ 5.2<br />
Appendices<br />
Appendix A: Adoption Resolutions<br />
Appendix B: Planning Process Documentation<br />
Appendix C: Critical Facilities (secure Appendix to be removed for public<br />
comment)<br />
Appendix D:<br />
Appendix E:<br />
iii
1 Introduction/Planning Process<br />
1.1 Purpose<br />
In accordance with <strong>the</strong> DMA 2000, <strong>the</strong> purpose of this plan is to identify and sustain actions<br />
designed to reduce or eliminate long-term risk to people and property from natural and o<strong>the</strong>r<br />
hazards, as well as to ensure that each participating jurisdiction is eligible to obtain federal<br />
funding under <strong>the</strong> Hazard Mitigation Grant (HMGP) and <strong>the</strong> Flood Mitigation Grant (FMA)<br />
Program. Through this plan Region L, and its participating jurisdictions, have evaluated <strong>the</strong><br />
hazards affecting <strong>the</strong> area, updated <strong>the</strong> risks <strong>the</strong>se hazards present to <strong>the</strong> respective<br />
jurisdictions, revised <strong>the</strong>ir mitigation goals, and identified and/or updated feasible mitigation<br />
activities for <strong>the</strong> participating entities.<br />
1.2 Background and Scope<br />
Natural, man-made, and technological disasters affect people every day, taking lives, injuring<br />
people, and destroying property. Every year billions of dollars of tax payer money goes toward<br />
helping communities recover from disasters and <strong>the</strong>ir aftermath. While we cannot control <strong>the</strong><br />
wea<strong>the</strong>r, we can mitigate to reduce or eliminate <strong>the</strong> risk to people and property due to <strong>the</strong>se<br />
damaging wea<strong>the</strong>r events.<br />
Hazard mitigation, as defined by FEMA, is “any sustained action taken to reduce or eliminate<br />
long-term risk to human life and property from a hazard event.” Hazard mitigation planning is<br />
<strong>the</strong> process through which hazards that threaten communities are identified, impacts of those<br />
hazards are determined, mitigation goals and strategies are determined, and actions are<br />
prioritized and implemented.<br />
This plan documents Region Ls planning process and identifies relevant hazards,<br />
vulnerabilities, and strategies <strong>the</strong> participating jurisdictions will use to decrease vulnerability and<br />
increase resiliency and sustainability in <strong>the</strong> Region.<br />
Region L in <strong>the</strong> State of Kansas consists of three counties, Johnson, Leavenworth, and<br />
Wyandotte, and has a population of 777,911 people (U.S. Census 2010), an increase of 14.8%<br />
since <strong>the</strong> 2000 census. Within <strong>the</strong> three counties of Region L, 59 entities were identified as<br />
being potential officially participating jurisdictions in <strong>the</strong> plan, including <strong>the</strong> counties,<br />
communities, and school districts. O<strong>the</strong>rs were encouraged to support <strong>the</strong> planning process,<br />
including townships, fire districts, and businesses. While <strong>the</strong>se entities were not included in <strong>the</strong><br />
count listed above, <strong>the</strong>y were considered supporting stakeholders, but not jurisdictions in <strong>the</strong><br />
plan. See Table 1.1 below for a complete listing of <strong>the</strong> entities in <strong>the</strong> planning area. A<br />
description of how each entity was involved in <strong>the</strong> planning process is provided in Table 1.3.<br />
Information in this Regional Mitigation Plan will be used to help guide and coordinate mitigation<br />
activities and decisions for local land use policy. Mitigation planning will help reduce <strong>the</strong> cost of<br />
disaster response and recovery to communities and <strong>the</strong>ir residents by protecting critical<br />
community facilities, reducing liability exposure, and minimizing overall community impacts.<br />
1.1
1.3 Plan Organization<br />
The Region L Mitigation Plan for <strong>the</strong> counties of Johnson, Leavenworth and Wyandotte is<br />
organized as follows:<br />
• Executive Summary<br />
• Prerequisites<br />
• Chapter 1: Introduction and Planning Process<br />
• Chapter 2: Jurisdictional Profiles and Capabilities<br />
• Chapter 3: Risk Assessment<br />
• Chapter 4: Mitigation Strategy<br />
• Chapter 5: Plan Implementation and Maintenance<br />
• Appendices<br />
1.4. Planning Process<br />
44 CFR Requirement 201.6(c)(1): [The plan shall document] <strong>the</strong> planning process used<br />
to develop <strong>the</strong> plan, including how it was prepared, who was involved in <strong>the</strong> process,<br />
and how <strong>the</strong> public was involved.<br />
In 2012, <strong>the</strong> State of Kansas, through a lot of thought and consideration, presented <strong>the</strong> various<br />
options available to <strong>the</strong> different regions on how <strong>the</strong>y would like to proceed with <strong>the</strong> updating of<br />
<strong>the</strong>ir plans. These options consisted of: 1) do nothing and let <strong>the</strong> plans expire, 2) <strong>the</strong> county’s<br />
could update <strong>the</strong>ir own plans or contract out utilizing <strong>the</strong>ir own funds, or 3) <strong>the</strong> State of Kansas<br />
would provide funding for regional plans for those county’s that wished to participate. The<br />
counties of Region L decided cooperatively that <strong>the</strong> Kansas Division of Emergency<br />
Management would proceed with <strong>the</strong> regional plan for this area with <strong>the</strong> full cooperation, input,<br />
and participation of <strong>the</strong> three counties that make up <strong>the</strong> region. Having made this monumental<br />
decision, <strong>the</strong> planning team was assembled using personnel from each agency that was familiar<br />
with <strong>the</strong> local hazards and capable of generating public interest in <strong>the</strong> project. AMEC was hired<br />
as <strong>the</strong> contracting firm to facilitate <strong>the</strong> kickoff meetings and perform follow-up on informational<br />
guides.<br />
1.4.2. Regional Multi-Jurisdictional Participation<br />
44 CFR Requirement §201.6(a)(3): Multi-jurisdictional plans may be accepted, as<br />
appropriate, as long as each jurisdiction has participated in <strong>the</strong> process and has<br />
officially adopted <strong>the</strong> plan.<br />
Johnson, Leavenworth, and Wyandotte counties invited all incorporated cities, public entities,<br />
school districts, medical entities, special districts, and private non-profits in <strong>the</strong> Region to<br />
participate in <strong>the</strong> Regional Plan. The planning committee, with a lot of thought and discussion,<br />
decided that while actual physical presence at <strong>the</strong> meetings was preferred, it would not be a<br />
requirement. Because some of <strong>the</strong> entities, such as <strong>the</strong> Unified School Districts, had a hard<br />
time being present at <strong>the</strong> meetings, <strong>the</strong> planning committee decided that a physical presence<br />
1.2
would not be a requirement but highly encourage and recommended. In addition, a combination<br />
of face-to-face meetings, phone interviews, follow-ups, and email correspondence were utilized<br />
in order to keep <strong>the</strong> process going. Table 1.1 provides participation information details for <strong>the</strong><br />
jurisdictions that participated in this plan.<br />
Each participating jurisdiction in <strong>the</strong> planning process and plan development was required to<br />
meet plan participation requirements defined at <strong>the</strong> beginning of <strong>the</strong> process, which included <strong>the</strong><br />
following:<br />
• Attend meetings (encouraged, but not required as long as all o<strong>the</strong>r criteria are met)<br />
• Provide information to support <strong>the</strong> plan development by completing and returning <strong>the</strong><br />
Data Collection Guide, pictures, etc.<br />
• Identify Mitigation Actions for <strong>the</strong> plan<br />
• Review and comment on plan drafts<br />
• Inform <strong>the</strong> public, local officials, and o<strong>the</strong>r interested parties about <strong>the</strong> planning process<br />
and provide an opportunity for <strong>the</strong>m to comment on <strong>the</strong> plan<br />
• Formally adopt <strong>the</strong> plan<br />
Private and non-profit organizations are not required to be official participants of <strong>the</strong> plan. They<br />
do not have to formally adopt <strong>the</strong> plan; however, for future mitigation grant applications to be<br />
considered, <strong>the</strong>y must be consistent with <strong>the</strong> mitigation strategy. As such, private non-profit<br />
organizations in <strong>the</strong> planning area were invited to participate in this planning effort and were<br />
encouraged to provide data to support <strong>the</strong> risk assessment as well as mitigation actions for<br />
incorporation in <strong>the</strong> mitigation strategy.<br />
The Regional Hazard Mitigation Plan is a multi-jurisdictional plan that geographically covers<br />
everything with <strong>the</strong> boundaries of <strong>the</strong> participating jurisdictions, <strong>here</strong>after referred to as <strong>the</strong><br />
planning area.<br />
The following Table 1.1 indicates <strong>the</strong> jurisdictions that participated in <strong>the</strong> planning process:<br />
Note that <strong>the</strong> Fire Districts and County Health Departments are included in <strong>the</strong> County.<br />
Table 1.1. Plan Participants<br />
Johnson County<br />
• *County<br />
• *Board of Public Utilities *City of Shawnee<br />
• *Kansas City Power and Light *City of Spring Hill<br />
• *Kansas Gas Service *City of Merriam<br />
• *City of Overland Park<br />
• *City of Shawnee<br />
• *City of DeSoto *City of Lenexa<br />
• *City of Edgerton *City of Ola<strong>the</strong><br />
• *City of Fairway *City of Prairie Village<br />
• *City of Gardner *City of Westwood<br />
• *City of Lake Quivira *City of Westwood Hills<br />
• *City of Leawood *City of Roeland Park<br />
• *City of Mission<br />
• *City of Mission Hills *USD229<br />
• *City of Mission Woods *USD230<br />
• *USD231 *USD232<br />
1.3
Johnson County (cont…)<br />
• *USD233 *USD512<br />
• *KSSDB (Deaf) *Johnson County Community College<br />
• *University of Kansas Edwards Campus *Consolidated Fire District No. 2<br />
• *Fire District No. 1 *Fire District No. 2<br />
• *Fire District No. 3<br />
Leavenworth County<br />
• *County<br />
• *Leavenworth Water *USD207<br />
• *City of Lansing *USD453<br />
• *City of Tonganoxie *USD449<br />
• *City of Linwood *USD458<br />
• *City of Easton *USD464<br />
• *City of Basehor *USD469<br />
• *City of Leavenworth *University of Saint Mary<br />
• *Leavenworth County Health Department<br />
Wyandotte County<br />
• *Unified Government of Wyandotte County and Kansas City, Kansas<br />
• *University of Kansas Hospital<br />
• *Kansas University Medical Center<br />
• *City of Bonner Springs<br />
• *City of Edwardsville<br />
• *Kansas City Community College<br />
• *Fairfax Drainage District<br />
• *KSSDB (Blind)<br />
• *Kaw Valley Drainage District<br />
• *Unified Government Health Department<br />
• *USD 204 Bonner-Edwardsville<br />
In addition to <strong>the</strong> local governments, one private non-profit entity participated in this planning<br />
effort:<br />
• *Heart of America Council, Boy Scouts of America<br />
Jurisdictions that were reached out to, but did not participate in this plan update were <strong>the</strong><br />
Wyandotte Nation and USDs 202, 203, and 500, located in Wyandotte County.<br />
A description of <strong>the</strong> jurisdictions participation is provided in Table 1.2.<br />
Table 1.2. Jurisdictions Participation Description<br />
Organization Meeting 1 Meeting 2 Meeting 3<br />
Email<br />
Correspondence<br />
Data Collection<br />
Guide<br />
Mitigation<br />
Action(s)<br />
Participating Jurisdictions<br />
Johnson County X X X X X X<br />
<strong>JoCo</strong> Health Dept. X X X X X X<br />
Cities<br />
Edgerton X X X<br />
DeSoto X X X<br />
Fairway X X X X X<br />
Gardner X X X<br />
Lake Quivira X X X<br />
Leawood X X X X<br />
Lenexa X X X X<br />
Merriam X X X X X X<br />
1.4
Mission X X X<br />
Mission Hills X X X<br />
Mission Woods X X X<br />
Organization Meeting 1 Meeting 2 Meeting 3 Email<br />
Correspondence<br />
Data Collection<br />
Guide<br />
Mitigation<br />
Action(s)<br />
Ola<strong>the</strong> X X X X X<br />
Overland Park X X X X X X<br />
Prairie Village X X X X X<br />
Roeland Park X X X X<br />
Shawnee X X X X X<br />
Spring Hill X X X<br />
Westwood X X X<br />
Westwood Hills X X X<br />
Kansas City Power<br />
X X X X X<br />
& Light<br />
Kansas Gas<br />
X X X X<br />
Service<br />
Kansas School for<br />
X X X<br />
<strong>the</strong> Deaf<br />
Johnson County<br />
X X X X X<br />
Community College<br />
University of<br />
X X X X X<br />
Kansas Edwards<br />
Campus<br />
USD 229 X X X X X X<br />
USD 230 X X X X X X<br />
USD 231 X X X<br />
USD 232 X X X<br />
USD 233 X X X X<br />
USD 512 X X X<br />
Consolidated FD<br />
X X X<br />
No. 2<br />
Fire District No. 1 X X X X<br />
Fire District No. 2 X X X<br />
Fire District No. 3 X X X<br />
Leavenworth<br />
X X X X X X<br />
County<br />
Cities<br />
Basehor X X X X X X<br />
Easton X X X<br />
Lansing X X X X X X<br />
Leavenworth X X X X X X<br />
Linwood X X X X X<br />
Tonganoxie X X X X<br />
Leavenworth Water X X X X<br />
Leavenworth<br />
X X X X X<br />
County Health<br />
Department<br />
RWD #7 X X X X X<br />
USD 207 X X X X<br />
USD 453 X X X X X<br />
USD 449 X X X<br />
USD 458 X X X<br />
USD 464 X X X X<br />
USD 469 X X X<br />
University of Saint<br />
Mary<br />
X X X<br />
Wyandotte<br />
X X X X X<br />
Co./Unified<br />
Government<br />
Cities<br />
Bonner Springs X X X X<br />
Edwardsville X X X X X<br />
USD<br />
Board of Public<br />
X X X X X<br />
Utilities (BPU)<br />
Fairfax Drainage<br />
X X X X X<br />
District<br />
Kaw Valley<br />
X X X X<br />
Drainage District<br />
Kansas City<br />
Community College<br />
X X X<br />
1.5
Kansas State<br />
X X X X X<br />
School for <strong>the</strong> Deaf<br />
and Blind (Blind)<br />
Kansas University<br />
X X X X X<br />
Medical Center<br />
Unified Government<br />
X X X X X<br />
Health Department<br />
University of<br />
X X X X X<br />
Kansas Hospital<br />
KCK Fire X X X X X<br />
Heart of America<br />
Boy Scouts<br />
X X X X X<br />
The initial kickoff meetings were coordinated with <strong>the</strong> Emergency Manager for <strong>the</strong> respective<br />
counties in Region L. Once an agreed upon time and place was established, <strong>the</strong> emergency<br />
managers sent out notifications to all jurisdictions within <strong>the</strong>ir county. This included all<br />
participating jurisdictions in <strong>the</strong>ir current plan, along with those that did not participate during <strong>the</strong><br />
last plan process. Special Districts, United School Districts, fire departments, surrounding<br />
counties, and private non-profits were invited to attend and participate. A brief summary of each<br />
of <strong>the</strong> three meetings is reflected in Table 1.3. Agenda’s and minutes can be <strong>found</strong> in Appendix<br />
B.<br />
Table 1.3. Meeting Summaries for Region L<br />
Table 1.3<br />
Planning Committee Meetings<br />
Kickoff Meeting<br />
Meeting Agenda Date(s)<br />
Planning Process, Regional Approach,<br />
15 February 2013 – LV County<br />
Planning Requirements, Data Collection<br />
20 February 2013 – Johnson County<br />
Guides, Action Worksheets, Next Steps<br />
23 April 2013 – Wyandotte county<br />
2 nd Planning Meeting Regional Risk Assessment, Mitigation Goals,<br />
Mitigation Actions, Public Comment<br />
Final Meeting<br />
1.5 The Update Process<br />
Question and Comments, final discussion on<br />
Actions, Risk Assessment, and goals.<br />
24 May 2013 – Leavenworth County<br />
30 May 2013 – Johnson County<br />
04 June 2013 – Wyandotte County<br />
15 June 2013 – Johnson County<br />
16 July 2013 – Leavenworth County<br />
17 July 2013 – Wyandotte County<br />
44 CFR Requirement §201.6(c)(1): [The plan shall document] <strong>the</strong> planning process used<br />
to develop <strong>the</strong> plan, including how it was prepared, who was involved in <strong>the</strong> process, and<br />
how <strong>the</strong> public was involved.<br />
A Hazard Mitigation Plan must be updated and adopted by <strong>the</strong> participating jurisdictions every<br />
five years. This plan update took into consideration <strong>the</strong> current plans for each county within <strong>the</strong><br />
Region in order to come to a consensus on a completion date that would benefit all <strong>the</strong><br />
jurisdictions, without letting any plan expire. Because <strong>the</strong> Johnson County plan was <strong>the</strong> first to<br />
expire, <strong>the</strong> completion date for this plan was no later than 1 September 2013. Jeanne Bunting,<br />
State Mitigation Planner, was <strong>the</strong> lead planner for <strong>the</strong> consolidation of <strong>the</strong> three affected<br />
counties into <strong>the</strong> Regional Mitigation Plan. AMEC was tasked with writing <strong>the</strong> State Mitigation<br />
Plan in a regional format in order to facilitate <strong>the</strong> data needed for <strong>the</strong> Regional plan. AMEC was<br />
also tasked with conducting <strong>the</strong> initial kickoff meetings in each of <strong>the</strong> three counties that reside<br />
within Region L, and conducting follow-up for missing information requested at <strong>the</strong> kick-off. In<br />
addition, Ben Grover, State GIS Specialist was in charge of developing <strong>the</strong> updated maps.<br />
The Planning Committee was instrumental in <strong>the</strong> writing of this plan through <strong>the</strong>ir subject matter<br />
expertise as well as <strong>the</strong>ir dedication to ensuring that <strong>the</strong> information was ga<strong>the</strong>red and<br />
submitted in a timely fashion. The distinction between being a participant and planning<br />
1.6
committee member versus being a participant only of this plan, was whe<strong>the</strong>r <strong>the</strong> jurisdiction had<br />
a physical presence at <strong>the</strong> meetings. Only those jurisdictional representatives that were<br />
physically present at <strong>the</strong> meeting(s) were on <strong>the</strong> committee. Following is <strong>the</strong> list of members of<br />
<strong>the</strong> primary planning committee.<br />
Table 1.4. Primary Planning Committee<br />
Planning Committee<br />
Jurisdiction Name Position<br />
Cary Gerst<br />
Emergency Management Assistant<br />
Director, Planning<br />
Johnson County<br />
Trent Pittman<br />
Emergency Management Communications<br />
Liz Ticer<br />
Johnson County Department of Health and<br />
Environment<br />
Jerry Mallory<br />
Emergency Management Building Official<br />
City of Fairway Mike Fleming Fairway Police Department<br />
City of Leawood David Williams City of Leawood Fire Chief<br />
City of Lenexa Eric Ramsey Lenexa Fire Department Division Chief<br />
City of Merriam Doug Crockett Merriam Fire Department Assistant Fire<br />
Chief<br />
City of Ola<strong>the</strong> Tim Richards Ola<strong>the</strong> Fire Department Assistant Fire<br />
Chief<br />
City of Overland Park<br />
Ruth Hamel<br />
City of Overland Park Management<br />
Assistant<br />
Tim Lynch<br />
Administrator for EM and HLS<br />
City of Prairie Village<br />
Danielle Dulin<br />
City of Prairie Village City Manager<br />
Assistant<br />
Byron Roberson<br />
Prairie Village Sergeant<br />
City of Roeland Park Rex Taylor Roeland Park Chief of Police<br />
City of Shawnee Terrance kegin Shawnee Police Department<br />
Kansas Gas Service<br />
Belinda Ciemiega<br />
Scott Coffee<br />
Director, Kansas Gas Service<br />
Kansas City Power & Light Les Boatright KCP&L Emergency Response Manager<br />
Johnson County Community College<br />
Alias Pacer<br />
Emergency Preparedness Manager<br />
Rita Hoffman<br />
JOCO CCC EM Volunteer<br />
University of Kansas Edwards Campus Mary Ryan Associate Dean, Academic and Student<br />
Affairs<br />
USD 229 Blue Valley Sidney Cumberland USD 229 Risk Manager<br />
USD 230 Spring Hill Wayne Burke USD 230 Assistant Superintendent<br />
Fire District No. 1 Trig Morley na<br />
Fire District No. 2 James B. Francis Fire Chief<br />
Kim Buchannan<br />
Emergency Management Deputy<br />
David Dalecky<br />
Leavenworth County Planning and Zoning<br />
Deputy Director<br />
Leavenworth County<br />
Chuck Magaha<br />
Emergency Management Director<br />
Krystal Teichmann<br />
Leavenworth County Health Department<br />
Emergency Preparedness Coordinator<br />
Mickey Schwartzkopf<br />
County Public Works Deputy Director<br />
City of Basehor<br />
Lloyd Martley<br />
Interim City Administrator and Basehor<br />
Chief of Police<br />
Gene Myracle, Jr.<br />
Basehor City Superintendent<br />
John Young<br />
Director of Public Works, Lansing City<br />
City of Lansing<br />
Fred Grenier<br />
Lansing Police Department, Lieutenant<br />
Patrol Division<br />
Mark Nietzke<br />
Leavenworth Fire Department Chief<br />
Mike McDonald<br />
Leavenworth City Public Works Director<br />
City of Leavenworth<br />
John Kanfiman<br />
Leavenworth Water Department Manager<br />
Shawn Kell<br />
Leavenworth City Fire Department<br />
Assistant Chief<br />
City of Linwood Karen Kane Linwood City Clerk<br />
City of Tonganoxie Jennifer Jones-Lacy Tonganoxie Assistant City Administrator<br />
USD 207 Ft Leavenworth Bill Heinen USD 207 Chief Financial Officer<br />
USD 453 Amy Sloan USD 453 Director of Support Services<br />
Unified Government of Wyandotte County<br />
Bob Evans<br />
Mike Baughman<br />
Joel Thornton<br />
Jeff Froman<br />
Gay Hall<br />
Daniel Soptic<br />
Melissa Mitchell<br />
Emergency Management Director<br />
Emergency Management Program Coord.<br />
Emergency Management Program<br />
Coordinator<br />
MMRS Program Coordinator<br />
UG Health Department<br />
County Sheriff<br />
Unified Government Development Support<br />
Specialist<br />
1.7
Anthony Hutchinson<br />
Building Inspector<br />
Rob Richards<br />
Planning<br />
George Sooter<br />
Public Works<br />
Cadi Sanchez<br />
Health Center<br />
City of Bonner Springs John Helin City Manager, Bonner Springs<br />
City of Edwardsville Kevin Schuler Edwardsville fire Department<br />
Fairfax Drainage District Steve Dailey General Manager, Fairfax Drainage District<br />
Kaw Valley Drainage District Jim Jenkins President – Board member<br />
Kansas State School for <strong>the</strong> Deaf and Blind Michelle Protte<br />
Administrator Assistant, Sr.<br />
(Blind)<br />
John Martello<br />
Deputy Superintendent of Facility<br />
Operations and Services<br />
Kansas University Medical Center Kelly Morken Emergency Management Coordinator for<br />
University of Kansas Medical Center<br />
University of Kansas Hospital Steve Hoeger Regional Hospital Emergency<br />
Preparedness Coordinator, University of<br />
Kansas Hospital<br />
Kansas City, Kansas Mike Wilson Senior Assistant Chief, KCKFD<br />
Craig Duke<br />
Fire Department<br />
Patrick Cassidy<br />
Director, Environmental Services<br />
BPU<br />
Phil Musser<br />
na<br />
Chris Stewart<br />
Director of Civil Engineering Board of<br />
Public Utilities<br />
Ron Wilson<br />
Contract Employee<br />
Heart of America Boy Scouts Rob Richardson na<br />
Public Involvement<br />
44 CFR Requirement 201.6(b): An open public involvement process is essential to <strong>the</strong><br />
development of an effective plan. In order to develop a more comprehensive approach to<br />
reducing <strong>the</strong> effects of natural, man-made, and technological disasters, <strong>the</strong> planning<br />
process shall include: (1) An opportunity for <strong>the</strong> public to comment on <strong>the</strong> plan during<br />
<strong>the</strong> drafting stage and prior to plan approval.<br />
Options were discussed at <strong>the</strong> initial kickoff meetings for solicitation of public input and<br />
comments on <strong>the</strong> mitigation plan. During <strong>the</strong> second planning meeting a volunteer sign-up<br />
sheet was sent around so that <strong>the</strong> plan participants could indicate <strong>the</strong>ir willingness to put a<br />
public notice on <strong>the</strong>ir organizations website. Hard copies were put in Public Libraries and<br />
Courthouses to make <strong>the</strong> draft plan readily available to all for comments and input. In addition,<br />
<strong>the</strong> State of Kansas sponsored a facebook page dedicated to <strong>the</strong> Region L planning process<br />
with a link to survey monkey for public feedback. Copies of <strong>the</strong> survey and links can be <strong>found</strong> in<br />
appendix B.<br />
A second public comment period was held during July 2013. A press release was issued on<br />
facebook and through <strong>the</strong> Counties public information channels that notified <strong>the</strong> public that <strong>the</strong><br />
plan summary and questionnaire were available on <strong>the</strong> County’s website and <strong>the</strong> State<br />
Sponsored facebook page.<br />
The questionnaire that was made available to <strong>the</strong> public asked <strong>the</strong>m to rank <strong>the</strong> hazards<br />
according to what <strong>the</strong>y believed <strong>the</strong> biggest threats were, any issues <strong>the</strong>y felt impacted <strong>the</strong>ir<br />
community that was not addressed, and if <strong>the</strong>y even knew what mitigation was. They were also<br />
asked to <strong>review</strong> mitigation actions considered by <strong>the</strong> planning committee and place a check<br />
next to <strong>the</strong> ones <strong>the</strong>y felt should be given <strong>the</strong> highest priority.<br />
1.8
Following are some of <strong>the</strong> public comments received and charts that reflect answers to various<br />
questions. For <strong>the</strong> first public comment period <strong>the</strong>re were 85 responses.<br />
Figure 1.1. Jurisdiction<br />
1. What Jurisdiction do you live<br />
in?<br />
Leavenworth 50<br />
Johnson 12<br />
Wyandotte 23<br />
Figure 1.2. Public Ranked Hazards<br />
The public rated <strong>the</strong><br />
hazards <strong>the</strong>y feel are <strong>the</strong><br />
greatest threat to <strong>the</strong><br />
planning area slightly<br />
different than <strong>the</strong><br />
planning committee. In<br />
<strong>the</strong> top five <strong>the</strong> public<br />
had drought, w<strong>here</strong>as <strong>the</strong><br />
planning committee<br />
indicated<br />
Utility/Infrastructure<br />
failure with drought as<br />
number six.<br />
1.9
Figure 1.3. NFIP Importance<br />
According to <strong>the</strong><br />
public survey, 61.2%<br />
stated that <strong>the</strong> NFIP<br />
is very important, with<br />
25.9% indicating it<br />
was somewhat<br />
important. 8.2% felt it<br />
was not important<br />
and 4.7% had no<br />
opinion.<br />
1.10
Figure 1.4. Opportunity to Read HMP<br />
Yes 16.50%<br />
No 41.2%<br />
Not Known<br />
42.4%<br />
Figure 1.5. Knowledge of Location of Mitigation Plan<br />
When <strong>the</strong> public was<br />
asked if <strong>the</strong>y had read<br />
<strong>the</strong>ir local mitigation plan<br />
42.4% indicated <strong>the</strong>y did<br />
not know <strong>the</strong>ir county<br />
had one, 41.2% said no,<br />
and 16.5% had read <strong>the</strong><br />
plan.<br />
Of <strong>the</strong> public that knew a<br />
mitigation plan existed,<br />
61.2% indicated <strong>the</strong>y did<br />
not know w<strong>here</strong> <strong>the</strong> plan<br />
could be located in order<br />
to read it, and 38.8%<br />
stated <strong>the</strong>y knew <strong>the</strong><br />
location of <strong>the</strong> plan.<br />
Yes 38.8%<br />
No 61.2%<br />
In addition to <strong>the</strong> data ga<strong>the</strong>red on surveymonkey.com above, <strong>the</strong>re were also 44 responses<br />
from <strong>the</strong> public via hard copy survey’s left in public venues such as courthouses and post<br />
offices. Following are some of <strong>the</strong> pertinent feedback:<br />
NFIP is: Very important 18 Somewhat important 23 Not important 2 No opinion 1<br />
Read HMP: yes: 4 no: 36 no response: 4<br />
Because of <strong>the</strong> large amount of <strong>the</strong> respondents who had not read <strong>the</strong> Hazard Mitigation Plan,<br />
we were curious as to who knew w<strong>here</strong> to find it to read. Following is <strong>the</strong> response:<br />
Know location of HMP: Yes: 13 No: 27 No response: 4<br />
1.11
The public was asked to comment on issues <strong>the</strong> planning committee should address and<br />
projects <strong>the</strong>y would like to see implemented. T<strong>here</strong> were 39 responses with <strong>the</strong> following<br />
representing a few of <strong>the</strong>m:<br />
Coordination of 1st responders and regular training excersizes. More funding for water rescue, emergency<br />
response, confined space rescue, ect. 6/20/2013 12:00 AMView Responses<br />
Since utilizing county resources to respond to emergency situations costs taxpayer money, I feel it is<br />
important to ensure that <strong>the</strong>se resources are focused on preserving county and state facilities that are built<br />
and operated with <strong>the</strong> same funds. While it is important to ensure that <strong>the</strong>re is as much work done to<br />
preserve life and avert suffering, in <strong>the</strong> end a person's personal property is <strong>the</strong>ir responsibility to protect.<br />
While it is vital that <strong>the</strong> county provide as many resources and tools and information for people to enterprise<br />
on as possible, but when it comes to <strong>the</strong> actual adjudication of manpower and funds vital infrastructure<br />
elements need to be of <strong>the</strong> utmost priority. Preserving <strong>the</strong> power grid, establishing routes of transportation,<br />
and maintaining <strong>the</strong> various utilities that make current established life safe, hygienic, and efficient is a far<br />
more valuable use of limited county resources than trying to save every individual affected by a disaster.<br />
6/19/2013 2:16 PMView Responses<br />
Every school should have shelters for all staff and students to protect <strong>the</strong>m against EF5 level tornadoes.<br />
This should be mandatory for every school, regardless of age. 6/19/2013 2:16 PMView Responses<br />
I appreciate that power line upgrades and protection of ciritcal facilities are high on <strong>the</strong> list of priorities.<br />
Publication of <strong>the</strong> mitigation plan (perhaps on local government channels or <strong>the</strong> internet) should be more<br />
visible. 6/19/2013 12:01 AMView Responses<br />
One of <strong>the</strong> biggest threats for damage in a wind/ice storm are broken tree branches impacting power lines<br />
and service to building lines. Those branches are also <strong>the</strong> biggest cause of major outages and outages that<br />
are <strong>the</strong> most difficult to repair, since damage is so wide spread. BPU does tree trimming to clear<br />
transmission lines, but <strong>the</strong>re is no program to educate home owners about that problem nor is <strong>the</strong>re any<br />
program to assist home/business owners to abate tree limbs that threaten in bad wea<strong>the</strong>r. 6/11/2013 2:17<br />
PMView Responses<br />
better monitoring of questionable potentially hazardous waste emissions from industrial plants 6/11/2013<br />
11:02 AMView Responses<br />
Create resources to enable <strong>the</strong> counties to have readily available emergency supplies in a self contained<br />
trailer that can be immediately dispatched to critical areas. The supplies should include food, water, first aid,<br />
lighting, backup generator, and hot and cold wea<strong>the</strong>r supplies. This would greatly reduce <strong>the</strong> time needed to<br />
get supplies to <strong>the</strong> public and first responders. Should hold 48 hours worth of supplies. 5/30/2013 11:56<br />
AMView Responses<br />
Stop builders and developers from building in flood planes. 5/29/2013 9:04 AMView Responses<br />
I would like to see a serious look in to road improvements. Leavenworth County is so far behind in road<br />
improvements that could save life and property damage. I am tired of seeing so much money being spent on<br />
parks and trails instead of w<strong>here</strong> it is needed. 6/19/2013 8:28 PMView Responses<br />
Assistance to those affected by man made flooding, such as levees being broken north of us that impacted<br />
our area by no fault of our own. Some insurance companies would not cover loss because it was man made<br />
not natural. 6/19/2013 4:18 PMView Responses<br />
I wish <strong>the</strong>re was a stronger way to volunteer during natural disasters or heavy snowfall. I have yet to find an<br />
option to participate in relief efforts for civilian volunteers. This last snow fall I called in to both <strong>the</strong> Sheriff’s<br />
Office and Emergency Management to ask if any help was needed and I was told that county workers had it<br />
1.12
covered. While I don’t doubt <strong>the</strong> skill of <strong>the</strong> county relief workers I highly doubt that <strong>the</strong>re was nothing that<br />
someone with time and inclination could help out with, especially in unskilled avenues such as hand<br />
shoveling. It’d be nice to have some sort of volunteer coordinator or system for those who wish to volunteer<br />
not through an organization like Red Cross but <strong>the</strong> county itself. 6/19/2013 2:16 PMView Responses<br />
Less red tape for organizations wanting to help. Our church is no longer qualifed as a Red Cross shelter<br />
because we don't have <strong>the</strong> space to store cots and supplies. (or so I've heard). Seems if an organization<br />
wants to donate space for temporary shelter, <strong>the</strong>y would be welcome and o<strong>the</strong>r arrangements could be<br />
made for storage of <strong>the</strong> <strong>material</strong>s. 6/19/2013 12:01 AMView Responses<br />
I would like to see a County wide emergency management rehersal, with limited access to electricity,<br />
telephone and computer, cell phone connections. 6/4/2013 8:33 PMView Responses<br />
I don't understand what a mitigation project is. 6/1/2013 5:15 PMView Responses<br />
Coordination with O<strong>the</strong>r Departments and Agencies<br />
44 CFR Requirement 201.6(b): An open public involvement process is essential to <strong>the</strong><br />
development of an effective plan. In order to develop a more comprehensive approach to<br />
reducing <strong>the</strong> effects of natural, man-made, and technological disasters, <strong>the</strong> planning<br />
process shall include: (2) An opportunity for neighboring communities, local and<br />
regional agencies involved in hazard mitigation activities, and agencies that have <strong>the</strong><br />
authority to regulate development, as well as businesses, academia and o<strong>the</strong>r private<br />
and non-profit interests to be involved in <strong>the</strong> planning process. (3) Review and<br />
incorporation, if appropriate, of existing plans, studies, reports, and technical<br />
information.<br />
Local, State, and Federal agencies and departments were invited to <strong>the</strong> planning meetings in<br />
order to learn about, and contribute to <strong>the</strong> planning process. All organizations that were invited<br />
are included in Appendix B. Unique to <strong>the</strong> Regional Planning process is <strong>the</strong> invitation for<br />
surrounding counties to attend <strong>the</strong> meetings. Because it is a Regional Plan, it is a multiple<br />
county plan. However, <strong>the</strong> Kansas Division of Emergency Management posted all <strong>the</strong> meetings<br />
in <strong>the</strong>ir quarterly newsletter, and sent calendar invites to various state, federal and local<br />
governments. Following are some of <strong>the</strong>se entities which attended:<br />
• Federal Emergency Management Personnel<br />
• Kansas Division of Water Resources<br />
• Kansas Department of Agriculture<br />
• Kansas Division of Emergency Management<br />
The planning committee reached out to o<strong>the</strong>r organizations and agencies as part of <strong>the</strong><br />
collaboration initiative in order to collect and <strong>review</strong> technical data, reports, and plans. These<br />
include <strong>the</strong> State Hazard Mitigation Plan, Multi-jurisdictional Hazard Mitigation Plans for<br />
Johnson, Leavenworth, and Wyandotte counties, Metro area Commodity Flow Study, available<br />
DFIRMS, Emergency Action Plans, Kansas Department of Health and Environment studies and<br />
1.13
statistical analysis, United States Corps of Engineers high and significant dam studies, as well<br />
as levee information. The United States Department of Agriculture and Unites States Census<br />
Bureau were invaluable for <strong>the</strong>ir demographic and agricultural information, and <strong>the</strong> National<br />
Wea<strong>the</strong>r Service was instrumental in statistical data on wea<strong>the</strong>r events. All of <strong>the</strong> above<br />
entities, and those not named, were paramount to <strong>the</strong> analysis of and identification of hazards,<br />
vulnerabilities, capabilities, and <strong>the</strong> formation of goals and actions. These sources are<br />
documented throughout <strong>the</strong> plan. A list of contacts that were repeatedly contacted can be <strong>found</strong><br />
in Appendix D.<br />
Identify and Profile <strong>the</strong> Hazards<br />
The planning committee was unanimous in its decision to incorporate all 22 identified hazards in<br />
<strong>the</strong>ir plan that <strong>the</strong> State of Kansas has listed in <strong>the</strong> State Hazard Mitigation Plan. It was agreed<br />
that all of <strong>the</strong>se hazards could affect <strong>the</strong> planning area, albeit at different degrees. Past events<br />
and impacts were discussed at <strong>the</strong> kick off meetings, which led to <strong>the</strong> affirmation and/or<br />
changing of <strong>the</strong> calculated priority risk index for each hazard. Historical events, topography,<br />
and undocumented events were used to determine <strong>the</strong> probability, magnitude, duration, and<br />
warning time of each of <strong>the</strong> 22 hazards. The methodology and resources used to identify and<br />
profile <strong>the</strong> hazards can be <strong>found</strong> in Sections 3.1 and 3.2.<br />
Assets<br />
The planning committee collected information on <strong>the</strong> likely impacts of future events on <strong>the</strong><br />
jurisdictions that participated in <strong>the</strong> plan. The assets are integral to <strong>the</strong> vulnerability and<br />
capability assessment.<br />
Vulnerability Assessment<br />
The Vulnerability of a community begins with its assets which include <strong>the</strong> total number and<br />
value of structures; critical facilities and infrastructure; natural, man made, and technological,<br />
historic and cultural assets, economic assets, and vulnerable populations. Development trends<br />
were also analyzed. The assets at risk were discussed for <strong>the</strong> planning area as a whole for<br />
those hazards that do not vary geographically.<br />
Capability Assessment<br />
The capability assessment is accomplished by identifying <strong>the</strong> existing mitigation capabilities of<br />
<strong>the</strong> participating jurisdictions. This includes existing government programs, policies,<br />
regulations, ordinances, plans and policies. Technological and fiscal resources were assessed<br />
as well as on-going mitigation initiatives that include public outreach. This data is available in<br />
more detail in Section 2 Jurisdictional Profiles.<br />
Estimate Losses<br />
Hazards that received a high or moderate planning significance were also subjected to<br />
an estimated loss using best available data. HAZUS was utilized to estimate losses in<br />
1.14
<strong>the</strong> planning area for flood and earthquake events. This methodology is fur<strong>the</strong>r detailed<br />
for each hazard that included a loss estimate in section 3. Ano<strong>the</strong>r path to estimated<br />
losses was <strong>the</strong> utilization of scenario events. These are hypo<strong>the</strong>tical but give a good<br />
indication of losses should a hazard event strike.<br />
Goals<br />
During <strong>the</strong> second planning meeting <strong>the</strong> discussion was centered on <strong>the</strong> goals for <strong>the</strong> Region. It<br />
was decided that <strong>the</strong> Region would not list objectives for this plan update. The risk assessment,<br />
issues identified, and concerns were all scrutinized for <strong>the</strong> profiled hazards. After a lot of<br />
thought and deliberation, <strong>the</strong> planning committee refined <strong>the</strong> wording of <strong>the</strong> goals, achieving a<br />
consensus which is described in Chapter 4.<br />
Activities<br />
During <strong>the</strong> kick off meetings, each jurisdiction was given a worksheet in order to put down any<br />
mitigation actions <strong>the</strong>y wanted to see incorporated into <strong>the</strong> plan. They were also given a table<br />
that reflected <strong>the</strong> current mitigation actions that resided in <strong>the</strong> current plan so that <strong>the</strong>y could<br />
<strong>review</strong> <strong>the</strong>m for accuracy, and delete <strong>the</strong>m if <strong>the</strong>y were no longer applicable. During <strong>the</strong> second<br />
planning meeting it was decided that <strong>the</strong> STAPLEE process of prioritization was not an accurate<br />
depiction of <strong>the</strong> community’s true process on how <strong>the</strong>y rate <strong>the</strong>ir actions. It was decided that<br />
<strong>the</strong> planning committee would rate <strong>the</strong> actions with a High, Medium, or Low ranking, and not<br />
utilize <strong>the</strong> STAPLEE criteria as laid out. This process is described in more detail in Chapter 4<br />
Mitigation Strategy.<br />
Draft <strong>the</strong> Plan<br />
The first complete draft of <strong>the</strong> plan was made available prior to <strong>the</strong> second meeting of <strong>the</strong><br />
committee. Comments, suggestions, and concerns were incorporated into <strong>the</strong> final draft of <strong>the</strong><br />
plan which was available for <strong>the</strong> third meeting in July. The plan was made available to <strong>the</strong><br />
general public and o<strong>the</strong>r agencies during <strong>the</strong> same timeframes for <strong>review</strong> and comment. These<br />
comments, when applicable, were incorporated into <strong>the</strong> final draft for submission to FEMA VII.<br />
Adopt <strong>the</strong> Plan<br />
Appendix A of this plan houses <strong>the</strong> signed resolutions adopting <strong>the</strong> plan.<br />
Implement, Evaluate, and Revise <strong>the</strong> Plan<br />
The planning committee <strong>review</strong>ed and agreed upon an overall strategy to implement <strong>the</strong> plan,<br />
monitor and maintain <strong>the</strong> plan during meeting 3. Chapter 5 Plan Maintenance Process fur<strong>the</strong>r<br />
defines this process.<br />
1.15
2 Jurisdictional Profiles<br />
2.1.1 Topography<br />
The topography of Region L is comprised of two distinct geographical areas: <strong>the</strong> Glaciated<br />
Region and <strong>the</strong> Osage Cuestas.<br />
The Glaciated Region is a result of glaciers that moved through <strong>the</strong> area twice between 1.6<br />
million and 10,000 years ago. This topographical region is distinct for its silt, pebbles, and<br />
boulders that remained after <strong>the</strong> glaciers melted away.<br />
The Osage Cuestas are predominantly in <strong>the</strong> sou<strong>the</strong>astern portion of <strong>the</strong> State of Kansas and<br />
are noted for its <strong>found</strong>ation rocks which are among <strong>the</strong> oldest exposed in Kansas. The Cuestas<br />
are comprised of rolling hills and low ridges that are steep on one side and gently sloping on <strong>the</strong><br />
o<strong>the</strong>r.<br />
The Missouri River borders Leavenworth and Wyandotte Counties, which creates a known<br />
flooding risk. The last flood event that affected Leavenworth and Wyandotte County was <strong>the</strong><br />
Missouri River flood of 2011.<br />
Figure 2.1 and 2.2 show <strong>the</strong> distinct regions of Kansas:<br />
2.1
2.2
2.1.2 Population<br />
The following summarizes <strong>the</strong> population within Region L, followed by Table 2.1 which shows<br />
<strong>the</strong> population data broken out for each county.<br />
According to <strong>the</strong> 2010 U.S. Census Bureau, <strong>the</strong> regional population in 2010 was 777,911. The<br />
population in <strong>the</strong> region has increased by 14.79% from 2000 to 2010. Table 2.1 shows <strong>the</strong><br />
population trend for <strong>the</strong> past decade in <strong>the</strong> three counties that makeup <strong>the</strong> Region. With <strong>the</strong><br />
exception of Wyandotte County, <strong>the</strong> Region has seen substantial growth in <strong>the</strong> prior decade,<br />
and is expected to continue <strong>the</strong>se gains.<br />
The most densely populated area within this region, and Kansas as a whole, is Johnson County<br />
with 1,149.6 people per square mile. Wyandotte County has 1,039 people per square mile, and<br />
Leavenworth County is <strong>the</strong> least densely populated with 164.7 people per square mile.<br />
Table 2.1.<br />
Region L Population, 2000 to 2010, and 2011 Estimates<br />
County<br />
2000 Census<br />
Population<br />
2010 Census<br />
Population<br />
Population<br />
Change<br />
(Numerical)<br />
2000-2010<br />
Population<br />
Change<br />
(Percent)<br />
2000-2010<br />
2011<br />
Population<br />
Estimates<br />
July 1, 2011<br />
Johnson 451,086 544,179 93,093 20.64% 552,991<br />
Leavenworth 68,691 76,227 7,536 10.97% 77,176<br />
Wyandotte 157,882 157,505 -377 -0.24% 158,224<br />
Subtotal 677,659 777,911 100,252 14.79% 788,391<br />
Source: U.S. Census Bureau 2010, www.census.govkansas<br />
2.1.3 Housing Trends<br />
An indicator of growth for any given jurisdiction is <strong>the</strong> number of housing units. The U.S.<br />
Census Bureau defines a housing unit as; a house, an apartment, a mobile home or trailer, a<br />
group of rooms, or a single room that is occupied, or, if vacant, is intended for occupancy as<br />
separate living quarters. As indicated in table 2.2, overall Region L has seen gains in housing<br />
units with a total increase of 18.43%. Johnson County had <strong>the</strong> largest increase in housing units<br />
with an additional 44,959.<br />
2.3
Table 2.2. Housing Unit Gains 2000-2010<br />
County<br />
2000 Census<br />
Housing<br />
Units<br />
2010 Census<br />
Housing Units<br />
Housing Unit<br />
Change<br />
(Numerical)<br />
2000-2010<br />
Housing Unit<br />
Change (Percent)<br />
2000-2010<br />
Johnson 181,612 226,571 44,959 24.76%<br />
Leavenworth 24,401 28,697 4,296 17.61%<br />
Wyandotte 65,892 66,747 855 1.30%<br />
Total 271,905 322,015 50,110 18.43%<br />
Source: U.S. Census Bureau 2010, www.census.gov<br />
2.1.4 Economics<br />
Region L has a wide and diverse economic footprint. The agriculture industry holds <strong>the</strong> smallest<br />
percent of employment in <strong>the</strong> three counties. The highest percentage of employment, across <strong>the</strong><br />
board in Region L is in educational services and health care. The highest class of worker for all<br />
three counties is private wage and salary workers, with Leavenworth County notable having<br />
25% of its workforce in <strong>the</strong> government sector. As far as income and benefits, Leavenworth<br />
County and Johnson County are predominantly in <strong>the</strong> $100,000 to $149,999 range, with<br />
Wyandotte County in <strong>the</strong> $50,000 to $74,999 range per total household income.<br />
2.1.5 Climate<br />
The climate in Region L is consistent among all three counties, with each having four distinct<br />
seasons: winter, summer, spring, and fall. Average rainfall for Region L is 37.86 inches per<br />
year, with an average of 216 days of sunshine. Snowfall averages are 16.83 inches. The<br />
average July high for <strong>the</strong> region is 89.76 degrees, and <strong>the</strong> average January low is 19.7 degrees.<br />
While <strong>the</strong> aforementioned are averages for <strong>the</strong> region, currently all of Kansas is in a severe to<br />
exceptional drought, which has been ongoing for several of years. Since drought can skew <strong>the</strong><br />
averages, <strong>the</strong> past several years were not included in <strong>the</strong> precipitation totals.<br />
2.1.6 Capabilities<br />
Region L’s funding capabilities exceed most of <strong>the</strong> state of Kansas. While funding is an issue<br />
everyw<strong>here</strong>, Johnson, Wyandotte, and Leavenworth Counties are more able to withstand <strong>the</strong><br />
staffing and budgetary constraints that come with an economic downturn.<br />
More economic details for <strong>the</strong> region is discussed fur<strong>the</strong>r within <strong>the</strong> county sections.<br />
2.4
2.1.7 Exposure of Built Environment/Cultural Resources<br />
This section quantifies <strong>the</strong> buildings exposed to potential hazards, by county. Table 2.3 and<br />
Table 2.4 provide <strong>the</strong> value of <strong>the</strong> counties built environment and its contents, which in addition<br />
to <strong>the</strong> population information presented above, forms <strong>the</strong> basis of <strong>the</strong> vulnerability and risk<br />
assessment presented in this plan. This information was compiled from inventory data<br />
associated with FEMA’s loss estimation software HAZUS-MH 2.1. Buildings are classified into<br />
seven categories: residential, commercial, industrial, agriculture, religious, government, and<br />
educational. Values reflect 2006 valuations, published by R.S. Means Company (Means<br />
Square foot Costs, 2006) with replacement costs.<br />
2.5
Table 2.3. Estimated Replacement Value of Buildings by Category for Region L (2006)<br />
County<br />
Residential<br />
($1,000s)<br />
Commercial<br />
($1,000s)<br />
Industrial<br />
($1,000s)<br />
Agriculture<br />
($1,000s)<br />
Religion<br />
($1,000s)<br />
Government<br />
($1,000s)<br />
Education<br />
($1,000s) Total ($1,000s)<br />
Mitigation Planning Region L<br />
Johnson $32,813,492 $8,111,879 $1,699,112 $112,125 $612,676 $143,472 $378,712 $43,871,468<br />
Leavenworth $3,928,203 $578,117 $104,793 $27,384 $81,685 $41,955 $115,646 $4,877,783<br />
Wyandotte $8,317,902 $2,408,512 $739,055 $22,467 $346,313 $68,468 $163,949 $12,066,666<br />
Region L Total $45,059,597 $11,098,508 $2,542,960 $161,976 $1,040,674 $253,895 $658,307 $60,815,917<br />
Table 2.4. Estimated Replacement Value of Building’s contents by Category for Region L (2006)<br />
County<br />
Residential<br />
($1,000s)<br />
Commercial<br />
($1,000s)<br />
Industrial<br />
($1,000s)<br />
Agriculture<br />
($1,000s)<br />
Religion<br />
($1,000s)<br />
Government<br />
($1,000s)<br />
Education<br />
($1,000s) Total ($1,000s)<br />
Mitigation Planning Region L<br />
Johnson $16,411,492 $8,556,170 $2,361,961 $112,125 $612,676 $160,661 $428,039 $28,643,124<br />
Leavenworth $1,965,410 $622,375 $130,698 $27,384 $81,685 $46,187 $119,213 $2,992,952<br />
Wyandotte $4,161,308 $2,573,106 $1,049,118 $22,467 $346,313 $72,009 $196,832 $8,421,153<br />
Region L Total $22,538,210 $11,751,651 $3,541,777 $161,976 $1,040,674 $278,857 $744,084 $40,057,229<br />
2.6
Cultural Resources<br />
When determining mitigation strategies for Region L, historic and cultural resources should be<br />
considered. The following provides <strong>the</strong> number of National and State Historic Register Listings<br />
in <strong>the</strong> region by county. These will be fur<strong>the</strong>r detailed in <strong>the</strong> respective county section that<br />
follows.<br />
• Johnson County 32<br />
• Leavenworth County 43<br />
• Wyandotte county 43<br />
2.7
2.2 Johnson County History<br />
The first inhabitants of Johnson County were <strong>the</strong> Shawnee and Kansas Indians who <strong>found</strong> a<br />
plethora of bears, beavers, mink, otters, and wolves for sustenance. In 1825, <strong>the</strong> Shawnee<br />
reservation was set aside for <strong>the</strong>se Indians and by 1844 <strong>the</strong> reservation had more than<br />
1,600,000 acres.<br />
The county was officially established in 1855. The first battle of <strong>the</strong> Civil War that occured<br />
within Johnson County was <strong>the</strong> battle of Blow-hard. Among Johnson County’s colorful past was<br />
<strong>the</strong> raid on Ola<strong>the</strong> by C.R. Jenison, followed by Quantrill. Quantrill next raided Shawnee -<br />
nearly burning <strong>the</strong> entire city down.<br />
After <strong>the</strong> Civil War years, Johnson County grew at a rapid pace. In 1870 <strong>the</strong> population was<br />
13,000 and by 1910 it had risen to 18,288. After WWII <strong>the</strong> population had grown to 63,000 and<br />
by <strong>the</strong> 60s that figure doubled. After <strong>the</strong> opening of Interstates 35 and 435, rural areas were<br />
opened to new development, ultimately increasing <strong>the</strong> employment number for businesses by<br />
200%. 1<br />
2.2.1 County Geography/Topography<br />
Johnson County borders Leavenworth and Wyandotte Counties to <strong>the</strong> north, <strong>the</strong> State of<br />
Missouri to <strong>the</strong> east, Miami County on <strong>the</strong> south, and Douglas County on <strong>the</strong> west. The area is<br />
approximately 480 square miles. Johnson County lies partly within <strong>the</strong> Attenuated Drift Border<br />
division of <strong>the</strong> Dissected Till Plains (Glaciated Region) and partly in <strong>the</strong> Osage Cuestas division<br />
of <strong>the</strong> Osage Plains (Schoewe, 1949). Much of <strong>the</strong> area consists of gently rolling uplands with<br />
hilly areas along <strong>the</strong> streams. North-flowing streams tributary into <strong>the</strong> Kansas River, such as Kill<br />
Creek, Cedar Creek, Mill Creek, and have steeper gradients and greater local relief than eastflowing<br />
and south-flowing streams. Relief of 150 to 250 feet is common within a mile of <strong>the</strong><br />
north-flowing streams in <strong>the</strong>ir more hilly parts. Local relief along <strong>the</strong> east-flowing tributaries of<br />
<strong>the</strong> Missouri River and <strong>the</strong> south-flowing tributaries of <strong>the</strong> Marais des Cygnes River within a mile<br />
of <strong>the</strong> stream generally is less than 150 feet.<br />
Figure 2.3 reflects a map of <strong>the</strong> Johnson County planning area:<br />
2.8
Figure 2.3. Johnson County Planning Area<br />
2.9
2.2.2 Johnson County Climate<br />
Johnson County, KS, receives 38 inches of rain per year, on average. The US average is 37.<br />
Snowfall average is 17 inches, while <strong>the</strong> average US city gets 25 inches of snow per year. The<br />
number of days with any measurable precipitation is 89. On average, <strong>the</strong>re are 216 sunny days<br />
per year in Johnson County, KS. The July high is around 89 degrees. The January low is 20.<br />
The comfort index, which is based on humidity during <strong>the</strong> summer months, is a 34 out of 100,<br />
with higher values being more comfortable. The US average on <strong>the</strong> comfort index is 44. The<br />
aforementioned climate statistics do not account for <strong>the</strong> severe drought that <strong>the</strong> State of Kansas<br />
has been in for 2 years. Since <strong>the</strong> beginning of 2012, Johnson County has received an average<br />
of 56% of <strong>the</strong>ir normal precipitation.<br />
2.2.3 County Population/Demographics<br />
According to <strong>the</strong> U.S. Census Bureau, <strong>the</strong> total population of Johnson County in 2010 was<br />
544,179. The population in <strong>the</strong> County has increased over <strong>the</strong> past decade by 20.64%. Table<br />
2.5 below shows <strong>the</strong> population trends for <strong>the</strong> participating jurisdictions within Johnson County:<br />
Table 2.5. Johnson County Jurisdictional Population/Changes from, 2000 to 2010<br />
Jurisdiction 2000 Population 2010 Population Difference 2000 –<br />
Desoto 4,561 5,720 1,169<br />
Edgerton 1,440 1,671 231<br />
Fairway 3,952 3,882 (70)<br />
Gardner 9,396 19,123 9,727.0<br />
Lake Quivira 932 906 (26)<br />
Leawood 27,656 31,867 4,211<br />
Lenexa 40,238 48,190 7,952<br />
Merriam 11,008 11,003 (5)<br />
Mission 9,727 9,323 (404)<br />
Mission Hills 3,593 3,498 (95)<br />
Mission Woods 165 178 13<br />
Ola<strong>the</strong> 92,962 125,872 32,910<br />
Overland Park 149,080 173,372 24,292<br />
Prairie Village 22,072 21,447 (625)<br />
Roeland Park 6,817 6,731 (86)<br />
Shawnee 47,996 62,209 14,213<br />
Spring Hill 2,727 5,437 2,710<br />
Westwood 1,533 1,506 (27)<br />
Westwood Hills 378 359 (19)<br />
Unicorporated Johnson 14,853 11,885 (2968)<br />
Total County 451,086 544179 93,093<br />
Source: US Census Bureau<br />
2.10
In Table 2.6 are Census Bureau demographics and societal characteristics for Jurisdictions<br />
within Johnson County.<br />
Table 2.6. Johnson County Jurisdictional Demographics<br />
Jurisdiction White % Black or<br />
African<br />
American<br />
Hispanic/Latin<br />
(Any Race) (%)<br />
Average<br />
Household<br />
Size (people)<br />
Bachelor<br />
Degree or<br />
Higher (%)<br />
DeSoto 89.7 .8 14.6 2.81 27.9<br />
Edgerton 93.7 .8 4.3 2.79 15.3<br />
Fairway 95.3 .8 3.0 2.24 39.1<br />
Gardner 89.7 3.0 6.2 2.83 32.1<br />
Lake Quivira 96.4 .6 1.8 2.5 33.8<br />
Leawood 92.3 1.9 2.2 2.66 74.7<br />
Lenexa 84.4 5.8 7.3 2.5 51.6<br />
Merriam 83.4 6.1 10.7 2.24 33.9<br />
Mission 84.6 5.5 8.2 1.82 48.0<br />
Mission Hills 96.8 .2 1.8 2.79 49.0<br />
Mission Woods 97.8 06 0 2.31 40.8<br />
Ola<strong>the</strong> 83.1 5.3 10.2 2.79 44.7<br />
Overland park 84.4 4.3 6.3 2.37 56.6<br />
Prairie Village 95.3 1.0 3.4 2.16 63.6<br />
Roeland Park 87.6 3.7 10.4 2.24 51.4<br />
Shawnee 86.3 5.3 7.5 2.64 41.7<br />
Spring Hill 93.7 1.6 4.0 2.95 27.0<br />
Westwood 94.6 .9 7.7 2.18 35.4<br />
Westwood Hills 94.4 1.7 3.1 2.15 46.6<br />
Johnson Co. 88.2 4.7 7.3 2.51 51.3<br />
Source: U.S. Census Bureau<br />
According to <strong>the</strong> U.S. Census Bureau, by gender breakdown, males represent 48.9 percent of<br />
<strong>the</strong> population, and females represent 51.1 percent of <strong>the</strong> population.<br />
2.2.4. County Economics<br />
INDUSTRY Estimated Employees %<br />
Civilian employed population 16 years and over 308,370 74.7<br />
Agriculture, forestry, fishing and hunting, and mining 1275 0.4%<br />
Construction 13,745 4.7%<br />
Manufacturing 24,737 8.4%<br />
Wholesale trade 12,734 4.3%<br />
Retail trade 33,519 11.4%<br />
Transportation and warehousing, and utilities 11,721 4.0%<br />
2.11
INDUSTRY Estimated Employees %<br />
Information 14,006 4.8%<br />
Finance, insurance, real estate and rental and leasing 29,645 10.1%<br />
Professional, scientific, management, administrative and waste 43,011 14.7%<br />
Educational services, health care and social assistance 65,100 22.2%<br />
Arts, entertainment, recreation, accommodation and food services 21,565 7.4%<br />
O<strong>the</strong>r services, except public administration 13,556 4.6%<br />
Public administration 8,593 2.9%<br />
Source: U.S. Census Bureau<br />
According to data provided by <strong>the</strong> United States Census Bureau, Education Services, Health<br />
Care and Social Assistance are <strong>the</strong> leading Industry in Johnson County at 22.2%. At <strong>the</strong> bottom<br />
of <strong>the</strong> Industry list is agriculture, forestry, fishing and hunting, along with mining, with .4% of <strong>the</strong><br />
workforce.<br />
The lead in occupations in Johnson County is management, business, science, and <strong>the</strong> arts. At<br />
<strong>the</strong> bottom of <strong>the</strong> occupation list is employment in natural resources, construction, and<br />
maintenance. Private wage and salary workers make up 83.1% of <strong>the</strong> class of workers, with<br />
government second at 11.2%.. Self-employed in own not incorporated business workers is<br />
5.7%.. The following is a chart that shows <strong>the</strong> top four occupational fields in Johnson County:<br />
7%<br />
Management,<br />
business, science,<br />
and arts<br />
Service<br />
29%<br />
51%<br />
Sales and Office<br />
13%<br />
Production &<br />
Transportation<br />
2.12
2.2.5 Johnson County Capabilities<br />
The mitigation capabilities are profiled in <strong>the</strong> following section and include: organizational<br />
structure; staff, fiscal, and technical resources; adopted plans, policies, and regulations, if any.<br />
Johnson County<br />
Overview<br />
The jurisdiction Johnson County includes all unincorporated areas within <strong>the</strong> County<br />
boundaries, and 7 townships. Johnson County is a full service local government including <strong>the</strong><br />
following departments and agencies:<br />
Airport Commission District Court Trustee Library<br />
Appraiser Election Office Mapping / GIS - AIMS<br />
Archives & Records Mgmt Emergency Communications Med-Act<br />
Audit Services<br />
Emergency Mgmt & Homeland Security Mental Health<br />
Budget & Financial Planning Environmental Motor Vehicle<br />
Building Codes Extension Office Museums<br />
Bus - The JO Facilities Management Park & Recreation<br />
Collections Unit Financial Management Planning & Development<br />
Community Development Grants Management Public Health<br />
Contractor Licensing Human Resources Public Works<br />
Corrections Human Services & Aging Records & Tax Admin<br />
County Manager's Office Information Technology Services Sheriff's Office<br />
Court Services Law Library Treasurer's Office<br />
Developmental Supports Legal Wastewater<br />
District Attorney's Office<br />
District Courts<br />
Land Use and Development Trends<br />
As depicted in <strong>the</strong> regional information section, Johnson County is <strong>the</strong> fastest growing of all <strong>the</strong><br />
counties in <strong>the</strong> region, as well as <strong>the</strong> State of Kansas. Since 2000, <strong>the</strong> population has grown by<br />
20.64%, which contributes to construction, employment, services, and all o<strong>the</strong>r aspects of <strong>the</strong><br />
economy. Because of its urban landscape it is attractive to young adults and <strong>the</strong> elderly who<br />
are entering retirement and/or want to be closer to advanced medical facilities.<br />
Technical and Fiscal Resources<br />
Johnson County is included in <strong>the</strong> definition of <strong>the</strong> Metro Region, and along with that<br />
nomenclature, it has <strong>the</strong> resources to fund a plethora of staff resources in planning, engineering,<br />
floodplain management, storm water management, emergency management, and GIS services.<br />
The Johnson County Emergency Communications Center (ECC) dispatches all 911 calls to Fire<br />
and Emergency Medical Services for 14 departments throughout <strong>the</strong> county. Table 2.8 depicts<br />
Johnson County personnel resources in 2013.<br />
2.13
Table 2.8. Johnson County Administrative and Technical Resources<br />
Personnel Resources Filled(?) Department/Position<br />
Building Code Official Yes Planning and Development<br />
Building Inspector Yes Planning and Development<br />
Mapping Specialist (GIS) Yes AIMS<br />
Engineer Yes Planning & Development/Public Works<br />
Development Planner Yes Planning & Development/Public Works<br />
Public Works Official Yes Public Works<br />
Emergency Management Yes Emergency Management & Homeland Security<br />
NFIP Floodplain Administrator Yes Emergency Management<br />
Bomb Squad<br />
Yes<br />
Arson Squad<br />
Yes<br />
Emergency Response Team Yes<br />
Hazardous Materials Expert Yes<br />
Local Emergency Planning<br />
Committee<br />
County Emergency Management<br />
Commission<br />
No<br />
Yes<br />
Johnson County is part of <strong>the</strong> Mid-America Regional<br />
LEPC<br />
County maintains a fully staffed emergency<br />
management division<br />
Sanitation Department Yes Handles through private sector<br />
Transportation Department Yes<br />
Economic Development<br />
Department<br />
Yes<br />
Housing Department Yes Johnson county Housing Authority via Human Services<br />
Historic Preservation<br />
Yes<br />
Fiscally, Johnson County has a wide array of funding sources that can help <strong>the</strong>m to achieve <strong>the</strong><br />
goals of <strong>the</strong>ir mitigation actions. These include:<br />
• Capital improvement project funds<br />
• Levy Taxes for specific purposes<br />
• Community Development Block Grant (CDBG)<br />
• Impact fees for new development<br />
Existing Plans and Policies<br />
Table 2.9 below lists <strong>the</strong> plans and policies that exist within Johnson County:<br />
2.14
Table 2.9. Johnson County Plans and Policies<br />
Element In Use, Yes, No, N/A Comments<br />
Planning Capabilities<br />
Comprehensive Plan<br />
Yes<br />
Capital Improvement Plan<br />
Yes<br />
City Emergency Operations Plan<br />
N/A<br />
County Emergency Operations<br />
Yes - 2011<br />
Under annual update<br />
Plan<br />
Local Recovery Plan<br />
N/A<br />
County Recovery Plan<br />
Yes<br />
Debris Management Plan Yes – 2009 Under revision for 2013 update<br />
Economic Development Plan<br />
Transportation Plan<br />
Land-use Plan<br />
Flood Mitigation Assistance<br />
(FMA) Plan<br />
Watershed Plan<br />
Firewise or o<strong>the</strong>r fire mitigation<br />
plan<br />
Critical Facilities Plan<br />
Yes<br />
Yes<br />
Yes<br />
Yes<br />
Yes<br />
Yes<br />
Yes<br />
No firewise<br />
Policies/Ordinance<br />
Zoning Ordinance<br />
Yes<br />
Building Code Yes Version 2012<br />
Floodplain Ordinance<br />
Yes<br />
Subdivision Ordinance<br />
N/A<br />
Tree Trimming Ordinance<br />
N/A<br />
Storm Water ordinance<br />
Yes<br />
Drainage Ordinance<br />
Yes<br />
Site Plan Review Requirements<br />
Yes<br />
Historic Preservation Ordinance<br />
Yes<br />
Landscape Ordinance<br />
Wetlands/Riparian Areas<br />
Conservation Plan<br />
Yes<br />
Yes<br />
O<strong>the</strong>r Mitigation Activities<br />
Johnson County is proactive in its stance for programs that alleviate <strong>the</strong> threat of hazards,<br />
whe<strong>the</strong>r natural, man-made, or technological. Table 2.10 below depicts various programs that<br />
<strong>the</strong> County uses as a mitigation tool:<br />
2.15
Table 2.10. Johnson County Program Mitigation Tools<br />
Element In Use, Yes, No, N/A Comments<br />
Program<br />
Zoning/Land use Restrictions<br />
Codes Building Site/Design<br />
Hazard Awareness Program<br />
National Flood Insurance<br />
Program<br />
National Wea<strong>the</strong>r Service (NWS)<br />
Storm Ready Certification<br />
Yes<br />
Yes<br />
Yes<br />
Yes<br />
Yes Waiting on renewal for 2013.<br />
Granted, not yet received<br />
Land Use Program<br />
Yes<br />
Public Education/Awareness Yes JCEM has a full community<br />
preparedness program<br />
Property Acquisition<br />
Planning/Zoning boards<br />
Stream Maintenance Program<br />
Engineering Studies for Streams<br />
(Local/County/Regional)<br />
Yes<br />
Yes<br />
Yes<br />
Yes<br />
Mutual Aid Agreements Yes Mutual aid agreements are in<br />
place in various departments for<br />
Johnson County has numerous studies, reports, and maps in order to illustrate what and w<strong>here</strong><br />
<strong>the</strong>ir hazards and vulnerabilities are.<br />
Table 2.11. Johnson County Studies, Reports, and Maps<br />
Element In Use, Yes, No, N/A Comments<br />
Studies/Reports/Maps<br />
Hazard Analysis/Risk<br />
Yes<br />
Assessment (County)<br />
Evacuation Route Map Yes Maps can be generated at any<br />
time through AIMS<br />
Critical Facilities Inventory<br />
Yes<br />
Vulnerable Population Inventory Yes County maintains access through<br />
<strong>the</strong> Vulnerable Needs Registry<br />
Land Use Map<br />
Yes<br />
2.2.6 Critical Facilities and Infrastructure<br />
A critical facility is defined as one that is essential in providing utility or direction ei<strong>the</strong>r during<br />
<strong>the</strong> response to an emergency or during <strong>the</strong> recovery operation. Appendix C has an inventory of<br />
2.16
critical facilities and infrastructure in Johnson County. It includes <strong>the</strong>ir replacement value and<br />
capacity information when available. These are specific assets identified by <strong>the</strong> planning<br />
committee as <strong>the</strong> structures and facilities that should receive priority consideration in efforts to<br />
minimize risk.<br />
2.2.7 O<strong>the</strong>r Assets<br />
The vulnerability of Johnson County to disaster also involves inventorying <strong>the</strong> natural,<br />
historic, cultural, and economic assets of <strong>the</strong> area. This is important for <strong>the</strong> following reasons:<br />
• These types of resources warrant a greater degree of protection due to <strong>the</strong>ir unique and<br />
irreplaceable nature and contribution to <strong>the</strong> overall economy.<br />
• Knowing about <strong>the</strong>m ahead of time allows for a proactive stance to prepare before a disaster<br />
hits. In <strong>the</strong> immediate aftermath, when <strong>the</strong> potential for additional impacts is higher, it allows for<br />
an immediate response in order to lessen any damages.<br />
• The rules for reconstruction, restoration, rehabilitation, and/or replacement are often different<br />
for <strong>the</strong>se types of designated resources and knowing ahead of time can save time, money, and<br />
o<strong>the</strong>r resources..<br />
• Natural resources can have beneficial functions that reduce <strong>the</strong> impacts of natural hazards,<br />
such as wetlands and riparian habitat, which help absorb and attenuate floodwaters.<br />
• Losses to economic assets (e.g., major employers or primary economic sectors) could have<br />
severe impacts on a community and its ability to recover from a disaster.<br />
• Historic resources: T<strong>here</strong> are 30 Johnson County properties on <strong>the</strong> National Register of<br />
Historic Places:<br />
• Blackfea<strong>the</strong>r Farm 8140 W. 183rd Street Stilwell 8/22/1996<br />
• Dutton-Thomas-Soule Farm 7925 Sunflower Rd De Soto 8/26/2006<br />
• Edgerton-Grange Hall 400 Nelson Edgerton<br />
• Ensor Farm 18995 W. 183rd Street Ola<strong>the</strong> 2/27/2004<br />
• Foster, Herman D. House 204 W. Main Street Gardner 11/28/2007<br />
• Franklin R. Lanter House 562 W. Park Street Ola<strong>the</strong> 10/10/2007<br />
• Harkey House 224 E. Main Gardner<br />
• Hodges House 425 S. Harrison Ola<strong>the</strong><br />
• Horn-Vincent-Russell Estate 6624 Wenonga Road Mission Hills 7/25/1997<br />
• Hyer House 505 East Cedar Ola<strong>the</strong><br />
• Lackman-Thompson Farm 11180 Lackman Road Lenexa 5/06/1988<br />
• Lanesfield School 18745 S. Dillie Road Edgerton 10/13/1988<br />
• Loomis Historic District 8325 Johnson Dr, 5900 Hadley Merriam 5/17/2006<br />
2.17
• Mahaffie House 1100 Kansas City Road Ola<strong>the</strong> 8/29/1977<br />
• Majors House 8145 State Line Road Leawood 12/29/1970<br />
• McCarthy House 19700 Sunflower Edgerton 7/10/2000<br />
• Ott House 401 S. Harrison Street Ola<strong>the</strong> 4/01/1998<br />
• Overland Theater 7204 W. 80th Street Overland Park 2/09/2005<br />
• Parker House 631 W. Park Ola<strong>the</strong> 8/29/1988<br />
2.2.8 Cities<br />
City of De Soto<br />
De Soto was <strong>found</strong>ed in 1857 and is located between<br />
Lawrence and Kansas City on highway K-<br />
10. The nor<strong>the</strong>rn border is <strong>the</strong> Kansas River. According<br />
to <strong>the</strong> 2010 U.S. Census, <strong>the</strong> population of De Soto is<br />
5,720, an increase of 1,169 since 2000.<br />
Land Use and Development Trends<br />
With <strong>the</strong> growth in population over <strong>the</strong> past 10 years<br />
comes <strong>the</strong> need for more housing. Land area of <strong>the</strong> city is 11.32 square miles, and <strong>the</strong><br />
population density in 2010 was 516.8 people per square mile. According to <strong>the</strong> Census Bureau,<br />
<strong>the</strong> City of De Soto had 2,204 housing units.<br />
Technical and Fiscal Resources<br />
The City of De Soto has departments that include street, fire, water, wastewater, parks and<br />
recreation, planning & zoning, building & inspections, codes enforcement, city clerk, & court<br />
clerk. The Fire Chief of Fire District 1 also serves as <strong>the</strong> Emergency Manager. All o<strong>the</strong>r<br />
functions are supported by Johnson County.<br />
Financial tools that <strong>the</strong> City of De Soto could use to help fund mitigation projects include:<br />
• Community Development Block Grants<br />
• Capital Improvements project funding<br />
• Johnson County Stormwater Management Program<br />
• Taxes for specific purposes<br />
• Water or Sewer fees<br />
• Impact fees for new development<br />
• Debt through general obligation bonds<br />
• Debt through special tax bonds<br />
• Withholding spending in hazard prone areas<br />
2.18
Existing Plans and Policies<br />
De Soto is a participant in <strong>the</strong> National Flood Insurance Program (NFIP) and has <strong>the</strong> following<br />
plans and policies in place:<br />
• Comprehensive Plan<br />
• Zoning Ordinance<br />
• Subdivision Ordinance<br />
• Site Plan Review Requirements<br />
• Flood Mitigation Plan<br />
• Floodplain Management Ordinance<br />
• Capital Improvements Program<br />
• Building Code<br />
• Sewer Master Plan Study<br />
• Guide to Development Plan<br />
O<strong>the</strong>r Mitigation Activities<br />
None since <strong>the</strong> last update.<br />
Property Valuation<br />
Table 2.12 below depicts <strong>the</strong> appraised values from <strong>the</strong> 2013 Abstract of Appraised and<br />
Assessed Values report.<br />
Table 2.12. Appraised Property Valuation, 2013<br />
Appraised Property Valuation<br />
Building Type Real Estate Structures ($) Median Home Value<br />
(2011)($)<br />
Residential 223,695,910 211,100<br />
Agricultural 5,026,060<br />
Commercial/Industrial 48,183,507<br />
Not for Profit 294,900<br />
Total $277,200,377<br />
Source: Johnson County Assessor Office/U.S. Census Bureau<br />
2.19
City of Edgerton<br />
Overview<br />
Edgerton is considered a small rural town in a very fast<br />
growing county. Edgerton sits on highway 56 and is<br />
two miles south of Interstate 35. The City became<br />
incorporated in 1883 and was named for <strong>the</strong> chief<br />
railroad engineer who helped lay <strong>the</strong> railroad<br />
tracks. According to <strong>the</strong> 2010 U.S. Census,<br />
manufacturing was <strong>the</strong> highest percentage of<br />
Edgerton’s labor force.<br />
Land Use and Development Trends<br />
In 2010, <strong>the</strong> population of Edgerton was 1,671, a 13.8% increase since 2000. The land area is<br />
1.28 square miles, and <strong>the</strong> population density in 2010 was 1,305 people per square mile. With<br />
this increase in population comes an increase in construction for new homes. The greatest<br />
growth is concentrated just to <strong>the</strong> north of Interstate 35, which could increase hazards<br />
associated with responders having to cross railroad tracks.<br />
Technical and Fiscal Resources<br />
Edgerton has a governing body and two departments to implement policies, <strong>the</strong> administration<br />
department and public works department. Positions include a part-time building official, a parttime<br />
floodplain manager, a part-time emergency manager, and a part-time grant writer. The<br />
engineering services are contracted to a consultant and geographic information system (GIS)<br />
services are provided by Johnson County.<br />
Financial tools that <strong>the</strong> city can use to help fund mitigation projects include <strong>the</strong> following:<br />
• Community Development Block Grants<br />
• Capital Improvements Project Funding<br />
• Johnson County Stormwater Management program<br />
• Taxes for Specific Purposes<br />
• Fees for water or sewer<br />
• Impact fees for New Development<br />
• Debt through General Obligation Bonds<br />
• Debt through Special Tax Bonds<br />
Existing Plans and Policies<br />
Edgerton has been a participant in <strong>the</strong> NFIP since 08/01/1979. It also has <strong>the</strong> following plans<br />
and policies in place.<br />
2.20
• Comprehensive Plan<br />
• Zoning Ordinance<br />
• Subdivision Ordinance<br />
• Floodplain Ordinance<br />
• Capital Improvements Program<br />
• Building Code<br />
• Site Plan Review Requirements<br />
• Capital Improvements Plan<br />
O<strong>the</strong>r Mitigation Activities<br />
None as of <strong>the</strong> last plan, dated 2009.<br />
Property Valuation<br />
Table 2.13 below depicts <strong>the</strong> appraised values from <strong>the</strong> 2013 Abstract of Appraised and<br />
Assessed Values report.<br />
Table 2.13. Appraised Property Valuation, 2013<br />
Appraised Property Valuation<br />
Building Type Real Estate Structures ($) Median Home Value<br />
(2011)($)<br />
Residential 44,987,500 Not available<br />
Agricultural 804,810<br />
Commercial/Industrial 1,650,240<br />
Not for Profit 0<br />
Total $47,442,550<br />
Source: Johnson County Assessor Office/U.S. Census Bureau<br />
City of Fairway<br />
Fairway is located in nor<strong>the</strong>ast Johnson County<br />
and is encompassed by Roeland Park, Mission<br />
Woods, Prairie Village, and Mission. It became<br />
incorporated in 1949 and <strong>the</strong> City is known for its<br />
trees and parks. The City is governed by a<br />
Mayor and eight City Council members.<br />
Consolidated Fire District No.2 provides fire<br />
protection services for <strong>the</strong> City. City departments<br />
include <strong>the</strong> following:<br />
2.21
• Administration<br />
• Finance<br />
• Building & Planning<br />
• Parks & Recreation<br />
• Municipal Court<br />
• Police<br />
• Public Work<br />
Land Use and Development Trends<br />
In 2010, <strong>the</strong> population of Fairway was 3,882, a difference of 50 people since <strong>the</strong> last plan<br />
update. However, this is a decrease of 70 people since <strong>the</strong> census of 2000. Land area of<br />
<strong>the</strong> city is 1.14 square miles, and population density in 2010 was 3,405 people per square mile.<br />
Technical and Fiscal Resources<br />
Financial tools or resources that <strong>the</strong> city could potentially use to help fund mitigation activities<br />
include <strong>the</strong> following:<br />
• Community Development Block Grants<br />
• Capital improvements project funding<br />
• Johnson County Stormwater Management Program<br />
• Taxes for specific purposes<br />
• Fees for water or sewer<br />
• Impact fees for new development<br />
• Debt through general obligation bonds<br />
• Debt through special tax bonds<br />
• Withholding spending in hazard prone areas<br />
Existing Plans and Policies<br />
The City of Fairway joined <strong>the</strong> NFIP on 04/23/1971. It has <strong>the</strong> following plans and policies in<br />
place.<br />
• Comprehensive Plan<br />
• Zoning Ordinance<br />
• Floodplain Ordinance<br />
• Capital Improvements Program<br />
• Building Code<br />
• Capital Improvements Plan<br />
O<strong>the</strong>r Mitigation Activities<br />
None as of this plan<br />
2.22
Property Valuation<br />
Table 2.14 below depicts <strong>the</strong> appraised values from <strong>the</strong> 2013 Abstract of Appraised and<br />
Assessed Values report.<br />
Table 2.14. Appraised Property Valuation, 2013<br />
Appraised Property Valuation<br />
Building Type Real Estate Structures ($) Median Home Value<br />
(2011)($)<br />
Residential 336,911,190 Not available<br />
Agricultural 0<br />
Commercial/Industrial 22,078,400<br />
Not for Profit 0<br />
Total $358,989,590<br />
Source: Johnson County Assessor Office/U.S. Census Bureau<br />
City of Gardner<br />
This community was settled mainly by Free<br />
State men. Unlike <strong>the</strong>ir neighboring State of<br />
Missouri that supported slavery. This created many<br />
border war raids and ignited <strong>the</strong> beginning of <strong>the</strong><br />
Civil War.<br />
Gardner became an incorporated town in<br />
1886 and was named in honor of Governor Gardner<br />
of Massachusetts, w<strong>here</strong> Free State settlers<br />
originated. Though many travelers of <strong>the</strong> westward<br />
expansion had already traveled through Gardner by<br />
1886, it was known as <strong>the</strong> location w<strong>here</strong> <strong>the</strong> trails<br />
divide. The Santa Fe Trail, <strong>the</strong> Oregon Trail, and <strong>the</strong> California Trail all split at this location.<br />
Gardner is located in <strong>the</strong> southwest part of <strong>the</strong> county and is surrounded by unincorporated<br />
Johnson County.<br />
The City is operated by a mayor and city council that appoint a city administrator that is<br />
responsible for <strong>the</strong> daily operations of <strong>the</strong> City. T<strong>here</strong> are also five departments within <strong>the</strong> City<br />
government: Finance, Public Works, Community Development, Public Safety, and Parks &<br />
Recreation. The City uses <strong>the</strong> public safety concept w<strong>here</strong> <strong>the</strong> police, fire, and medical are all<br />
cross-trained and can be a first responder for any public safety concern.<br />
2.23
Land Use and Development Trends<br />
In 2010, <strong>the</strong> population of Gardner was 19,123, a 49.1% percent increase since 2007. Today,<br />
Gardner has 9.79 square miles of land. Its population density in 2010 was 1,953 people per<br />
square mile.<br />
With this new growth, <strong>the</strong> City is currently developing more miles of streets, water lines,<br />
storm sewers, and sanitary sewer lines.<br />
Technical and Fiscal Resources<br />
The City of Gardner has a planner, floodplain manager, emergency manager, and building<br />
official. T<strong>here</strong> is also City personnel skilled in GIS. The City has an outdoor storm siren warning<br />
system operated by <strong>the</strong> Gardner Public Safety Department.<br />
Financial tools or resources that <strong>the</strong> city could potentially use to help fund mitigation activities<br />
include <strong>the</strong> following:<br />
• Community Development Block Grants<br />
• Capital improvements project funding<br />
• Johnson County Stormwater Management Program<br />
• Taxes for specific purposes<br />
• Fees for water and sewer<br />
• Impact fees for new development<br />
• Debt through general obligation bonds<br />
• Withholding spending in hazard prone areas<br />
Existing Plans and Policies<br />
Gardner has been a participating member of <strong>the</strong> NFIP since joining on 04/15/1977. Gardner has<br />
<strong>the</strong> following plans and policies in place.<br />
• Comprehensive plan<br />
• Zoning ordinance<br />
• Subdivision ordinance<br />
• Floodplain ordinance<br />
• Capital improvements program<br />
• Building code<br />
• Economic development plan<br />
• Capital improvements plan<br />
O<strong>the</strong>r Mitigation Activities<br />
None available<br />
2.24
Property Valuation<br />
Table 2.14 below depicts <strong>the</strong> appraised values from <strong>the</strong> 2013 Abstract of Appraised and<br />
Assessed Values report.<br />
Table 2.14. Appraised Property Valuation, 2013<br />
Appraised Property Valuation<br />
Building Type Real Estate Structures ($) Median Home Value<br />
(2011)($)<br />
Residential 686,675,823 160,800<br />
Agricultural 1,569,280<br />
Commercial/Industrial 56,157,807<br />
Not for Profit 40,700<br />
Total $744,443,610<br />
Source: Johnson County Assessor Office/U.S. Census Bureau<br />
City of Lake Quivira<br />
Lake Quivira is located in <strong>the</strong> nor<strong>the</strong>rn section of<br />
Johnson County surrounded by <strong>the</strong> city of<br />
Shawnee and Wyandotte County. This small residential<br />
suburb has its own 225-acre lake, golf<br />
course and amenities. The City has a mayor/city council<br />
form of government with several city<br />
departments. Departments are Administration, City<br />
Clerk, Fire and Police.<br />
Land Use and Development Trends<br />
In 2010, <strong>the</strong> population of Lake Quivira was 906, a decrease of 26 people since 2000. Land<br />
area of <strong>the</strong> city is 1.30 square miles, and population density in 2010 was 696.9 people per<br />
square mile.<br />
Technical and Fiscal Resources<br />
Lake Quivira has a planner experienced in land management and engineering infrastructure.<br />
The Fire Chief also serves as <strong>the</strong> City’s Emergency Manager. T<strong>here</strong> is a part-time building<br />
official as well as a part-time treasurer.<br />
Financial tools or resources that <strong>the</strong> city could potentially use to help fund mitigation activities<br />
include <strong>the</strong> following:<br />
• Capital improvements project funding<br />
• Johnson County Stormwater Management Program<br />
2.25
• Taxes for specific purposes<br />
• Impact fees for new development<br />
• Debt through general obligation bonds<br />
• Debt through special tax bonds<br />
Existing Plans and Policies<br />
Lake Quivira has <strong>the</strong> following plans and policies in place.<br />
• Master plan<br />
• Zoning ordinance<br />
• Subdivision ordinance<br />
• Growth management ordinance<br />
• Capital improvements program<br />
• Building code<br />
• Stormwater management program<br />
• Capital improvements plan<br />
O<strong>the</strong>r Mitigation Activities<br />
2012-2013-Proceeding through a multiple phase plan to obtain all necessary engineering<br />
documents, right of way and utility clearances to construct an Emergency Evacuation Exit at<br />
approx. <strong>the</strong> intersection of Navajo West and Renner Road. Currently, with a single point of<br />
ingress and egress evacuation options are limited as <strong>the</strong> presence of <strong>the</strong> Burlington Nor<strong>the</strong>rn<br />
Railway is of primary concern in case of a derailment or a hazmat event. A comprehensive site<br />
selection study yielded <strong>the</strong> Navajo location as <strong>the</strong> best option. Recent approval for this project<br />
has been secured by several committees including Safety & Security, Homeowners’ Association<br />
Board and City Council to proceed with <strong>the</strong> final planning stages of this City funded project<br />
scheduled for completion in 2013-2014.<br />
Property Valuation<br />
Table 2.15 below depicts <strong>the</strong> appraised values from <strong>the</strong> 2013 Abstract of Appraised and<br />
Assessed Values report.<br />
Table 2.15. Appraised Property Valuation, 2013<br />
Appraised Property Valuation<br />
Building Type Real Estate Structures ($) Median Home Value<br />
(2011)($)<br />
Residential 140,709,430 Not available<br />
Agricultural 0<br />
Commercial/Industrial 0<br />
Not for Profit 275,800<br />
Total $140,985,230<br />
Source: Johnson County Assessor Office/U.S. Census Bureau<br />
2.26
City of Leawood<br />
In December 1948, <strong>the</strong> City of Leawood became<br />
incorporated. One of <strong>the</strong> major reasons for<br />
incorporation was to improve city services. The 832<br />
residents were being serviced by <strong>the</strong><br />
Overland Park Volunteer Fire Department and <strong>the</strong><br />
Sheriff’s Department in Ola<strong>the</strong> and <strong>the</strong>y<br />
thought <strong>the</strong> response time was too long. So <strong>the</strong>y<br />
became incorporated to care for <strong>the</strong>mselves and<br />
purchased <strong>the</strong>ir own fire fighting equipment.<br />
Leawood operates under a Mayor and eight council<br />
member governing body that appoints a City<br />
Administrator. Departments include City Attorney, City Clerk, Community Development,<br />
Finance, Fire, Human Resources, Information Services, Municipal Court, Parks & Recreation,<br />
Police, and Public Works<br />
Land Use and Development Trends<br />
In 2010, <strong>the</strong> population of Leawood was 31,867, an increase of 4,211 people since 2000. Land<br />
area of <strong>the</strong> city is 15.08 square miles, and population density in 2010 was 2,113 people per<br />
square mile.<br />
Technical and Fiscal Resources<br />
Leawood has a staff experienced in land management and engineering infrastructure.<br />
Floodplain manager duties are handled by <strong>the</strong> Public Works Department and <strong>the</strong> Fire Chief<br />
serves as <strong>the</strong> City’s Emergency Manager. The following table details staff and technical<br />
resources for Leawood.<br />
Table 2.13. City of Leawood Personnel Resource and Warning Systems<br />
Personnel Resources Yes/No Department/Position Comments<br />
Planner/Engineer with<br />
knowledge of land<br />
development/land<br />
management practices<br />
Yes<br />
Community Development<br />
Director & Public Works<br />
Director<br />
Engineer/Professional<br />
trained in construction<br />
practices related to<br />
buildings and/or<br />
infrastructure<br />
Planner/Engineer/Scientist<br />
with an understanding of<br />
natural hazards<br />
Yes<br />
Yes<br />
Community Development<br />
Director & Public Works<br />
Director<br />
Public Works Engineering<br />
Personnel skilled in GIS Yes Public Works Engineering<br />
and Community<br />
Development<br />
Full Time Building Official Yes Public Works<br />
Floodplain Manager Yes Public Works Engineering<br />
Emergency Manager Yes Fire Department<br />
Johnson County AIMS<br />
2.27
Personnel Resources Yes/No Department/Position Comments<br />
Grant Writer<br />
No<br />
Warning System/Services<br />
(Reverse 9-11, cable<br />
override, outdoor warning<br />
signals)<br />
Yes<br />
Police Department & Fire<br />
Department<br />
Outdoor Warning Sirens,<br />
Neighborhood Alert<br />
Telephone System, City<br />
Website<br />
Reverse 9-11 Yes Police Department This system is provided by<br />
<strong>the</strong> Prairie Village P.D.<br />
Financial tools or resources that <strong>the</strong> City can use to help fund mitigation initiatives include <strong>the</strong><br />
following:<br />
• Capital Improvements Project Funding<br />
• Johnson County Stormwater Management Program<br />
• Taxes for Specific Purposes<br />
• Impact Fees for New Development<br />
• Debt through General Obligation Bonds<br />
Existing Plans and Policies<br />
The City of Leawood joined <strong>the</strong> NFIP program on 09/30/1977. It also has <strong>the</strong> following plans<br />
and policies in place.<br />
• Master Plan<br />
• Zoning Ordinance<br />
• Subdivision Regulations<br />
• Floodplain Ordinance<br />
• Capital Improvements Program<br />
• Building Code<br />
• Local Emergency Operations Plan<br />
• Site Plan Review Requirements<br />
• Capital Improvements Plan<br />
O<strong>the</strong>r Mitigation Activities<br />
None reported<br />
Property Valuation<br />
Table 2.16 below depicts <strong>the</strong> appraised values from <strong>the</strong> 2013 Abstract of Appraised and<br />
Assessed Values report.<br />
2.28
Table 2.16. Appraised Property Valuation, 2013<br />
Appraised Property Valuation<br />
Building Type Real Estate Structures ($) Median Home Value<br />
(2011)($)<br />
Residential 3,765,503,340 388,400<br />
Agricultural 819,630<br />
Commercial/Industrial 492,164,230<br />
Not for Profit 2,134,580<br />
Total $4,260,621,780<br />
Source: Johnson County Assessor Office/U.S. Census Bureau<br />
City of Lenexa<br />
In 1854, <strong>the</strong> members of <strong>the</strong><br />
Shawnee Tribe owned <strong>the</strong> site<br />
which would become Lenexa. It<br />
remained tribal land until after <strong>the</strong><br />
Civil War when <strong>the</strong> Shawnee<br />
wanted to sell <strong>the</strong>ir land and<br />
move to <strong>the</strong> Oklahoma Indian<br />
Territories. Then many easterners and Europeans settled <strong>the</strong> area and spinach became one of<br />
<strong>the</strong>ir primary crops. Lenexa is operated by a mayor and 9 member city council. Departments<br />
within <strong>the</strong> City government are: Community Development, Courts, Code Enforcement, Fire,<br />
Licensing, Parks, Police, and Public Works.<br />
Land Use and Development Trends<br />
According to <strong>the</strong> U.S. Census Bureau, in 2010 Lenexa’s population was 48,190, an increase of<br />
7,952 people since 2000. Land area is 34.4 square miles giving Lenexa a population density of<br />
1,401 people per square mile. The increase in population has resulted in new development,<br />
including streets, sewers, and o<strong>the</strong>r utilities.<br />
Technical and Fiscal Resources<br />
The Emergency Manager for Lenexa is <strong>the</strong> Fire Chief, and floodplain manager responsibilities<br />
belong to <strong>the</strong> Public Works Department. The City has a grant writer and GIS resource under<br />
<strong>the</strong> Department of Administration. Table 2.14 shows <strong>the</strong> staff and technical resources in more<br />
detail.<br />
Table 2.14. City of Lenexa Personnel Resources and Warning Systems<br />
Personnel Resources Yes/No Department/Position<br />
Planner/Engineer with knowledge of land<br />
Yes<br />
Community Development Director<br />
development/land management practices<br />
2.29
Personnel Resources Yes/No Department/Position<br />
Engineer/Professional trained in<br />
construction practices related to buildings<br />
and/or infrastructure<br />
Planner/Engineer/Scientist with an<br />
understanding of natural hazards<br />
Yes<br />
Yes<br />
Public Works/City Engineer and/or<br />
Community Development Engineering<br />
Administrator<br />
Public Works/City Engineer<br />
GIS personnel Yes Administrations/GIS Manager<br />
Building Official, full time Yes Community Development/Building Code<br />
Administrator<br />
Floodplain Manager Yes Public Works/Stormwater Engineer<br />
Emergency Manager Yes Fire/Fire Chief<br />
Grant Writer Yes All Departments/Various<br />
Warning Systems/Services (Reverse 9-<br />
11, cable override, outdoor warning<br />
signals)<br />
Yes<br />
Police Department/Communications<br />
Financial tools or resources that <strong>the</strong> City can use to help fund mitigation initiatives include <strong>the</strong><br />
following.<br />
• Community Development Block Grants<br />
• Capital Improvements project funding<br />
• Johnson county Stormwater Management Program<br />
• Taxes for Specific Purposes<br />
• Impact fees for New Development<br />
• Debt through General Obligation Bonds<br />
• Debt through Special Tax Bonds<br />
• Debt through Private Activities<br />
Existing Plans and Policies<br />
Lenexa joined <strong>the</strong> NFIP on 08/01/1977. The city has <strong>the</strong> following plans and policies in place.<br />
• Master Plan<br />
• Zoning Ordinances<br />
• Subdivision Ordinances<br />
• Growth Management Ordinance<br />
• Floodplain Ordinance<br />
• Capital Improvements Plan<br />
• Building code<br />
• Site Plan Review Requirements<br />
• Capital Improvements Plan<br />
• Local Emergency Operations Plan<br />
• Vision 2030<br />
2.30
O<strong>the</strong>r Mitigation Activities<br />
The City of Lenexa has continued with <strong>the</strong>ir ongoing Public Education and information programs<br />
since <strong>the</strong> last plan. This includes Fire Prevention, Rain-to-Recreation, Storm Water Run Off<br />
Education, and Emergency Preparedness Education. They have also completed hazard<br />
mitigation flood buyouts as follows:<br />
Whispering Hills Buyout<br />
6/12/01, 20706 Mill Road closing; $260,096.12 5/07/01, 20702 Mill Road closing; $238,008.97<br />
4/30/01, 20610 Mill Road closing; $223,176.04<br />
Clare Road Buyout<br />
4/27/01, 8401 Clare Road closing; $128,170.96<br />
Pennycross ( 9/11/01-Overfield Property Closing; $150,341.89 9/24/01-Stultz Property Closing;<br />
$142,246.32 10/15/01-Nutt Property Closing; $140,338.30 11/30/01 - Eggerman Property<br />
Closing; $139,483.74.<br />
Property Valuation<br />
Table 2.17 below depicts <strong>the</strong> appraised values from <strong>the</strong> 2013 Abstract of Appraised and<br />
Assessed Values report.<br />
Table 2.17. Appraised Property Valuation, 2013<br />
Appraised Property Valuation<br />
Building Type Real Estate Structures ($) Median Home Value<br />
(2011)($)<br />
Residential 2,780,219,253 216,900<br />
Agricultural 13,081,140<br />
Commercial/Industrial 1,133,232,251<br />
Not for Profit 270,860<br />
Total $3,926,803,504<br />
Source: Johnson County Assessor Office/U.S. Census Bureau<br />
City of Merriam<br />
Merriam was incorporated as a city of <strong>the</strong> third class in<br />
October 1950 and established status as a<br />
city of <strong>the</strong> second class in January 1957. The City is<br />
located in nor<strong>the</strong>astern Johnson County and <strong>the</strong> city is<br />
bisected by Interstate-35.<br />
The city of Merriam has an elected Mayor, a City<br />
2.31
Administer, as well as eight city council members from <strong>the</strong> four wards in Merriam. City<br />
Departments are Administration/Finance, Community Development, Fire Department, Municipal<br />
Court, Parks & Recreation, Police Department, and Public Works Department. As a part of<br />
<strong>the</strong>se departments <strong>the</strong>y have filled positions of building code official, building inspector,<br />
engineer, development planner, public works official, emergency management coordinator, and<br />
an NFIP floodplain administrator.<br />
Land Use and Development Trends<br />
In 2010, <strong>the</strong> population of Merriam was 11,003, which reflects a loss of 3 people since <strong>the</strong> 2000<br />
census. The land area of <strong>the</strong> city is 4.32 square miles, which makes for a population density of<br />
2,547 people per square mile.<br />
The City of Merriam is land-locked which restricts <strong>the</strong>ir development trends, however, <strong>the</strong>re is<br />
projected development on W 67 th Street and Interstate 35 for retail and auto dealerships in<br />
Merriam Point, and at Merriam Village at <strong>the</strong> intersection of Johnson Drive and Interstate 35,<br />
<strong>the</strong>re are plans for construction to house IKEA, and o<strong>the</strong>r retail and restaurants.<br />
Technical and Fiscal Resources<br />
Funding opportunities for <strong>the</strong> City of Merriam to fund mitigation activities are as follows.<br />
• Community Development Block Grants<br />
• Capital Improvements Funding<br />
• Taxes for Specific Purposes<br />
• Debt through General Obligation Bonds<br />
Existing Plans and Policies<br />
The City of Merriam has been a participant in <strong>the</strong> NFIP since 05/15/1978. O<strong>the</strong>r plans and<br />
policies include <strong>the</strong> following.<br />
• Comprehensive Plan<br />
• Capital Improvement Plan<br />
• City Emergency Operations Plan<br />
• Economic Development Plan<br />
• Transportation Plan<br />
• Land-use Plan<br />
O<strong>the</strong>r Mitigation Activities<br />
The City of Merriam has enacted <strong>the</strong> Project Impact, for <strong>the</strong> NFIP program, as well as a public<br />
education/information program geared toward area 5 th graders called Aerial Andy.<br />
Property Valuation<br />
Table 2.18 below depicts <strong>the</strong> appraised values from <strong>the</strong> 2013 Abstract of Appraised and<br />
Assessed Values report.<br />
2.32
Table 2.18. Appraised Property Valuation, 2013<br />
Appraised Property Valuation<br />
Building Type Real Estate Structures ($) Median Home Value<br />
(2011)($)<br />
Residential 412,413,898 157,500<br />
Agricultural 80,290<br />
Commercial/Industrial 212,777,942<br />
Not for Profit 344,330<br />
Total $625,616,460<br />
Source: Johnson County Assessor Office/U.S. Census Bureau<br />
City of Mission<br />
The City was once a stopping point for many settlers<br />
traveling west via <strong>the</strong> Santa Fe Trail. The area had a<br />
valuable resource to many settlers – clear blue water in freeflowing<br />
springs.<br />
Today, <strong>the</strong> City of Mission, located in nor<strong>the</strong>astern Johnson<br />
County, is mainly a suburban area of <strong>the</strong> Kansas City<br />
metropolitan area. One notable benefit to Mission is its<br />
access to Interstate-35 which is a major transportation corridor.<br />
Mission operates under a Mayor-Council form of government with an appointed City<br />
Administrator, City Treasurer, City Attorney, and Municipal Judge. Departments include<br />
Administration, Animal Control, Community Development, Municipal Court, Neighboring<br />
Services, Parks & Recreation, Police Department and Public Works. Consolidated Fire District<br />
No.2 provides fire protection services for <strong>the</strong> City.<br />
Land Use and Development Trends<br />
In 2010, <strong>the</strong> Census Bureau put <strong>the</strong> population in <strong>the</strong> City of Mission at 9,323 which is a loss of<br />
404 people since <strong>the</strong> census of 2000. Land area of <strong>the</strong> city is 2.53 square miles, giving <strong>the</strong> City<br />
a population density of 3,685 people per square mile. Because of <strong>the</strong> density of <strong>the</strong> population,<br />
<strong>the</strong>re is little land available in which to construct new homes or developments.<br />
Technical and Fiscal Resources<br />
The city of Mission has a planner, floodplain manager, and emergency manager. O<strong>the</strong>r<br />
technical resources include personnel skilled in a land development, construction practices,<br />
GIS, and a grant writer. Mission has an outdoor siren warning system. Financial tools or<br />
resources that <strong>the</strong> City can potentially use to help fund mitigation activities include <strong>the</strong> following:<br />
• Community Development Block Grants<br />
2.33
• Capital Improvements Project Funding<br />
• Johnson County Stormwater Management Program<br />
• Taxes for specific Purposes<br />
• Fees for water or sewer<br />
• Impact Fees for New Development<br />
• Debt through General Obligation Bonds<br />
• Debt through Special Tax Bonds<br />
• Withholding spending in Hazard Prone Areas<br />
Existing Plans and Policies<br />
The City of Mission has participated in <strong>the</strong> NFIP since 05/15/1978. The following plans and<br />
policies are also utilized in Mission:<br />
• Master Plan<br />
• Storm water Management Program<br />
• Comprehensive Plan<br />
• Local Emergency Management Plan<br />
• Zoning Regulations<br />
• Subdivision Regulations<br />
• Floodplain Ordinance<br />
• Capital Improvements Program<br />
• Building Code<br />
• Site Plan Review Requirements<br />
• Capital Improvements Plan<br />
O<strong>the</strong>r Mitigation Activities<br />
In 2011 a large generator was added to <strong>the</strong> Sylvester Powell Jr. Community Center, via a DHS<br />
Grant through MARC, to incorporate <strong>the</strong> center as a full service safe room.<br />
Property Valuation<br />
Table 2.19 below depicts <strong>the</strong> appraised values from <strong>the</strong> 2013 Abstract of Appraised and<br />
Assessed Values report.<br />
Table 2.19. Appraised Property Valuation, 2013<br />
Appraised Property Valuation<br />
Building Type Real Estate Structures ($) Median Home Value<br />
(2011)($)<br />
Residential 425,202,880 164,800<br />
Agricultural 0<br />
Commercial/Industrial 122,773,890<br />
Not for Profit 0<br />
Total $547,976,770<br />
Source: Johnson County Assessor Office/U.S. Census Bureau<br />
2.34
City of Mission Hills<br />
Mission Hills is located in nor<strong>the</strong>astern Johnson<br />
County and is known for <strong>the</strong>ir many county club<br />
golf courses. The City is surrounded by Mission<br />
Woods, Fairway, Prairie Village, and Kansas<br />
City, Missouri. It has maintained its original plan<br />
conceived in <strong>the</strong> early 1900s of being a garden<br />
community.<br />
Mission Hills elects a Mayor and five citizens to <strong>the</strong><br />
City Council. An appointed City Administrator is responsible for <strong>the</strong> City as <strong>the</strong> chief<br />
administrative officer. Consolidated<br />
Fire District No.2 provides fire protection services for <strong>the</strong> City.<br />
Land Use and Development Trends<br />
In 2010, <strong>the</strong> population of Mission Hills was 3,498, a decrease of 95 people since <strong>the</strong> 2000<br />
census. Land area of <strong>the</strong> city is 2.02 square miles, and <strong>the</strong> population density is 1,732 people<br />
per square mile.<br />
The City of Mission Hills is landlocked and completely built out for future developments of any<br />
kind. However, <strong>the</strong> City does have plans to build a garage and public restroom on City Hall<br />
property.<br />
Technical and Fiscal Resources<br />
Police protection is offered by <strong>the</strong> City of Prairie Village Police Department and fire protection is<br />
provided by Johnson County Consolidated Fire District No. 2. Mission Hills, in conjunction with<br />
Prairie Village, has an ultra high speed telephone communications service for emergency<br />
notifications called Code RED. This is used to alert residents of emergency or life-threatening<br />
situations and public safety issues.<br />
Financial tools and resources that could potentially help Mission Hills fund mitigation initiatives<br />
is as follows.<br />
• Capital Improvements Funding<br />
• Taxes for Specific Purposes<br />
• Fees for water, sewer, gas, or electric services<br />
• Impact fees for new development<br />
• Debt through General Obligation Bonds<br />
• Debt through Special Tax Bonds<br />
• Debt through Private Activities<br />
• Withhold spending in hazard prone areas<br />
2.35
Existing Plans and Policies<br />
The City of Mission Hills joined <strong>the</strong> NFIP in 9/29/1979. It also has <strong>the</strong> following plans and<br />
policies in place.<br />
• Comprehensive Plan<br />
• Capital Improvement Plan<br />
• City Emergency Operations Plan<br />
• County Emergency Operations plan<br />
• Local Recovery Plan (in EOP)<br />
• Zoning Ordinance<br />
• Building Code<br />
• Floodplain Ordinance<br />
• Site Plan Review Requirements<br />
• Tree Trimming Ordinance<br />
• Storm Water Ordinance<br />
• Drainage Ordinance<br />
• Wetlands/Riparian Areas Conservation Plan<br />
O<strong>the</strong>r Mitigation Activities<br />
Since <strong>the</strong> last plan, <strong>the</strong> identified project to reduce flooding on <strong>the</strong> roadway in Peetwood Park<br />
has been completed. The City also removed City Hall and a church from a flooding area<br />
through <strong>the</strong> Mission Drive Channel Project (2012). The City also has a public education program<br />
in place to educate <strong>the</strong> public on hazards. On <strong>the</strong>ir Capital Improvement Plan for 2013, <strong>the</strong>y<br />
have identified various projects to fix catchbasins, pipes, etc., in order to facilitate <strong>the</strong> mitigation<br />
of flooding.<br />
Property Valuation<br />
Table 2.20 below depicts <strong>the</strong> appraised values from <strong>the</strong> 2013 Abstract of Appraised and<br />
Assessed Values report.<br />
Table 2.20. Appraised Property Valuation, 2013<br />
Appraised Property Valuation<br />
Building Type Real Estate Structures ($) Median Home Value<br />
(2011)($)<br />
Residential 607,110,170 Not Available<br />
Agricultural 0<br />
Commercial/Industrial 11,665,730<br />
Not for Profit 969,580<br />
Total $619,745,480<br />
Source: Johnson County Assessor Office/U.S. Census Bureau<br />
2.36
City of Mission Woods<br />
This small residential community is completely landlock<br />
in Nor<strong>the</strong>astern Johnson County. T<strong>here</strong> are no<br />
city buildings and all resources are provided by <strong>the</strong><br />
City of Westwood and Consolidated Fire District No.2<br />
provides fire protection services for <strong>the</strong> City.<br />
Land Use and Development Trends<br />
In 2010, <strong>the</strong> population of Mission Woods was 178<br />
people, which is an increase of 13 people since <strong>the</strong><br />
2000 census. Land area is .11 square miles, which<br />
makes <strong>the</strong> population density 1618 people per square mile.<br />
Technical and Fiscal Resources<br />
The technical resources are provided by <strong>the</strong> City of Westwood.<br />
The financial tools available to <strong>the</strong> City of Mission Wood to potentially fund mitigation activities is<br />
as follows:<br />
• Community Development Block Grants<br />
• Johnson county Stormwater Management program<br />
• Taxes for Specific Purposes<br />
• Debt through General Obligation Bonds<br />
• Debt through special Tax Bonds<br />
• Withholding spending in hazard prone areas.<br />
Existing Plans and Policies<br />
Mission Woods adopts <strong>the</strong> plans and policies that Westwood has in place.<br />
• Comprehensive Plan<br />
• Zoning Regulations<br />
• Floodplain Ordinance<br />
• Stormwater Ordinance<br />
• Capital Improvements Program<br />
• Building Code<br />
• Emergency Operations Plan<br />
O<strong>the</strong>r Mitigation Activities<br />
None to report since last plan update.<br />
2.37
Property Valuation<br />
Table 2.22 below depicts <strong>the</strong> appraised values from <strong>the</strong> 2013 Abstract of Appraised and<br />
Assessed Values report.<br />
Table 2.21. Appraised Property Valuation, 2013<br />
Appraised Property Valuation<br />
Building Type Real Estate Structures ($) Median Home Value<br />
(2011)($)<br />
Residential 15,909,630 Not Available<br />
Agricultural 0<br />
Commercial/Industrial 6,614,980<br />
Not for Profit<br />
Total $22,524,610<br />
Source: Johnson County Assessor Office/U.S. Census Bureau<br />
City of Ola<strong>the</strong><br />
Ola<strong>the</strong> is located in <strong>the</strong> middle of Johnson County and is<br />
<strong>the</strong> County seat. The City was <strong>found</strong>ed in 1857. The<br />
name “Ola<strong>the</strong>” is derived from <strong>the</strong> Shawnee Indian word<br />
“beautiful” because of all <strong>the</strong> wild flowers growing in <strong>the</strong><br />
area.<br />
Ola<strong>the</strong> voters selected a modified mayor-councilmanager<br />
form of government. The 7 member City<br />
Council hires <strong>the</strong> city manager who is responsible for<br />
administering <strong>the</strong> city business. City Departments<br />
are City Clerk, City Council, Development Services, Fire, GIS/Maps, Human Resources, Legal,<br />
Municipal Court, Municipal Services, Parks & Recreation, Police, Public Works, and Strategic<br />
Financial Management.<br />
T<strong>here</strong> are several major highways that crisscross <strong>the</strong> City including Interstate-35 (which divides<br />
<strong>the</strong> City), K-10, K-7, and K-150 (locally known as Santa Fe Drive). For outdoor enjoyment, <strong>the</strong><br />
City has two large public lakes, Lake Ola<strong>the</strong> and Cedar Lake, and smaller lakes at Waterworks<br />
Park and Southlake Park.<br />
Land Use and Development Trends<br />
In 2010, <strong>the</strong> population of Ola<strong>the</strong> was 125,872, and increase of 24,292 people since <strong>the</strong> census<br />
of 2000. The land area of Ola<strong>the</strong> is 54.16 square miles, and <strong>the</strong> population density is 2,324<br />
people per square mile. Ola<strong>the</strong> is a quickly growing city and housing developments, building<br />
and shopping developments are on <strong>the</strong> rise. Johnson County has an intense screening<br />
program before any new development can be done, to include ensuring <strong>the</strong> floodplain is<br />
protected.<br />
2.38
Technical and Fiscal Resources<br />
The Fire Chief serves as Ola<strong>the</strong>’s Emergency Manager and floodplain manager duties are<br />
handled by <strong>the</strong> Public Works Department. The City does have a GIS manager that maintains<br />
<strong>the</strong>ir GIS data.<br />
Table 2.16. City of Ola<strong>the</strong> Personnel Resources and Warning Systems<br />
Personnel Resources Yes/No Department/Position Comments<br />
Building Code Official and<br />
Inspector<br />
Yes<br />
Chief building Official<br />
Development Srv-Coces<br />
GIS Yes GIS Manager ITS<br />
Engineers Yes Asst Director Development<br />
Srv-Planning; Engineer<br />
Development coord. Public<br />
Works<br />
Development Planner Yes Engineer Development<br />
Coord. Public Works<br />
Public Works Official<br />
Public Works<br />
Emergency Mgmt Coord Yes Fire Administration<br />
NFIP Floodplain Mgr Yes Design Engineer Public<br />
Works<br />
Hazardous Material Yes<br />
Experts<br />
Warning Systems/Services<br />
(Reverse 9-11, cable<br />
override, outdoor warning<br />
signals)<br />
Yes<br />
CityWatch Notification<br />
System, called OCEANS.<br />
34 outdoor warning<br />
signals.<br />
Financial tools or resources that <strong>the</strong> City can potentially use to help fund mitigation activities<br />
include <strong>the</strong> following:<br />
• Community Development Block Grants<br />
• Capital Improvements Funding<br />
• Taxes for Specific Purposes<br />
• Fees for water, sewer, gas, or electric services<br />
• Impact Fees for New Development<br />
• Debt through General Obligation Bonds<br />
• Debt through special Tax Bonds<br />
• Withhold spending in hazard prone areas<br />
Existing Plans and Policies<br />
Ola<strong>the</strong> became a member in good standing of <strong>the</strong> NFIP on 11/15/1978 and is also a participant<br />
of <strong>the</strong> Community Rating System (CRS). Ola<strong>the</strong> has <strong>the</strong> following plans and policies in place.<br />
• Comprehensive Plan<br />
• Capital Improvement Plan<br />
• City Emergency Operations Plan<br />
• County Emergency Operations Plan<br />
2.39
• Local Recovery Plan<br />
• County Recovery Plan<br />
• Debris Management Plan<br />
• Economic Development Plan<br />
• Transportation Plan<br />
• Land-use Plan<br />
• Flood Mitigation Assistance Plan<br />
• Watershed Plan<br />
• Critical Facilities Plan<br />
O<strong>the</strong>r Mitigation Activities<br />
The City of Ola<strong>the</strong> has an extensive history of mitigation activities that are completed and ongoing.<br />
The following includes:<br />
• A plant berm was elevated and extended as part of <strong>the</strong> Cedar Creek WWTP Expansion.<br />
This mitigated flooding of wastewater treatment plant which is now protected above <strong>the</strong><br />
100 year flood.<br />
• A current project that is on-going is along<strong>the</strong> creek at 147 th & Brougham to reduce road<br />
overtopping for safe vehicle access, and to reduce <strong>the</strong> risk of flooding for multiple<br />
homes.<br />
• A projected project is <strong>the</strong> E. Mulberry Street and N. Cherry Street Storm Drainage<br />
Improvements, which is designed to reduce <strong>the</strong> risk of home and street flooding in <strong>the</strong><br />
vicinity of E. Mulberry Street and N. Cherry Street. This project will include road culvert<br />
improvements, two home buy outs, and channel stabilization.<br />
• The City of Ola<strong>the</strong> is pro-active when it comes to flood control issues, and has numerous<br />
projects on <strong>the</strong>ir Capital Improvement Plan.<br />
Property Valuation<br />
Table 2.23 below depicts <strong>the</strong> appraised values from <strong>the</strong> 2013 Abstract of Appraised and<br />
Assessed Values report.<br />
Table 2.23. Appraised Property Valuation, 2013<br />
Appraised Property Valuation<br />
Building Type Real Estate Structures ($) Median Home Value<br />
(2011)($)<br />
Residential 5,949,677,230 194,600<br />
Agricultural 5,251,460<br />
Commercial/Industrial 858,348,620<br />
Not for Profit 1,547,040<br />
Total $6,814,824,350<br />
Source: Johnson County Assessor Office/U.S. Census Bureau<br />
2.40
City of Overland Park<br />
Overland Park was incorporated as a city of <strong>the</strong> firstclass<br />
in 1960. It is located in <strong>the</strong> southwest<br />
quadrant of <strong>the</strong> Kansas City Metropolitan area.<br />
Overland Park operates under a Mayor, City<br />
Manager, and 12 elected council representatives.<br />
Land Use and Development Trends<br />
Overland Park had a population of 173,372 people<br />
as of <strong>the</strong> 2010 census. This is an increase of 24,292<br />
people since <strong>the</strong> 2000 census was taken. The land area of <strong>the</strong> city is 56.75 square miles, with a<br />
population density of 3,055 people per square mile. Construction and development are ongoing<br />
for Overland Park, in order to provide housing, business, and facilities for its growing population.<br />
The major areas for future growth and development in Overland Park are in <strong>the</strong> sou<strong>the</strong>rn<br />
portions of <strong>the</strong> city, especially south of 151 st Street. Redevelopment is also anticipated,<br />
especially along <strong>the</strong> Metcalf corridor north of 123 rd Street.<br />
The Overland Park Fire Station 45 is planned for demolition and reconstruction at a new<br />
location which is to be determined.<br />
Technical and Fiscal Resources<br />
The City of Overland Park has an experienced staff in building safety, engineering services,<br />
GIS, and zoning enforcement.<br />
Table 2.17. City of Overland Park Personnel Resources and Warning Systems<br />
Personnel Resources Yes/No Department/Position Comments<br />
Building code Official Yes Code Administrator Title Certified building Official<br />
by ICC<br />
Building Inspector Yes Planning and<br />
Development<br />
GIS Yes Planning and<br />
Development<br />
Engineer Yes Planning and<br />
Development<br />
Development Planner Yes Planning and<br />
Development<br />
Public Works Official Yes Public Works Dept.<br />
Emergency Management<br />
Coordinator<br />
NFIP Floodplain<br />
Administrator<br />
Yes<br />
Yes<br />
Emergency Management<br />
Administrator/Homeland<br />
Security<br />
Planning and<br />
Development Services<br />
Emergency Response Yes Multiple Agencies<br />
13 combination Plans<br />
examiners and Building<br />
Inspectors<br />
Also holds a Certified<br />
Flood Plain Manageer<br />
(CFM) certification. The<br />
City has 4 CFM’s on staff.<br />
2.41
Team<br />
Hazardous Materials<br />
Expert<br />
Yes Fire Department Fire Department<br />
Technician Level Haz-Mat<br />
Team<br />
LEPC Yes Mid-America LEPC<br />
Economic Development Yes<br />
Chamber of Commerce<br />
Department<br />
Transportation and<br />
Housing Departments<br />
Yes<br />
County<br />
Financial Tools or resources that <strong>the</strong> city could potentially use to help fund mitigation activities<br />
include <strong>the</strong> following:<br />
• Community Development Block Grant<br />
• Capital Improvements Funding<br />
• Taxes for specific Purposes<br />
• Impact Fees for New Development<br />
• Debt through General Obligation Bonds<br />
• Debt through Special Tax Bonds<br />
Existing Plans and Policies<br />
The City joined <strong>the</strong> NFIP on 09/30/1977. They have <strong>the</strong> following plans and policies in place:<br />
• Comprehensive Plan<br />
• Capital Improvement Plan<br />
• City Emergency Operations Plan<br />
• County Emergency Operations Plan<br />
• Local Recovery Plan<br />
• County Recovery Plan<br />
• Debris Management Plan<br />
• Economic Development Plan<br />
• Transportation Plan<br />
• Land-use Plan<br />
• Firewise or o<strong>the</strong>r Fire Mitigation Plan<br />
• Critical Facilities Plan<br />
O<strong>the</strong>r Mitigation Activities<br />
The City of Overland Park has a plethora of public education and information programs that are<br />
ongoing. These include: Juvenile Fire-Setters Program School Career Day Presentations, Fire<br />
Safety for Special Needs Community Program, FD Fund Day for special Needs Children,<br />
Explorer Program, Capt Inferno Program, Water quality and environmental education programs.<br />
The City also has provisions in <strong>the</strong> Floodplain Ordinance requiring 500 year flood protection for<br />
any new critical facilities including access routes to such facilities. As part of <strong>the</strong>ir participation<br />
in <strong>the</strong> CRS program <strong>the</strong>y have completed and perform annual <strong>review</strong>s to a Repetitive Flood<br />
Loss Area Analysis (RLLA) which <strong>review</strong>s progress towards reducing or eliminating risks to<br />
properties with repetitive losses. The City is in <strong>the</strong> process of purchasing one of <strong>the</strong> repetitive<br />
2.42
loss properties in <strong>the</strong>ir jurisdiction to construct a flood control project in <strong>the</strong> vicinity of 103 rd and<br />
Rosewood. This acquisition should be completed by <strong>the</strong> middle of 2013.<br />
Property Valuation<br />
Table 2.24 below depicts <strong>the</strong> appraised values from <strong>the</strong> 2013 Abstract of Appraised and<br />
Assessed Values report.<br />
Table 2.24. Appraised Property Valuation, 2013<br />
Appraised Property Valuation<br />
Building Type Real Estate Structures ($) Median Home Value<br />
(2011)($)<br />
Residential 11,177,465,740 224,200<br />
Agricultural 33,345,640<br />
Commercial/Industrial 2,643,031,072<br />
Not for Profit 12,018,950<br />
Total $13,865,861,402<br />
Source: Johnson County Assessor Office/U.S. Census Bureau<br />
City of Prairie Village<br />
Prairie Village became a city of <strong>the</strong> first class in 1957. It was <strong>the</strong><br />
vision of <strong>the</strong> late J.C. Nichols to create a planned community of<br />
beautiful homes and shopping centers. Prairie Village is a<br />
land-locked, fully developed suburban city in nor<strong>the</strong>astern Johnson<br />
County.<br />
Prairie Village operates under <strong>the</strong> Mayor and 12 city council<br />
members form of government. The City Departments provide<br />
services in Management, Planning and Administrative Services,<br />
Public Works, Public Safety, Municipal Justice, Parks and<br />
Recreation, and Community Programs. The Prairie Village Police<br />
Department provides police protection services for Prairie Village<br />
and Mission Hills. Fire protection is provided by Consolidated Fire<br />
District No. 2<br />
Land Use and Development Trends<br />
According <strong>the</strong> 2010 census, <strong>the</strong> City of Prairie Village has a population of 21,447 people, a loss<br />
of 625 people since <strong>the</strong> 2000 census. The land area is 6.7 square miles, and <strong>the</strong> population<br />
density is 3,201 people per square mile. The population is stagnant, making development a low<br />
concern.<br />
2.43
Technical and Fiscal Resources<br />
Tools and resources that <strong>the</strong> City can use to help fund mitigation activities include <strong>the</strong> following:<br />
• Community Development Block Grants<br />
• Capital Improvements Funding<br />
• Taxes for Specific Purposes<br />
Existing Plans and Policies<br />
• Capital Improvement Plan<br />
• City Emergency Operations Plan<br />
• Debris Management Plan<br />
• Zoning Ordinance<br />
• Building Code<br />
• Storm Water Ordinance<br />
• Site Plan Review Requirements<br />
O<strong>the</strong>r Mitigation Activities<br />
In 2011, <strong>the</strong> City of Prairie Village submitted an application, and was approved for two warning<br />
sirens. The funding was from <strong>the</strong> HMGP through FEMA.<br />
Property Valuation<br />
Table 2.25 below depicts <strong>the</strong> appraised values from <strong>the</strong> 2013 Abstract of Appraised and<br />
Assessed Values report.<br />
Table 2.25. Appraised Property Valuation, 2013<br />
Appraised Property Valuation<br />
Building Type Real Estate Structures ($) Median Home Value<br />
(2011)($)<br />
Residential 1,518,001,790 207,600<br />
Agricultural 2,613,500<br />
Commercial/Industrial 89,546,850<br />
Not for Profit 118,280<br />
Total $1,610,280,420<br />
Source: Johnson County Assessor Office/U.S. Census Bureau<br />
2.44
City of Roeland Park<br />
The City of Roeland Park was originally named after<br />
John Roe, an immigrant that settled in <strong>the</strong> area.<br />
Roeland Park is in <strong>the</strong> nor<strong>the</strong>astern part of <strong>the</strong><br />
County. The boundaries are 47th Street or<br />
County Line Road on <strong>the</strong> north, 53rd Street or<br />
Johnson Drive on <strong>the</strong> south, Mission Road on <strong>the</strong><br />
east and Nall Avenue on <strong>the</strong> west.<br />
Roeland Park has a mayor/city council form of<br />
government. The City Administrator is<br />
responsible for <strong>the</strong> daily operations of <strong>the</strong> City.<br />
Departments include: Administration,<br />
Building/Codes, Forestry, Municipal Court, Police Department, and Public Works. Consolidated<br />
Fire District No.2 provides fire protection services for <strong>the</strong> City.<br />
Land Use and Development Trends<br />
In 2010, <strong>the</strong> population of Roeland Park was 6,731, a decrease of 86 people from <strong>the</strong> census of<br />
2000. The land area is 1.62 square miles, and <strong>the</strong> population density is 4,154 people per<br />
square mile. The City is landlocked by <strong>the</strong> surrounding jurisdictions of Kansas City, KS,<br />
Westwood, Fairway, and Mission.<br />
Technical and Fiscal Resources<br />
The city of Roeland Park is a combination of local staff and contracted out staff. Following is a<br />
Table of <strong>the</strong> details for <strong>the</strong> staff and resources for <strong>the</strong> city:<br />
Table 2.18. City of Roeland Park Personnel Resources and Warning Systems<br />
Personnel Resources Yes/No Department/Position Comments<br />
Planner/Engineer with Yes<br />
Administration/City NA<br />
knowledge of land<br />
development/land<br />
management practices<br />
Administrator<br />
Engineer/Professional<br />
trained in construction<br />
practices related to<br />
buildings and/or<br />
infrastructure<br />
Yes Contract Engineer NA<br />
No<br />
Planner/Engineer/Scientist<br />
with an<br />
understanding of natural<br />
hazards<br />
GIS No NA<br />
Full Time Building Official Yes Administration/Building NA<br />
Inspector<br />
Floodplain Manager No NA<br />
Emergency Manager Yes Police/Chief of Police NA<br />
NA<br />
2.45
Personnel Resources Yes/No Department/Position Comments<br />
Grant Writer No NA<br />
Warning Systems<br />
(Reverse 9-11, cable<br />
override, outdoor warning<br />
signals)<br />
Yes<br />
Outdoor Warning (911 with<br />
Johnson County)<br />
NA<br />
Financial tools or resources that <strong>the</strong> city could potentially use to help fund mitigation activities<br />
include <strong>the</strong> following:<br />
• Community Development Block Grants<br />
• Capital Improvements Project Funding<br />
• Johnson County Stormwater Management Program<br />
• Taxes for specific Purposes<br />
• Debt through General Obligation Bonds<br />
• Debt through Special Tax Bonds<br />
• Withholding spending in hazard prone areas<br />
Existing Plans and Policies<br />
Roeland Park participates in <strong>the</strong> NFIP since 06/30/1976. Roeland Park has <strong>the</strong> following plans<br />
and policies in place.<br />
• Comprehensive Plan<br />
• Zoning Regulations<br />
• Subdivision Regulations<br />
• Floodplain Ordinance<br />
• Capital Improvements program<br />
• Building Code<br />
• Site Plan Review Requirements<br />
• Capital Improvements Plan<br />
O<strong>the</strong>r Mitigation Activities<br />
No information available<br />
Property Valuation<br />
Table 2.26 below depicts <strong>the</strong> appraised values from <strong>the</strong> 2013 Abstract of Appraised and<br />
Assessed Values report.<br />
2.46
Table 2.26. Appraised Property Valuation, 2013<br />
Appraised Property Valuation<br />
Building Type Real Estate Structures ($) Median Home Value<br />
(2011)($)<br />
Residential 310,135,520 158,200<br />
Agricultural 0<br />
Commercial/Industrial 19,900,220<br />
Not for Profit 74,480<br />
Total $330,110,220<br />
Source: Johnson County Assessor Office/U.S. Census Bureau<br />
City of Shawnee<br />
Shawnee is located in nor<strong>the</strong>rn Johnson County<br />
surrounded by Kansas City, Kansas, Merriam,<br />
Lenexa, and De Soto. Shawnee has a part time<br />
mayor/City Manager, and a city council form of<br />
government. The City Administrator is responsible for<br />
<strong>the</strong> daily operations of <strong>the</strong> City. City departments are<br />
City Clerk, Codes, Development Services/Engineering,<br />
Finance, Fire, Government/City Manager, Human<br />
Resources, Municipal Court, Parks & Recreation,<br />
Planning, Police, Public Works, and Shawnee<br />
Town.<br />
Land Use and Development Trends<br />
According to <strong>the</strong> 2010 Census, <strong>the</strong> City of Shawnee’s population was 62,209, an increase of<br />
14,213 people since <strong>the</strong> 2000 census. Land area is 41.74 square miles, with a population<br />
density of 1,490 people per square mile.<br />
Growth over <strong>the</strong> past few years since <strong>the</strong> last plan update has been fairly stagnant due to <strong>the</strong><br />
downturn in <strong>the</strong> economy; however development has slowly picked up. The City is expected to<br />
develop in a westerly direction as far as new housing is concerned.<br />
Technical and Fiscal Resources<br />
The Floodplain Manager continues to be located in <strong>the</strong> Engineering Department and <strong>the</strong><br />
Emergency Manager is <strong>the</strong> Fire chief. The staff for all departments are knowledgeable about<br />
land development and have an understanding of natural hazards. Table 2.19 details <strong>the</strong> staff<br />
and technical resources for <strong>the</strong> City of Shawnee.<br />
2.47
Table 2.19. City of Shawnee Personnel Resources and Warning Systems<br />
Personnel Resources Yes/No Department/Position Comments<br />
Planner/Engineer with Yes<br />
Planning Dept.<br />
knowledge of land<br />
development/land<br />
management practices<br />
Engineer/Professional Yes<br />
Engineering<br />
trained in construction<br />
practices related to<br />
buildings and/or<br />
infrastructure<br />
Yes<br />
Engineering<br />
Planner/Engineer/Scientist<br />
with an<br />
understanding of natural<br />
hazards<br />
GIS Yes IT Dept/GIS Division<br />
Full Time Building Official Yes Codes Department<br />
Floodplain Manager Yes Engineering<br />
Emergency Manager Yes Fire/Fire Chief<br />
Grant Writer Yes Various Departments<br />
Warning Systems<br />
(Reverse 9-11, cable<br />
override, outdoor warning<br />
signals)<br />
Yes<br />
IT Dept/GIS Division<br />
Financial tools and resources that <strong>the</strong> City of Shawnee could use to fund mitigation initiatives:<br />
• Community Development Block Grants<br />
• Capital Improvements Project Funding<br />
• Johnson County Stormwater Management Program<br />
• Taxes for Specific Purposes<br />
• Impact Fees for New Development<br />
• Debt through General Obligation Bonds<br />
• Debt through Special Tax Bonds<br />
• Withholding spending in <strong>the</strong> hazard prone areas<br />
Existing Plans and Policies<br />
The City of Shawnee participates in <strong>the</strong> NFIP since 11/15/1978, allowing its residents to<br />
purchase flood insurance. It is also a participant in <strong>the</strong> Community Rating System. In addition,<br />
Shawnee has <strong>the</strong> following plans and policies in place:<br />
• Comprehensive Plan<br />
• Zoning Regulations<br />
• City Emergency Operations Plan<br />
• Debris Management Plan<br />
• Flood Mitigation Assistance (FMA) Plan<br />
• Critical Facilities Plan<br />
• Building code<br />
2.48
• Floodplain Ordinance<br />
• Storm Water Ordinance<br />
• Site Plan Review Requirements<br />
• Drainage Ordinance<br />
O<strong>the</strong>r Mitigation Activities<br />
The City of Shawnee has an extensive mitigation program that has earmarked various projects<br />
to help control flooding. Following are some of <strong>the</strong>se projects:<br />
Justice Center Stormwater Quality BMP Retrofit – project includes adding stormwater quality<br />
rain gardens, retention areas, bioswales, and restored native vegetation on <strong>the</strong> Justice Center<br />
Campus. The initial installation of all <strong>the</strong> Stormwater Treatment Facility units is complete and<br />
re-seeding will be complete in <strong>the</strong> spring of 2013.<br />
55 th and Earnshaw Drainage Project is to alleviate flooding of several homes and streets by<br />
replaceing inadequate and deteriorated storm waste from Monrovia and 55 th Terrace to <strong>the</strong> new<br />
sewer at 57 th and Quivira. The project will be completed in Spring 2013.<br />
Edgewood & Larsen Drainage Project Phase II is to alleviate flooding of Edgewood Blvd and to<br />
correct deteriorated pipe and an inadequate collection system. Phase II has begun and will be<br />
complete in June 2013.<br />
Property Valuation<br />
Table 2.27 below depicts <strong>the</strong> appraised values from <strong>the</strong> 2013 Abstract of Appraised and<br />
Assessed Values report.<br />
Table 2.27. Appraised Property Valuation, 2013<br />
Appraised Property Valuation<br />
Building Type Real Estate Structures ($) Median Home Value<br />
(2011)($)<br />
Residential 3,348,295,599 200,200<br />
Agricultural 28,881,250<br />
Commercial/Industrial 366,435,737<br />
Not for Profit 915,220<br />
Total $3,744,527,806<br />
Source: Johnson County Assessor Office/U.S. Census Bureau<br />
City of Spring Hill<br />
Spring Hill is located along highway 169<br />
and on both sides of sou<strong>the</strong>rn Johnson<br />
County and<br />
nor<strong>the</strong>rn Miami County. Spring Hill has<br />
2.49
a mayor/city council form of government. The City<br />
Administrator is responsible for <strong>the</strong> daily operations of <strong>the</strong> City. City departments are<br />
Administration, Animal Control, City Clerk, Community Development, Economic Development,<br />
Finance, Municipal Court, Police, Public Works, and Utilities.<br />
Land Use and Development Trends<br />
In 2010, <strong>the</strong> population of Spring Hill was 5,437 people, an increase of 2,710 since <strong>the</strong> 2000<br />
census. Land area of <strong>the</strong> City is 3.45 square miles, with a population density of 1,576 people<br />
per square mile.<br />
Technical and Fiscal Resources<br />
The Planning Coordinator holds many positions in <strong>the</strong> City of Spring Hill, serving as Floodplain<br />
Manager, Emergency Manager, and is knowledgeable of land development and management<br />
practices for <strong>the</strong> City. Johnson County Fire District No. 2 provides fire and rescue services to<br />
<strong>the</strong> City. Table 2.20 details staff and technical resources for Spring Hill.<br />
Table 2.20. City of Spring Hill Personnel Resources and Warning Systems<br />
Personnel Resources Yes/No Department/Position<br />
Planner/Engineer with knowledge of Yes<br />
Planning Coordinator<br />
land<br />
development/land management<br />
practices<br />
Engineer/Professional trained in<br />
Yes<br />
City Engineer<br />
construction<br />
practices related to buildings and/or<br />
infrastructure<br />
Planner/Engineer/Scientist with an Yes<br />
Planning coordinator<br />
understanding of natural hazards<br />
GIS<br />
Full Time Building Official Yes Chief Building Inspector/Bldg<br />
Inspector<br />
Floodplain Manager Yes Planning Coordinator<br />
Emergency Manager Yes Planning Coordinator<br />
Grant Writer<br />
No<br />
Warning Systems<br />
(Reverse 9-11, cable override, outdoor<br />
warning signals)<br />
Yes<br />
Johnson County<br />
Financial tools and resources that <strong>the</strong> City can use to fund mitigation initiatives include <strong>the</strong><br />
following:<br />
• Community Development Block Grants<br />
• Capital Improvements Project Funding<br />
• Johnson County Stormwater Management program<br />
• Taxes for Specific Purposes<br />
• Fees for water or sewer<br />
2.50
• Impact Fees for New Development<br />
• Debt through General Obligation Bonds<br />
• Debt through Special Tax bonds<br />
Existing Plans and Policies<br />
Spring Hill is <strong>the</strong> newest addition to <strong>the</strong> NFIP program in Johnson County, having joined in<br />
09/03/2003. They also have and maintain <strong>the</strong> following plans and policies in place:<br />
• Comprehensive Plan<br />
• Unified Zoning Ordinance<br />
• Unified subdivision Ordinance<br />
• Floodplain Ordinance<br />
• Emergency Management Plan<br />
• Capital Improvements program<br />
• Building code<br />
• Site Plan Review Requirements<br />
• Capital Improvements Plan<br />
O<strong>the</strong>r Mitigation Activities<br />
None identified<br />
Property Valuation<br />
Table 2.28 below depicts <strong>the</strong> appraised values from <strong>the</strong> 2013 Abstract of Appraised and<br />
Assessed Values report.<br />
Table 2.28. Appraised Property Valuation, 2013<br />
Appraised Property Valuation<br />
Building Type Real Estate Structures ($) Median Home Value<br />
(2011)($)<br />
Residential 64,354,170 159,100<br />
Agricultural 0<br />
Commercial/Industrial 28,499,850<br />
Not for Profit 0<br />
Total $92,854,020<br />
Source: Johnson County Assessor Office/U.S. Census Bureau<br />
2.51
City of Westwood<br />
Westwood is situated in <strong>the</strong> Nor<strong>the</strong>ast corner of<br />
Johnson County & shares its borders with <strong>the</strong><br />
Cities of Roeland Park, Fairway, Mission Woods,<br />
Mission Hills, Westwood Hills, Kansas City,<br />
Kansas and Kansas City, Missouri on <strong>the</strong> east.<br />
Westwood has a mayor/city council form of<br />
government and <strong>the</strong> city departments include:<br />
administration, parks & recreation, public safety,<br />
and public works. Consolidated Fire District No. 2<br />
provides fire protection services for <strong>the</strong> City.<br />
Land Use and Development Trends<br />
The census of 2010 shows Westwood with a population of 1,506, a decrease of 27 people since<br />
<strong>the</strong> 2000 census. Land area is .40 square miles and population density is 3,765 people per<br />
square mile. With <strong>the</strong> population being statistically stagnant, Westwood has not seen<br />
considerable development trends.<br />
Technical and Fiscal Resources<br />
The Public Works Director serves as <strong>the</strong> floodplain manager and Police Chief seves as <strong>the</strong><br />
Emergency Manager. All engineering services are outsourced to private companies.<br />
Financial tools that <strong>the</strong> City can use to help fund mitigation activities include <strong>the</strong> following:<br />
• Community Development block Grants<br />
• Johnson county Stormwater Management Program<br />
• Taxes for Specific Purposes<br />
• Debt through General Obligation Bonds<br />
• Debt through Special Tax Bonds<br />
• Withholding spending in hazard prone areas<br />
Existing Plans and Policies<br />
Westwood became a member of <strong>the</strong> NFIP on 06/25/1976. The city has <strong>the</strong> following plans and<br />
policies in place:<br />
• Comprehensive Plan<br />
• Zoning Regulations<br />
• Floodplain Ordinance<br />
• Stormwater Ordinance<br />
• Capital Improvements Program<br />
• Building Code<br />
• Emergency Operations Plan<br />
2.52
O<strong>the</strong>r Mitigation Activities<br />
None identified at this time<br />
Property Valuation<br />
Table 2.29 below depicts <strong>the</strong> appraised values from <strong>the</strong> 2013 Abstract of Appraised and<br />
Assessed Values report.<br />
Table 2.29. Appraised Property Valuation, 2013<br />
Appraised Property Valuation<br />
Building Type Real Estate Structures ($) Median Home Value<br />
(2011)($)<br />
Residential 88,753,930 Not Available<br />
Agricultural 0<br />
Commercial/Industrial 15,340,300<br />
Not for Profit 1,145,150<br />
Total $105,239,380<br />
Source: Johnson County Assessor Office/U.S. Census Bureau<br />
City of Westwood Hills<br />
This small residential community is completely landlock<br />
in Nor<strong>the</strong>astern Johnson County. T<strong>here</strong> are no<br />
city buildings and all resources are provided by <strong>the</strong><br />
City of Westwood and Consolidated Fire District No.2<br />
provides fire protection services for <strong>the</strong> City.<br />
Land Use and Development Trends<br />
The 2010 census shows Westwood Hills has a population of 359 people, a decrease of 19 since<br />
<strong>the</strong> 2000 census. The land area is .07 square miles and <strong>the</strong> population density is 5,128 people<br />
per square mile. T<strong>here</strong> has not been any significant development in this residential community.<br />
Technical and Fiscal Resources<br />
The City of Westwood provides all technical resources, or <strong>the</strong>y are outsourced to private<br />
entities.<br />
Financial tools and resources that could help <strong>the</strong> city fund mitigation activities include:<br />
• Community Development Block Grants<br />
• Johnson County Stormwater Management program<br />
• Taxes for Specific Purposes<br />
• Debt through General Obligation Bonds<br />
• Debt through special Tax Bonds<br />
2.53
• Withholding spending in hazard prone areas<br />
Existing Plans and Policies<br />
The City of Westwood Hills has adopted <strong>the</strong> plans and policies from <strong>the</strong> city of Westwood. It<br />
has been a member of <strong>the</strong> NFIP since 08/03/1984.<br />
• Comprehensive Plan<br />
• Zoning Regulations<br />
• Floodplain Ordinance<br />
• Capital Improvements Program<br />
• Building Code<br />
• Emergency Operations Plan<br />
O<strong>the</strong>r Mitigation Activities<br />
None at this time<br />
Property Valuation<br />
Table 2.30 below depicts <strong>the</strong> appraised values from <strong>the</strong> 2013 Abstract of Appraised and<br />
Assessed Values report.<br />
Table 2.30. Appraised Property Valuation, 2013<br />
Appraised Property Valuation<br />
Building Type Real Estate Structures ($) Median Home Value<br />
(2011)($)<br />
Residential 37,029,050 Not Available<br />
Agricultural 0<br />
Commercial/Industrial 214,750<br />
Not for Profit 0<br />
Total $37,243,800<br />
Source: Johnson County Assessor Office/U.S. Census Bureau<br />
2. 2.9. Unified School Districts<br />
Johnson County has six Unified School Districts (USD), as well as a State School, <strong>the</strong> Kansas<br />
School for <strong>the</strong> Deaf in Ola<strong>the</strong>. Figure 2.21 shows <strong>the</strong> USD boundaries.<br />
2.54
Figure 2.4. USD’s in Johnson County<br />
U.S.D. 229 Blue Valley<br />
USD 229 serves <strong>the</strong> cities of Ola<strong>the</strong>, Leawood, and<br />
Overland Park, in addition to Johnson County. It covers<br />
91 square mile and has five high schools, nine middle<br />
schools and 20 elementary schools. The enrollment for<br />
<strong>the</strong> 2012-2013 school year is 22,392 students.<br />
Technical and Fiscal Resources<br />
The District employs <strong>the</strong> following staff:<br />
• Building Official – Principal<br />
• Emergency Manager<br />
• Grant Writer<br />
• Public Information Officer<br />
Fiscal Resources<br />
2.55
Fiscal resources that <strong>the</strong> district can draw upon for <strong>the</strong> funding of mitigation activities are:<br />
• Capital Improvements Project Funding<br />
• General Obligation Bonds<br />
• Special Tax bonds<br />
• State and Federal Funds<br />
Existing Plans and Policies<br />
USD 229, Blue Valley has plans and policies in places. These are as follows:<br />
• Master Plan<br />
• Capital Improvement Plan<br />
• School Emergency Plan<br />
• Shelter in Place Protocols<br />
• Evacuation Protocols<br />
• Weapons Policy<br />
O<strong>the</strong>r Mitigation Activities<br />
USD 229 conducts fire, tornado, and evacuation drills on a scheduled basis. Fire drills are<br />
monthly, and tornado drills are three times per year. They have also completed an upgrade to<br />
<strong>the</strong>ir school safe rooms.<br />
In addition, USD 229 has an on-going public education programs, such as responsible water<br />
use, fire safety, household preparedness, environmental education, and fire and severe wea<strong>the</strong>r<br />
safety.<br />
Table 2.31. USD 229 Blue Valley Asset Inventory<br />
Facility Name Address City<br />
School Blue River Elementary 5101 W 163rd Ter<br />
School Blue Valley Academy 7500 W 149th Ter<br />
School Blue Valley High 6001 W 159th St<br />
School Blue Valley Middle 5001 W 163rd Ter<br />
School Blue Valley North High 12200 Lamar Ave<br />
School Blue Valley Northwest High 13260 Switzer Rd<br />
School Blue Valley West High 16200 Antioch Road<br />
Insured Value<br />
($)<br />
Overland<br />
Park 10,126,150<br />
Overland<br />
Park 15,010,999<br />
Johnson<br />
County 47,793,303<br />
Overland<br />
Park 19,279,200<br />
Overland<br />
Park 62,717,640<br />
Overland<br />
Park 53,093,193<br />
Overland<br />
Park 72,386,767<br />
2.56
School Cedar Hills Elementary 9100 W 165th St<br />
School Cottonwood Point Elementary 10521 W 129th St<br />
School District Office Campus 15020 Metcalf Ave<br />
School Harmony Elementary 14140 Grant St<br />
School Harmony Middle 10101 W 141st St<br />
School Heartland Elementary 12775 Goodman St<br />
School Indian Valley Elementary 11600 Knox St<br />
School Lakewood Elementary 14600 Lamar Ave<br />
School Lakewood Middle 6601 Edgewater Dr<br />
Johnson<br />
County 11,180,925<br />
Overland<br />
Park 8,858,300<br />
Overland<br />
Park 8,917,713<br />
Overland<br />
Park 8,658,300<br />
Overland<br />
Park 18,714,120<br />
Overland<br />
Park 8,835,000<br />
Overland<br />
Park 10,546,200<br />
Overland<br />
Park 10,008,195<br />
Overland<br />
Park 20,409,360<br />
School Leawood Elementary 2400 W 123rd St Leawood 8,947,840<br />
School Leawood Middle 2410 W 123rd St Leawood 17,171,285<br />
School<br />
Liberty View Elementary<br />
14800 S Greenwood<br />
St Ola<strong>the</strong> 11,655,690<br />
School Mission Trail Elementary 13200 Mission Rd Leawood 9,316,585<br />
School Morse Elementary 15201 Monrovia St<br />
School Oak Hill Elementary 10200 W 124th St<br />
School Overland Trail Elementary 6225 W 133rd St<br />
School Overland Trail Middle 6201 W 133rd St<br />
School Oxford Middle 12500 Switzer Rd<br />
School Pleasant Ridge Middle 9000 W 165th St<br />
Overland<br />
Park 7,756,200<br />
Overland<br />
Park 7,998,000<br />
Overland<br />
Park 8,658,300<br />
Overland<br />
Park 18,714,120<br />
Overland<br />
Park 16,083,174<br />
Overland<br />
Park 19,910,760<br />
School Prairie Star Elementary 3800 W 143rd St Leawood 8,658,300<br />
School Prairie Star Middle 14201 Mission Rd Leawood 19,406,675<br />
School Stanley Elementary 6121 W 158th St<br />
School Stilwell Elementary 6410 W 199th St<br />
School Sunrise Point 15800 Roe Ave<br />
School Sunset Ridge Elementary 14901 England Ave<br />
School Valley Park Elementary 12301 Lamar Ave<br />
Overland<br />
Park 8,075,500<br />
Johnson<br />
County 10,222,250<br />
Overland<br />
Park 11,780,000<br />
Overland<br />
Park 9,610,000<br />
Overland<br />
Park 10,059,500<br />
2.57
U.S.D. 230 Spring Hill<br />
USD 230 serves 71 square miles in <strong>the</strong> sou<strong>the</strong>rn Johnson and Nor<strong>the</strong>rn Miami County which<br />
includes <strong>the</strong> Spring Hill area. Enrollment for <strong>the</strong><br />
2013-2014 school year is 3,000 students. The<br />
district has three elementary schools, one middle<br />
school, one high school and one virtual high<br />
school.<br />
Technical and Fiscal Resources<br />
The school currently employs <strong>the</strong> following<br />
positions as technical resources for <strong>the</strong> purpose<br />
of this plan:<br />
• Full Time Building Official (all Principals)<br />
• Emergency Manager (Superintendent)<br />
• Grant Writer (Administration)<br />
• Public Information Officer (Director of Communications)<br />
Fiscal Resources available to <strong>the</strong> school district include:<br />
• Capital Improvements Project Funding<br />
• Local Funds<br />
• General Obligation Bonds<br />
• State and Federal Funds<br />
Existing Plans and Policies<br />
The following plans and policies are in place at USD 230:<br />
• Master Plan<br />
• Capital Improvement Plan<br />
• School Emergency Plan<br />
o Shelter in Place protocols<br />
o Evacuation Protocols<br />
• Weapons Policy<br />
O<strong>the</strong>r Mitigation Activities<br />
The following activities are on-going at <strong>the</strong> school district:<br />
Water conservation Bullying Prevention Safe Driving Alcohol Awareness<br />
Electricity Conservation Stranger Danger Recycling Environmental Education<br />
Narcotics Awareness Gun Safety Fire Safety Swimming Eduction<br />
In addition, USD 230 conducts fire drills monthly, and tornado drills four times a year, are<br />
equipped with wea<strong>the</strong>r radios, and conduct lock-down security training for <strong>the</strong> staff and<br />
2.58
students. Ano<strong>the</strong>r mitigation activity currently on-going is <strong>the</strong> upgrading of <strong>the</strong> entrances in<br />
every building within <strong>the</strong> district. These upgrades include: line-of-sight entrances, cameras,<br />
sound system, protective glass, etc.<br />
Table 2.31. USD 230 Asset Inventory<br />
Name of Asset<br />
Board of Education Office<br />
Spring Hill High School<br />
Spring Hill Middle School -<br />
South<br />
Spring Hill Intermediate<br />
School will become<br />
Spring Hill Middle School -<br />
North in August 2013<br />
Spring Hill Elementary<br />
School<br />
Address<br />
101 E. South Street<br />
Spring Hill, KS 66083<br />
19701 Ridgeview Rd,<br />
Spring Hill, KS 66083<br />
301 E. South Street<br />
Spring Hill, KS 66083<br />
300 E. South Street<br />
Spring Hill, KS 66083<br />
300 S. Webster Street<br />
Spring Hill, KS 66083<br />
Prairie Creek Elementary 17077 W. 165th Street<br />
Sh<br />
*Wolf<br />
l<br />
Creek Elementary<br />
Ol<br />
19250<br />
h<br />
Ridgeview<br />
KS 66062<br />
Rd,<br />
School will open in August Spring Hill, KS 66083<br />
2013<br />
Square<br />
Feet<br />
Replacement t<br />
Value<br />
(insured)<br />
Contents<br />
Value Occupancy/Capacity #<br />
10,000 $1,106,694 $286,110 256 cap.<br />
181,670 $28,000,000 $5,800,000 Student cap. 850 Total cap. 1816<br />
98,130 $13,942,330 $3,000,000 Student cap. 528 Total cap. 622<br />
62,260 $8,452,755 $2,001,392 Student cap. 400 Total cap. 622<br />
84,000 $13,290,345 $2,658,069 Student cap.616 Total cap. 840<br />
52,150 $8,680,000 $2,081,329 Student cap.528 Total cap. 528<br />
52,150 $8,680,000 $8,680,000 Student cap.528 Total cap. 529<br />
U.S.D. 231 Gardner/Edgerton<br />
USD 231 serves <strong>the</strong> communities of Gardner and<br />
Edgerton. The school district has six elementary<br />
schools, two middle schools, and one high school.<br />
It also has one alternative education attendance<br />
center. The enrollment for <strong>the</strong> 2012-2013 school<br />
year is approximately 5,450 students.<br />
Technical and Fiscal Resources<br />
The Superintendent and <strong>the</strong> Director of Secondary<br />
Education can serve as <strong>the</strong> Emergency Manager. The district also has a Community Relations<br />
Director.<br />
Financial resources that <strong>the</strong> district can use to facilitate mitigation activities include <strong>the</strong> Capital<br />
Improvements Project Funds, General Obligation Bonds, and State and Federal Funds.<br />
2.59
Existing Plans and Policies<br />
In partnership with public safety agencies and crisis consultants, <strong>the</strong> school district has a<br />
complete Crisis Communication and Response Plan for <strong>the</strong> safety and security of district<br />
students and staff. It includes such topics as utility failure, off-site emergencies, hazardous<br />
<strong>material</strong>s, severe wea<strong>the</strong>r, fire, and code red and yellow.<br />
O<strong>the</strong>r Mitigation Activities<br />
USD 231 conducts routine fire, tornado, intruder, and evacuation drills in each of <strong>the</strong>ir school<br />
buildings. The district also proved CPR/AED training and re-certification training offered free-ofcharge<br />
to all staff members.<br />
Asset Inventory<br />
Table 2.32. USD<br />
231 Asset Inventory<br />
Facility Name Address City Occupancy<br />
School Edgerton Elementary 400 W. Nelson Edgerton<br />
School<br />
Education Admin. Office<br />
314 E. Washington<br />
St<br />
Gardner<br />
School Gardner Elementary 218 E Shawnee St Gardner 405<br />
School Gardner-Edgerton High 425 N Waverly Rd Gardner 1275<br />
School Madison Elementary 800 W Madison St Gardner 450<br />
School<br />
Moonlight Elementary<br />
17960 S Moonlight<br />
Rd Gardner 566<br />
School<br />
Nike Elementary<br />
19500 S Gardner<br />
Rd. Gardner 393<br />
School Pioneer Ridge Middle 16200 Kill Creek Rd Gardner 695<br />
School Sunflower Elementary 775 N Center St Gardner 365<br />
School<br />
Wheatridge Middle<br />
318 E Washington<br />
St Gardner 806<br />
School Maintenance/Transportation 1950 S. Gardner Rd Gardner<br />
U.S.D. 232 De Soto<br />
The largest school district in Johnson<br />
County, USD 232 covers 100+ square<br />
miles. It services <strong>the</strong> jurisdictions of <strong>the</strong><br />
City of De Soto, Lenexa (40%), a portion<br />
of Ola<strong>the</strong> and Shawnee (60%), and <strong>the</strong><br />
Lexington and Ola<strong>the</strong> Townships. The<br />
enrollment for <strong>the</strong> 2012 – 2013 school<br />
year was 6,977 students. The school<br />
district has seven elementary schools, three middle schools, and two high schools.<br />
2.60
Technical and Fiscal Resources<br />
USD 232 has a Director of Operations that serves as <strong>the</strong> Emergency Manager and a Director of<br />
Communications for public information. Fiscal resources consist of Capital Improvements<br />
Project Funding, Local Funds, General Obligation Bonds, Private activities/donations, and State<br />
and Federal Funds.<br />
Existing Plans and Policies<br />
USD 232 has established plans and policies which include a Capital Improvement Plan, School<br />
Emergency Plan (Shelter in place protocols, Evacuation protocols) and a Weapons Policy.<br />
O<strong>the</strong>r Mitigation Activities<br />
USD 232 conducts <strong>the</strong> routine fire, tornado, and evacuation drills in all of <strong>the</strong>ir school buildings.<br />
Each school facility is secure during school days with an ADT security system and <strong>the</strong>re is a<br />
district-wide email alert system to keep parents informed.<br />
USD 232 submitted an application and was approved for a FEMA Approved Safe room during<br />
this planning period. It is estimated to be complete during <strong>the</strong> 2013 – 2014 school year.<br />
Asset Inventory<br />
Table 2.32. USD232 Asset Inventory<br />
Facility Name Address City Insured Value Occupancy<br />
School Clear Creek Elementary 5815 Monticello Rd Shawnee $ 12,832,400 600<br />
School Horizon Elementary 7210 Chouteau St Shawnee $ 15,600,000 600<br />
School Mill Creek Middle 8001 Mize Rd Lenexa $ 21,000,000 750<br />
School Mill Valley High 5900 Monticello Rd Shawnee $ 31,500,000 1450<br />
School Mize Elementary 7301 Mize Rd Shawnee $ 13,504,600 600<br />
School Monticello Trails Middle 6100 Monticello Rd Shawnee $ 20,314,400 750<br />
22405 Clear Creek<br />
School Prairie Ridge Elementary Pkwy Shawnee $ 16,100,000 600<br />
School Riverview Elementary 21550 W 47th St Shawnee $ 13,543,400 600<br />
Transportati<br />
on Center Bus Depot 8020 Monticello Terr Shawnee $ 2,000,000<br />
School Starside Elementary 35400 W 91st De Soto $ 128,324,000 600<br />
School<br />
Lexington Trails Middle<br />
School 8800 Denver De Soto $ 21,751,600 750<br />
School DeSoto High School 35000 W 91st De Soto $ 23,708,600 750<br />
School<br />
Country Side Learning<br />
Center 10120 Lexington De Soto $ 5,339,400 250<br />
School Administration Office 35200 W. 91st De Soto $ 3,400,000 200<br />
School Technology Center 8305 Peoria De Soto $ 755,850 100<br />
2.61
U.S.D. 233 Ola<strong>the</strong><br />
USD 233 serves Ola<strong>the</strong> with 34 elementary schools,<br />
nine middle schools, four high schools and seven<br />
specialty school programs. It continues to be one of <strong>the</strong><br />
fastest growing school districts in <strong>the</strong> area. The<br />
enrollment for <strong>the</strong> 2012 – 2013 school year is 29,031<br />
students.<br />
Technical and Fiscal Resources<br />
The Principal serves as <strong>the</strong> full-time building official, and <strong>the</strong> Manager of Safety and Security<br />
serves as <strong>the</strong> Emergency Manager for <strong>the</strong> school district.<br />
Fiscal resources available to <strong>the</strong> district for mitigation activities include:<br />
• Capital Improvements Project Funding<br />
• Local Funds<br />
• General Obligation Bonds<br />
• Private activities/donations<br />
• State and Federal Funds<br />
Existing Plans and Policies<br />
The established plans and policies for <strong>the</strong> school district include a capital improvement plan,<br />
school emergency plan, weapons policy and a master plan.<br />
O<strong>the</strong>r Mitigation Activities<br />
The Ola<strong>the</strong> School District continues <strong>the</strong>ir Safe Schools for All policy that emphasizes a safe<br />
environment. They work hand-in-hand with <strong>the</strong> community, including <strong>the</strong> Ola<strong>the</strong> Police<br />
Department and o<strong>the</strong>r law enforcement agencies to support safe schools. T<strong>here</strong> is also a<br />
certified law enforcement officer in <strong>the</strong> high schools and one per two middle schools with <strong>the</strong><br />
School Resource Officer (SRO) program.<br />
USD 233 also holds regular fire, tornado, and evacuation drills on a scheduled basis.<br />
Asset Inventory<br />
Table 2.33. U.S.D. 233 Asset Inventory<br />
Facility Name Address City<br />
School<br />
ACCESS Program<br />
650 SLindenwood<br />
Dr<br />
Ola<strong>the</strong><br />
School Activity Center 21201 W 159th St Ola<strong>the</strong><br />
School<br />
Arbor Creek Elementary<br />
16150 S Brougham<br />
Dr<br />
Ola<strong>the</strong><br />
Overland<br />
School Bentwood Elementary 13000 Bond St Park<br />
2.62
School<br />
Black Bob Elementary<br />
14701 S Brougham<br />
Dr<br />
Ola<strong>the</strong><br />
School<br />
Briarwood Elementary<br />
14101 S Brougham<br />
Dr<br />
Ola<strong>the</strong><br />
School<br />
Brougham Elementary<br />
15500 S Brougham<br />
Dr<br />
Ola<strong>the</strong><br />
School California Trail Middle 13775 W 133rd St Ola<strong>the</strong><br />
School Cedar Creek Elementary 11150 S Clare Rd Ola<strong>the</strong><br />
School Central Elementary 324 S Water St Ola<strong>the</strong><br />
Facility Name Address City<br />
School Chisholm Trail Middle 16700 W 159th St Ola<strong>the</strong><br />
School<br />
Clare Alternative Learning<br />
Center 540 S Rogers Rd Ola<strong>the</strong><br />
School<br />
Clearwater Creek<br />
Elementary<br />
930 S Clearwater<br />
Creek Dr<br />
Ola<strong>the</strong><br />
School<br />
College Blvd Activity<br />
Center 11031 S. Valley Rd Ola<strong>the</strong><br />
School Countryside Elementary 15800 W 124th Ter Ola<strong>the</strong><br />
School Education Admin. Office 14160 Black Bob Rd Ola<strong>the</strong><br />
School Fairview Elementary 600 N Marion St Ola<strong>the</strong><br />
School Food Production Center 14140 Black Bob Rd Ola<strong>the</strong><br />
School Forest View Elementary 12567 S Canyon Dr Ola<strong>the</strong><br />
School Frontier Trail Middle 15300 W 143rd St Ola<strong>the</strong><br />
School Green Springs Elementary 14675 S Alden St Ola<strong>the</strong><br />
School<br />
Harmony Early Childhood<br />
Center<br />
14030 S Black Bob<br />
Rd<br />
Ola<strong>the</strong><br />
School Havencroft Elementary 1700 E Sheridan St Ola<strong>the</strong><br />
School Heartland Learning Center 1700 W Sheridan St Ola<strong>the</strong><br />
School Hea<strong>the</strong>rstone Elementary 13745 W 123rd St Ola<strong>the</strong><br />
School Heritage Elementary 1700 E Pawnee Dr Ola<strong>the</strong><br />
15800 W Indian<br />
School<br />
Indian Creek Elementary Creek Pkwy<br />
Ola<strong>the</strong><br />
School Indian Trail Middle 1440 E 151st St Ola<strong>the</strong><br />
School<br />
Instructional Materials<br />
Center 14090 Black Bob Rd Ola<strong>the</strong><br />
School Jo Co Detention Center 915 W Spruce St Ola<strong>the</strong><br />
School<br />
Mission Trail Middle<br />
1001 N. Persimmion<br />
Dr.<br />
Ola<strong>the</strong><br />
School Lone Elm Service Building 21800 W 107th St Ola<strong>the</strong><br />
School Madison Place Elementary 16651 S Warwick St Ola<strong>the</strong><br />
School Mahaffie Elementary 1300 N Nelson Rd Ola<strong>the</strong><br />
School<br />
Manchester Park<br />
Elementary<br />
9810 Prairie Creek<br />
Rd<br />
Lenexa<br />
School Meadow Lane Elementary 21880 College Blvd Ola<strong>the</strong><br />
School Millcreek Center 311 E Park St Ola<strong>the</strong><br />
School<br />
N. Lindenwood Support<br />
Center<br />
315 N Lindenwood<br />
St<br />
Ola<strong>the</strong><br />
School Northview Elementary 905 N Walker St Ola<strong>the</strong><br />
School Ola<strong>the</strong> East High 14545 W 127th St Ola<strong>the</strong><br />
2.63
School Ola<strong>the</strong> North High 600 E Prairie St Ola<strong>the</strong><br />
School<br />
Ola<strong>the</strong> Northwest High<br />
School<br />
21300 W College<br />
Blvd<br />
Ola<strong>the</strong><br />
School Ola<strong>the</strong> South High 1640 E 151st St Ola<strong>the</strong><br />
School Operational Service Center 1500 W 56 Hwy Ola<strong>the</strong><br />
School Oregon Trail Middle 1800 W Dennis Ave Ola<strong>the</strong><br />
School Pioneer Trail Middle 15100 W 127th St Ola<strong>the</strong><br />
Facility Name Address City<br />
School Pleasant Ridge Elementary 12235 Rosehill Rd<br />
Overland<br />
Park<br />
School<br />
Prairie Center Elementary<br />
629 N Persimmon<br />
Dr<br />
Ola<strong>the</strong><br />
School Prairie Learning Center 1400 W Santa Fe St Ola<strong>the</strong><br />
School Prairie Trail Middle 21600 W 107th St Ola<strong>the</strong><br />
School Ravenwood Elementary 12211 S Clinton St Ola<strong>the</strong><br />
School<br />
Regency Place Elementary<br />
13250 S Greenwood<br />
St<br />
Ola<strong>the</strong><br />
School Ridgeview Elementary 1201 E Elm St Ola<strong>the</strong><br />
School Rolling Ridge Elementary 1500 W Elm Ter Ola<strong>the</strong><br />
School<br />
Santa Fe Trail Middle<br />
1100 N Ridgeview<br />
Rd<br />
Ola<strong>the</strong><br />
School<br />
Scarborough Elementary<br />
2000 S Lindenwood<br />
Dr<br />
Ola<strong>the</strong><br />
School<br />
Sunny Side Elementary<br />
16025 S<br />
Lindenwood Dr Ola<strong>the</strong><br />
School<br />
Tomahawk Elementary<br />
13820 S Brougham<br />
Dr<br />
Ola<strong>the</strong><br />
School Walnut Grove Elementary 11800 Pflumm Rd Ola<strong>the</strong><br />
School<br />
Washington Elementary<br />
1202 N Ridgeview<br />
Rd<br />
Ola<strong>the</strong><br />
School Westview Elementary 601 S Lee St Ola<strong>the</strong><br />
School<br />
Woodland Elementary<br />
11601 S Woodland<br />
Rd<br />
Ola<strong>the</strong><br />
U.S.D. 512 Shawnee Mission<br />
The Shawnee Mission USD covers 72 square<br />
miles of nor<strong>the</strong>astern Johnson County with<br />
almost 27,500 students and over 3,500<br />
faculty/staff. It serves <strong>the</strong> cities of Fairway, Lake<br />
Quivira, Lenexa, Merriam, Mission, Mission<br />
Hills, Mission Woods, Prairie Village, Roeland<br />
Park, Shawnee, Westwood, Westwood Hills and<br />
2.64
sections of Overland Park with three school buildings; 33 elementary schools, five middle<br />
schools, and five high schools. The District is comprised of three departments - administrative<br />
services, operations, and educational services.<br />
Technical and Fiscal Resources<br />
Shawnee Mission USD has <strong>the</strong>ir own Campus Police at each of <strong>the</strong> five high schools.<br />
Fiscal resource include: Capital improvements project funding, local funds, general obligation<br />
bonds, private activities/donations, and State and Federal Funds.<br />
Existing Plans and Policies<br />
USD 512 has a master plan, capital improvement plan, crisis management plan, and a weapons<br />
policy.<br />
O<strong>the</strong>r Mitigation Activities<br />
Security measures at all <strong>the</strong> schools include visitor check-in requirements, designated safe<br />
areas in each building, with School Resource Officers and Campus Police at <strong>the</strong> high schools.<br />
Schools practice fire, tornado, lockdown, and evacuation procedures yearly.<br />
Asset Inventory<br />
Table 2.34. U.S.D. 512 Shawnee Mission<br />
Facility Name Address City Insured Value<br />
School Antioch Middle 8200 W 71st St<br />
Overland<br />
Park $14,248,450<br />
School Apache Elementary 8910 Goddard St<br />
Overland<br />
Park $9,931,763<br />
Arrowhead Administrative<br />
Center<br />
Overland<br />
Park $6,106,146<br />
School<br />
6601 Santa Fe Dr<br />
Prairie<br />
School Belinder Elementary 7230 Belinder Ave Village $9,978,966<br />
Bluejacket-Flint<br />
School Elementary 11615 W 49th Ter Shawnee $13,383,499<br />
Prairie<br />
School Briarwood Elementary 5300 W 86th St Village $11,250,490<br />
Broadmoor Technical<br />
Overland<br />
School Center<br />
6701 W 83rd St Park $12,660,342<br />
School Broken Arrow Elementary 5901 Alden Rd Shawnee $11,525,371<br />
Overland<br />
School Brookridge Elementary 9920 Lowell St Park $9,990,093<br />
School Brookwood Elementary 3411 W 103rd St Leawood $8,304,956<br />
Christa McAuliffe<br />
School Elementary 15600 W 83rd St Lenexa $4,717,150<br />
School Comanche Elementary 8200 Grant St<br />
Overland<br />
Park $11,734,938<br />
School Corinth Elementary 8301 Mission Rd<br />
Prairie<br />
Village $10,313,989<br />
School Crestview Elementary 6101 Craig Rd Merriam $8,337,088<br />
2.65
Crestview Elementary<br />
School trailers 6102 Craig Rd Merriam $25,628<br />
School Don Bonjour Elementary 9400 Pflumm Rd Lenexa $88,842,344<br />
School<br />
Dorothy Moody<br />
Elementary<br />
10101 England<br />
School East Antioch Elementary 7342 Lowell St<br />
Overland<br />
Park $9,520,808<br />
Overland<br />
Park $9,463,847<br />
School<br />
Highlands Elementary<br />
(existing) 6200 Roe Ave Mission 9,037,387.00<br />
School<br />
Highlands Elementary<br />
(New) -<br />
School Hocker Grove Middle 10400 Johnson Dr Shawnee $14,696,041<br />
School Horizons High 5900 Lamar Ave Mission $11,029,166<br />
School<br />
Indian Creek Technology<br />
Center<br />
4401 W 103rd St<br />
School Indian Hills Middle 6400 Mission Rd<br />
School Indian Woods Middle 9700 Woodson St<br />
Overland<br />
Park $22,381,650<br />
Prairie<br />
Village $16,863,660<br />
Overland<br />
Park $18,059,867<br />
Overland<br />
School John Diemer Elementary 9600 Lamar Ave Park $8,497,602<br />
McAuliffe Elementary 15600 W. 83rd St. Lenexa $12,244,192<br />
School McEachen Admin. Center 7235 Antioch Rd<br />
Overland<br />
Park $6,265,501<br />
School Merriam Park Elementary 6100 Mastin St Merriam $11,798,437<br />
School Mill Creek Elementary 13951 W 79th St Lenexa $9,437,164<br />
Prairie<br />
School Mission Valley Middle 8500 Mission Rd Village $16,706,604<br />
School Nieman Elementary 10917 W 67th St Shawnee $12,495,967<br />
School<br />
Oak Park-Carpenter<br />
Elementary<br />
10000 Nieman Rd<br />
School Overland Park Elementary 8150 Santa Fe Dr<br />
School Pawnee Elementary 9501 W 91st St<br />
Overland<br />
Park $12,686,871<br />
Overland<br />
Park $11,370,582<br />
Overland<br />
Park $10,620,746<br />
School Prairie Elementary 6642 Mission Rd<br />
Prairie<br />
Village $10,655,372<br />
School<br />
Raymond Marsh<br />
Elementary 5642 Rosehill Rd Shawnee $11,589,133<br />
School<br />
School<br />
Rhein Benninghoven<br />
Elementary 6720 Caenen St Shawnee $9,524,598<br />
8600 Candlelight<br />
Rising Star Elementary Ln Lenexa $14,785,521<br />
School Roesland Elementary 4900 Parish Dr<br />
Roeland<br />
Park $12,131,628<br />
School Rosehill Elementary 9801 RoseHill Rd Lenexa $13,923,736<br />
School Rushton Elementary 6001 W 52nd St Mission $811,932<br />
Overland<br />
School Santa Fe Trail Elementary 7100 Lamar Ave Park $9,836,846<br />
School Shawanoe Elementary 11230 W 75th St Shawnee $8,757,744<br />
School<br />
Shawnee Mission<br />
Operations and<br />
11475 W 93rd St<br />
Overland<br />
Park $7,049,441<br />
2.66
Maintenance<br />
School SM East High 7500 Mission Rd<br />
School<br />
SM Instructional Support<br />
Center<br />
9700 W 96th St<br />
Prairie<br />
Village $52,490,747<br />
Overland<br />
Park $8,543,386<br />
School SM North High 7401 Johnson Dr<br />
Overland<br />
Park $66,685,085<br />
School SM Northwest High 12701 W 67th St Shawnee $54,572,614<br />
School SM South High 5800 W 107th St<br />
Overland<br />
Park $62,049,137<br />
School SM West High 8800 W 85th St<br />
Overland<br />
Park $55,331,108<br />
Overland<br />
School Soccer Complex 9300 Nieman Road Park $280,577<br />
School Softball Complex 6101 Maurer Shawnee $770,732<br />
School<br />
Somerset Elem (closed<br />
after2003-04 school year)<br />
2700 Somerset Dr.<br />
Prairie<br />
Village $6,352,020<br />
8715 W 49th<br />
Terrace Merriam $5,952,420<br />
School South Park Elementary<br />
School Stadium North $7,063,629<br />
Overland<br />
School Stadium South 5800 W. 107th St. Park $9,188,279<br />
School Sunflower Elementary 8955 Loiret Blvd. Lenexa $13,262,052<br />
School<br />
Supply Center<br />
14850 W. 101st<br />
Terrace Lenexa $11,599,648<br />
Overland<br />
School Tomahowk Elementary 6301 W. 78th Park $9,322,323<br />
School Trailridge Middle 7500 Quivira Rd Lenexa $20,254,925<br />
School Trailwood Elementary 5101 W. 95th St.<br />
Overland<br />
Park $10,883,926<br />
School Westridge Middle 9300 Nieman Rd<br />
Overland<br />
Park $21,492,432<br />
School<br />
Westwood View<br />
Elementary 2511 W. 50th Westwood $7,012,035<br />
2.2.10 Kansas School for <strong>the</strong> Deaf (KSD)<br />
The Kansas School for <strong>the</strong> Deaf is located in Ola<strong>the</strong> between Santa Fe and Park Drive and<br />
today includes nine buildings on approximately 12 acres. KSD serves 130 deaf students in<br />
grades pre- K through 12th grade. T<strong>here</strong> is approximately 150 staff that provides services to<br />
teach, house, feed, and provide health services during <strong>the</strong> week for ten months of <strong>the</strong> year.<br />
Dormitory housing is available for approximately 60 students that live more than 25 miles from<br />
<strong>the</strong> KSD.<br />
Technical and Fiscal Resources<br />
The Human Resources/Capital Improvements Director serves as a full-time building official and<br />
<strong>the</strong> Superintendent serves as <strong>the</strong> Public Information Officer for KSD. The Maintenance<br />
2.67
Specialist serves as <strong>the</strong> Emergency Manager. KSD can access capital improvements funds<br />
along with state and federal funds for fiscal resources.<br />
Existing Plans and Policies<br />
KSD has an existing capital improvements plan and a school emergency plan that addresses<br />
shelter in place and evacuation protocols that are revised annually.<br />
O<strong>the</strong>r Mitigation Activities<br />
None at this time.<br />
2.2.11 Community College and University<br />
Johnson County Community College<br />
Johnson County Community College (JCCC) is a participating jurisdiction in this multi-hazard<br />
mitigation plan. As a public institution, it has a shared interest in public safety and in achieving<br />
<strong>the</strong> county’s mitigation goals.<br />
JCCC is centrally located in Johnson County on 234 acres with 25 major buildings on <strong>the</strong> main<br />
campus. Each semester, it averages 34,000 students enrolled in credit and continuing<br />
education classes.<br />
Technical and Fiscal Resources<br />
JCCC has a warning and emergency notification system for faculty, staff, and students and has<br />
upgraded <strong>the</strong> cell phone alert system. T<strong>here</strong> is an emergency manager, building official, grant<br />
writer, and public information officer. Fiscal resources available include capital improvements<br />
project funds, local funds, general obligation bonds, special tax bonds, private donations, and<br />
state and federal funds.<br />
Existing Plans and Policies<br />
All <strong>the</strong> existing plans have been updated as of January 2008. Plans maintained by <strong>the</strong> college<br />
include a master plan, capital improvement plan, shelter in place, and evacuation policies as<br />
well as site security protocols.<br />
O<strong>the</strong>r Mitigation Activities<br />
None available at this time.<br />
University of Kansas Edwards Campus<br />
As a public institution in Johnson County since 1993, <strong>the</strong> University of Kansas (KU) Edwards<br />
Campus has designed itself for <strong>the</strong> adult learner, not <strong>the</strong> full-time student, with many evening<br />
and weekend classes. The enrollment has varied each semester ranging from a 1,000 to 1,557<br />
students in 2007. The 30 acre campus is located in Overland Park and currently has three<br />
buildings, but <strong>the</strong>re are no dormitories.<br />
2.68
Technical and Fiscal Resources<br />
Personnel resources for <strong>the</strong> Edwards Campus include <strong>the</strong> Vice Chancellor who serves as a<br />
building official as well as a Facilities Operations Manager and a Director of Public Relations.<br />
All <strong>the</strong> financial resources are provided by <strong>the</strong> KU Lawrence campus.<br />
Existing Plans and Policies<br />
Existing plans include master plan, school emergency plan, and a weapons policy.<br />
O<strong>the</strong>r Mitigation Activities<br />
The administrative staff <strong>review</strong>s <strong>the</strong> crisis management plan on a yearly basis. T<strong>here</strong> is also fire<br />
safety training and security training for staff and students as an on-going safety measure.<br />
2.2.12<br />
Fire Districts<br />
T<strong>here</strong> are four (4) fire districts participating as special districts in <strong>the</strong> development of <strong>the</strong><br />
Johnson County Multi-Hazard Mitigation Plan. They include Consolidated Fire District No. 2,<br />
Johnson County Fire District No. 1, Johnson County Fire District No. 2, and Fire District No. 3.<br />
The cities of Leawood, Lenexa, Merriam, Ola<strong>the</strong>, Overland Park, and Shawnee have <strong>the</strong>ir own<br />
fire fighting capabilities. Figure 2.5 on <strong>the</strong> next page depicts <strong>the</strong> fire districts in Johnson County.<br />
Figure 2.5. Johnson County Fire Districts<br />
2.69
Source: Johnson County AIMS (mitigation plan, 2009)<br />
Consolidated Fire District No. 2<br />
Consolidated Fire District No. 1 provides fire and emergency service to nine municipalities in<br />
Nor<strong>the</strong>ast Johnson County. The Cities it protects are Fairway, Mission, Mission Hills, Mission<br />
Woods, Prairie Village, Roeland Park, Westwood, Westwood Hills and portions of Overland<br />
Park. Since consolidation of fire districts in 1988, it consists of 3 fire stations and an<br />
administrative building.<br />
Technical and Fiscal Resources<br />
The Fire Chief, <strong>the</strong> Division Chief, and <strong>the</strong> Fire Marshal are all trained in building construction<br />
practices. T<strong>here</strong> are 77 full, part-time and volunteer fire fighters. Consolidated Fire District No. 2<br />
can levy taxes for special purposes.<br />
Existing Plans and Policies<br />
Each municipality that <strong>the</strong>y service has an emergency operations plan. The fire district itself has<br />
its own capital improvements plan. Their Public Protection Classification (ISO) rating is a 3 out<br />
2.70
of 10, with 1 being <strong>the</strong> highest score possible. The fire district is engaged in public education<br />
and<br />
provides free fire inspects for all <strong>the</strong> homes in <strong>the</strong> district. They participate in many public<br />
functions such as station tours, block parties, and festivals.<br />
Johnson county Fire district No. 1<br />
Through <strong>the</strong> consolidation of Edgerton Community Fire Department, Gardner Rural Fire<br />
Department, and Johnson County Fire Rescue in 1992 Johnson County Fire District No. 1 was<br />
created.<br />
The communities Fire District No. 1 serves encompass approximately 100 square miles in<br />
South Central Johnson County and a variety of environments. It is <strong>the</strong> primary Fire Department<br />
for <strong>the</strong> cities of Edgerton and Gardner, and <strong>the</strong> unincorporated areas surrounding <strong>the</strong>se cities.<br />
The service areas consist primarily of farmland and a rural population of approximately 7,000<br />
residents. It also services <strong>the</strong> busiest airport in Kansas at New Century Air Center. In addition to<br />
air traffic, New Century has an extensive industrial park and office complex with a daytime<br />
population of approximately 5,000 people. The fire district also has responsibility to <strong>the</strong> cover<br />
nearly 13 miles of Interstate 35.<br />
Currently <strong>the</strong> fire district has <strong>the</strong> only true Aircraft Rescue and Firefighting vehicle in <strong>the</strong> county.<br />
All of <strong>the</strong> front line engines are equipped with extrication equipment to deal with <strong>the</strong> many<br />
rescue possibilities that could present <strong>the</strong>mselves from incidents on <strong>the</strong> highway or <strong>the</strong><br />
industrial complex. The fleet also includes four grass fire fighting rigs and three tankers to help<br />
in <strong>the</strong> rural environment.<br />
Technical and Fiscal Resources<br />
Fire District No. 1 has 3 fire stations with <strong>the</strong> main station located at <strong>the</strong> New Century Airport.<br />
The District is equipped with 1 crash truck for <strong>the</strong> airport location, and 3 tanker trucks, 3 brush<br />
trucks, and 3 engine trucks for each fire station in <strong>the</strong> district.<br />
Existing Plans and Policies<br />
Their Public Protection Classification (ISO) rating is a 5 out of 10 for 90 percent of <strong>the</strong><br />
jurisdiction and an ISO rating of a 9 in 6 to 9 square mile area. Ten percent of this score is<br />
based on how well <strong>the</strong> fire district receives fire alarms and dispatches fire fighting resources.<br />
Fifty percent of <strong>the</strong> score is based on <strong>the</strong> number of engine companies available and <strong>the</strong><br />
amount of water <strong>the</strong> community needs to fight a fire. Forty percent of <strong>the</strong> ISO rating is based on<br />
<strong>the</strong> community’s supply of available water for fire suppression purposes.<br />
Fire District No. 1 is involved with <strong>the</strong> public in many different avenues. It provides CERT<br />
training, CPR and First Aid Training to <strong>the</strong> public, public safety messages, issues burn permits,<br />
and education during fire prevention week.<br />
Johnson County Fire District No. 2<br />
This fire district serves sou<strong>the</strong>rn Johnson County and nor<strong>the</strong>rn Miami County. The district is<br />
2.71
esponsible for rural areas, suburban areas, light industrial, and businesses in a growing<br />
County.<br />
Technical and Fiscal Resources<br />
Johnson County provides <strong>the</strong>ir technical resources except Fire District #2 has <strong>the</strong>ir own grant<br />
writer. Fiscal resources include <strong>the</strong> ability to incur capital improvements project funding, levy<br />
taxes, and incur debt through general obligation and special tax bonds.<br />
Existing Plans and Policies<br />
The Public Protection Classification (ISO) rating is a three. The fire district operates under <strong>the</strong><br />
County’s ordinances, codes, and plans. The fire district provides educational fire safety <strong>material</strong><br />
to <strong>the</strong> public and is a CERT participant.<br />
Johnson County Fire District No. 3.<br />
Fire District No. 3 serves Northwestern Johnson County and merged with <strong>the</strong> De Soto Fire<br />
District on January 1, 2010.<br />
Technical and Fiscal Resources<br />
Fire District No. 3 has two stations with 10 full-time, 17 part-time, and 20 volunteer fire fighters.<br />
Fiscal resources are <strong>the</strong> ability to levy taxes and <strong>the</strong> ability to incur debt through general<br />
obligation bonds to be used on <strong>the</strong> fire station buildings and <strong>the</strong> purchase of apparatuses.<br />
Existing Plans and Policies<br />
The Public Protection Classification (ISO) rating is a six out of 10 in <strong>the</strong> hydrated areas and a<br />
nine rating in <strong>the</strong> non-hydrated areas of <strong>the</strong> jurisdiction. The district is engaged in providing fire<br />
prevention presentations at USD 232 schools and issues burn permits for residents.<br />
2.72
2.3 Leavenworth<br />
2.3 Leavenworth County History<br />
Named after Henry Leavenworth, an officer in <strong>the</strong> War of 1812, Leavenworth County was<br />
formed from free territory on August 30, 1866. Its earliest know inhabitants were <strong>the</strong> Kansa<br />
Indians, although <strong>the</strong> name of <strong>the</strong>ir tribe has been spelled many ways, from Kanza, Canceas<br />
and Kaw to Konza. Moving <strong>the</strong>ir Nation to <strong>the</strong> land now known as Manhattan, <strong>the</strong> Kansas<br />
Indians ceded <strong>the</strong>ir land to <strong>the</strong> United States by treaty on June 3, 1825, at which time <strong>the</strong><br />
Delaware Trust Lands was set up. The last remaining tract of this land was called <strong>the</strong> Delaware<br />
Reserve and was ceded to <strong>the</strong> United States on May 30, 1860.<br />
The first land occupied or claimed in Kansas by citizens of <strong>the</strong> United State, after passage of <strong>the</strong><br />
Kansas-Nebraska act was within <strong>the</strong> present limits of Leavenworth City. Because of its close<br />
proximity to Missouri, which was a pro-slavery state, conflicts and controversy sometimes led to<br />
bloodshed.<br />
In 1863, <strong>the</strong> Kansas State Penitentiary was approved to be built in Lansing by <strong>the</strong> legislature.<br />
Due to lack of funding because of <strong>the</strong> Civil War, <strong>the</strong> penitentiary was not outfitted with prisoners<br />
until 1868.<br />
In 1875, Fort Leavenworth was chosen as <strong>the</strong> site for a military prison. This ‘early’ prison<br />
housed more than 300 prisoners in a remodeled, supple-depot building. In 1896 it was<br />
recommended <strong>the</strong> current ‘prison’ be replaced and Congress authorized a new federal<br />
penitentiary. Interesting to note that in 1897, Warden French marched prisoners every morning<br />
two and a half miles from Ft. Leavenworth to <strong>the</strong> new site of <strong>the</strong> federal penitentiary to work.<br />
This work went on for two and a half decades. In 1903 <strong>the</strong>re was enough space under <strong>the</strong> new<br />
roof to permit <strong>the</strong> first 418 prisoners to move into <strong>the</strong> new penitentiary. By 1906 all prisoners<br />
were housed at <strong>the</strong> new facility.<br />
Notable explorers to Leavenworth County were Lewis and Clark as well as Daniel Boone.<br />
2.73
2.3.1 Leavenworth County Geography/Topography<br />
Leavenworth is located in <strong>the</strong> nor<strong>the</strong>astern portion of <strong>the</strong> State of Kansas. Bounded on <strong>the</strong><br />
north by Atchison County, nor<strong>the</strong>ast by <strong>the</strong> Missouri River (which serves to separate Kansas<br />
from Missouri), <strong>the</strong> east by Wyandotte County and on <strong>the</strong> south by <strong>the</strong> Kansas River (which<br />
separates it from Johnson County and Douglas County), and <strong>the</strong> west by Douglas and Jefferson<br />
counties.<br />
Leavenworth County lies totally within <strong>the</strong> Glaciated Region of <strong>the</strong> Central Lowlands<br />
physiographic province. The glaciated region is characterized by rolling hills and scattered<br />
deposits of rocks and boulders transported from o<strong>the</strong>r geographic areas as glacial debris.<br />
The Missouri River lies in <strong>the</strong> nor<strong>the</strong>ast corner of <strong>the</strong> county, with <strong>the</strong> Kansas River in <strong>the</strong><br />
extreme sou<strong>the</strong>rn portion. The Stranger Creek basin is <strong>the</strong> most significant of <strong>the</strong> Kansas River<br />
tributaries and drains nearly <strong>the</strong> entire county from north to south. The Missouri River and its<br />
tributaries drain <strong>the</strong> nor<strong>the</strong>astern corner of <strong>the</strong> County. In <strong>the</strong> northwest corner lies <strong>the</strong> highest<br />
point of <strong>the</strong> county at 1,550 feet above sea level and <strong>the</strong> lowest point of 680 feet above sea<br />
level is located along <strong>the</strong> sou<strong>the</strong>rn and eastern edges of <strong>the</strong> county.<br />
The four river basins that hold Leavenworth County are <strong>the</strong> Missouri River Drainage Basin,<br />
Lower Kansas River Drainage Basin, Lower Republican River Drainage Basin, and <strong>the</strong><br />
Independence/Sugar Creek River Drainage Basin. Along with <strong>the</strong> 34 streams and creeks<br />
located within <strong>the</strong> county, it’s 9 lakes, and river boundaries, Leavenworth has an issue with<br />
flooding. Specifically, w<strong>here</strong> it abuts <strong>the</strong> border of <strong>the</strong> Missouri River.<br />
Following is a map of <strong>the</strong> Leavenworth County planning area:<br />
2.74
Figure 2.6. Leavenworth County Planning Area<br />
2.75
2.3.2 Leavenworth County Climate<br />
The average rainfall in Leavenworth County is 38.6 inches per year, with <strong>the</strong> national average<br />
being 36.5. Average snowfall is 14.8 inches per year, with <strong>the</strong> national average being 25<br />
inches.<br />
T<strong>here</strong> are approximately 218 sunny days in <strong>the</strong> county. The average July high is 90 degrees,<br />
and <strong>the</strong> average January low is 18.1. The comfort index, which is based on humidity during <strong>the</strong><br />
hot months is a 32 out of 100, with <strong>the</strong> national average being 44 out of a 100 – higher values<br />
being more comfortable.<br />
The aforementioned climate statistics do not account for <strong>the</strong> severe drought that <strong>the</strong> State of<br />
Kansas has been in for 2 years. As of <strong>the</strong> end of 2012, Leavenworth County was down 16.45<br />
inches of precipitation, and for year 2012 <strong>the</strong>y were down 6.55 inches from <strong>the</strong> average.<br />
2.3.3 County Population/Demographics<br />
According to <strong>the</strong> U.S. Census Bureau, <strong>the</strong> total population of Leavenworth County in 2010 was<br />
76,227. The population in <strong>the</strong> County has increased over <strong>the</strong> past decade by 10.97%. Table<br />
2.35 below shows <strong>the</strong> population trends for <strong>the</strong> participating jurisdictions within Leavenworth<br />
County:<br />
Table 2.35.<br />
Leavenworth County Jurisdiction Population<br />
Jurisdiction 2007 Population 2010 Population Difference 2000 –<br />
Leavenworth City 35420 35,251 (169)<br />
Lansing City 10,705 11,265 560<br />
Fairmount Township 4,191 8,788 4,597<br />
Tonganoxie City 2,728 4,996 2,268<br />
Basehor City 2,238 4,613 2,375<br />
High Prairie Township 1,939 2,002 63<br />
Kickapoo Township 1,928 1,770 (158)<br />
Reno Township 1,293 1,398 105<br />
Delaware Township 1,027 1,019 (8)<br />
Alexandria Township 1,019 882 (137)<br />
Linwood City 374 375 1<br />
Easton City 362 253 (109)<br />
Bonner Springs (pt) 8 6 (2)<br />
Unincorporated 10,395 3,609 (6786)<br />
Total County 73,628 76,227 2,599<br />
2.76
Bonner Springs’ jurisdictional profile is included under <strong>the</strong> Wyandotte County section and <strong>the</strong> De<br />
Soto profile is included under <strong>the</strong> Johnson County profile.<br />
In Table 2.36 are Census Bureau demographic and social characteristics for Jurisdictions within<br />
Johnson County.<br />
Table 2.36.<br />
Leavenworth County Jurisdictional Demographics<br />
Jurisdiction White % Black or<br />
African<br />
American<br />
Hispanic/Latin<br />
(Any Race) (%)<br />
Average Per<br />
Household<br />
(people)<br />
Leavenworth 84.9 9.7 6.0 2.67 28.7<br />
Leavenworth 74.5 15.1 8.1 2.56 29.6<br />
Lansing City 80.2 13.2 5.1 2.93 29.7<br />
Fairmont 94.8 1.8 3.1 2.73 NA<br />
Tonganoxie 95.2 1.0 3.8 2.6 22.2<br />
Basehor City 94.1 2.5 3.6 2.63 16.2<br />
High Prairie 94.5 1.3 2.4 2.72 NA<br />
Kickapoo 95.8 .7 1.5 2.64 NA<br />
Reno 95.6 .9 2.8 2.66 NA<br />
Delaware 93.4 1.0 1.8 2.79 NA<br />
Alexandria 96.4 .3 1.1 2.75 NA<br />
Linwood City 92.5 0 6.9 2.70 10.3<br />
Easton City 98.8 .4 1.2 2.64 8.0<br />
Total County 84.9 9.7 6.0 2.67 28.7<br />
Bachelor<br />
Degree or<br />
Higher (%)<br />
According to <strong>the</strong> U.S. Census Bureau, by gender breakdown, males represent 53.1 percent of<br />
<strong>the</strong> population, and females represent 46.9 percent of <strong>the</strong> population.<br />
2.3.4 County Economics<br />
INDUSTRY Estimate %<br />
Civilian employed population 16 years and over 31,931 74.7<br />
Agriculture, forestry, fishing and hunting, and mining 326 1.0<br />
Construction 2,648 8.3<br />
Manufacturing 2,359 7.4<br />
Wholesale trade 701 2.2<br />
Retail trade 3,713 11.6<br />
Transportation and warehousing, and utilities 1,875 5.9<br />
Information 636 2.0<br />
Finance and insurance, and real estate and rental and leasing 2,204 6.9<br />
Professional, scientific, and management, and administrative and waste management 2,705 8.5<br />
Educational services, and health care and social assistance 7,630 23.9<br />
2.77
INDUSTRY Estimate %<br />
Arts, entertainment, and recreation, and accommodation and food services 2190 6.9<br />
O<strong>the</strong>r services, except public administration 1371 4.3<br />
Public administration 3573 11.2<br />
Industry-wise, Leavenworth County employs more individuals in education services, health care<br />
and social assistance than any o<strong>the</strong>r class at 23.9 percent. Coming in second at 11.6 percent is<br />
retail trade followed closely by public administration at 11.2 percent. Occupation-wise, <strong>the</strong><br />
county is heavily weighted in <strong>the</strong> management, business, science, and arts at 36.0 percent. A<br />
distant second is <strong>the</strong> sales and office occupations, <strong>the</strong>n service occupations. Rounding out <strong>the</strong><br />
bottoms occupations is production, transportation, <strong>material</strong> moving, and natural resources,<br />
construction , and maintenance. The chart below shows <strong>the</strong> top four employments by<br />
occupation percentages for Leavenworth County, rounded:<br />
12%<br />
40%<br />
Management, Business,<br />
science, and arts<br />
Service<br />
29%<br />
Sales and Office<br />
19%<br />
Production &<br />
Transportation<br />
Private wage and salary workers make up 69.9% of <strong>the</strong> class of workers, with Government<br />
coming in second at 24.7%. Self-employed workers in unincorporated business is 5.1%..<br />
2.3.5 Leavenworth County Capabilities<br />
The mitigation capabilities are profiled in <strong>the</strong> following section and include: organizational<br />
structure; staff, fiscal, and technical resources; adopted plans, policies, and regulations, if any.<br />
2.78
Overview<br />
The jurisdiction of Leavenworth County includes all unincorporated areas within <strong>the</strong> County<br />
boundaries. Leavenworth County has sufficient staff and organizational resources to inititate<br />
and complete hazard mitigation strategies. The following are <strong>the</strong> capabilities:<br />
County Commissioners County Clerk Treasurer Register of Deeds<br />
County Attorney Sheriff Noxious Weed and Solid Waster<br />
Health Department County Coroner Council on Aging District Court<br />
Public Works Juvenile Services Emergency Medical Svs<br />
Extension Agent GIS Information Technology<br />
Emergency Management Planning and Zoning Appraiser<br />
Land Use and Development Trends<br />
As depicted in <strong>the</strong> regional information section, Leavenworth is growing at a steady rate. Since<br />
2000, <strong>the</strong> population has grown by 10.97%, which affects construction, employment, services,<br />
and all o<strong>the</strong>r aspects of <strong>the</strong> economy. Because of its urban and rural footprint, it is attractive to<br />
young adults and <strong>the</strong> elderly who are entering retirement and/or want to be closer to advanced<br />
medical facilities. Leavenworth County is not growing at as fast a pace as some of its nearby<br />
counties, however, it has grown marginally. Leavenworth County is also home to Fort<br />
Leavenworth, which is a planning factor in <strong>the</strong> county through development and land use.<br />
Technical and Fiscal Resources<br />
Leavenworth County is included in <strong>the</strong> definition of <strong>the</strong> Metro Region, and along with that<br />
nomenclature, it has <strong>the</strong> resources to fund staff resources in planning, engineering, floodplain<br />
management, storm water management, emergency management, and GIS services. Table<br />
2.37 depicts Leavenworth County personnel resources in 2013.<br />
Table 2.37. Leavenworth County Administrative and Technical Resources<br />
Personnel Resources Filled(?) Department/Position<br />
Building Code Official No Do have a code enforcement Officer<br />
Building Inspector<br />
No<br />
Mapping Specialist (GIS) Yes<br />
Engineer<br />
Yes<br />
Development Planner<br />
Yes<br />
Public Works Official Yes Public Works<br />
Emergency Management Yes Emergency Management & Homeland Security<br />
NFIP Floodplain Administrator Yes Emergency Management<br />
2.79
Personnel Resources Filled(?) Department/Position<br />
Bomb Squad<br />
Arson Squad<br />
Emergency Response Team<br />
Hazardous Materials Expert<br />
Local Emergency Planning<br />
Committee<br />
County Emergency Management<br />
Commission<br />
Sanitation Department<br />
Transportation Department<br />
Economic Development<br />
Department<br />
Housing Department<br />
Historic Preservation<br />
Yes<br />
Yes<br />
No<br />
Yes<br />
Yes<br />
No<br />
Yes<br />
Yes<br />
Yes<br />
No<br />
No<br />
Have a community partners committee<br />
Fiscally, Leavenworth County has a wide array of funding sources that could help <strong>the</strong>m to<br />
achieve <strong>the</strong> goals of <strong>the</strong>ir mitigation actions. These include:<br />
• Capital improvement Project Funds<br />
• Levy Taxes for specific purposes<br />
• Fees for water, sewer, gas, or electric services (sewer connection fees)<br />
• Impact fees for new development (transportation and roads)<br />
• Debt through Special Tax Bonds<br />
• Withhold spending in hazard prone areas (by board only).<br />
Existing Plans and Policies<br />
The following table lists <strong>the</strong> plans and policies that exist in Leavenworth County:<br />
Table 2.38. Leavenworth County Plans and Policies<br />
Element In Use, Yes, No, N/A Comments<br />
Planning Capabilities<br />
Comprehensive Plan<br />
Yes<br />
Capital Improvement Plan<br />
Yes<br />
City Emergency Operations Plan<br />
N/A<br />
County Emergency Operations<br />
Yes - 2011<br />
Plan<br />
Local Recovery Plan<br />
No<br />
County Recovery Plan No Do have a COOP plan<br />
Debris Management Plan Yes – 2011 Fema approved<br />
Economic Development Plan<br />
No<br />
2.80
Element In Use, Yes, No, N/A Comments<br />
Planning Capabilities<br />
Transportation Plan<br />
Yes<br />
Land-use Plan<br />
Yes<br />
Flood Mitigation Assistance<br />
No<br />
(FMA) Plan<br />
Watershed Plan Yes Stream studies on Stranger<br />
Creek and 5 mile creek<br />
Firewise or o<strong>the</strong>r fire mitigation<br />
plan<br />
Critical Facilities Plan<br />
No<br />
No<br />
O<strong>the</strong>r Mitigation Activities<br />
Leavenworth County is proactive in its stance for programs that alleviate <strong>the</strong> threat of hazards,<br />
whe<strong>the</strong>r natural, man-made, or technological. The following table depicts various programs that<br />
<strong>the</strong> County uses as a mitigation tool:<br />
Policies/Ordinance<br />
Zoning Ordinance<br />
Building Code<br />
Floodplain Ordinance<br />
Subdivision Ordinance<br />
Tree Trimming Ordinance<br />
Storm Water ordinance<br />
Drainage Ordinance<br />
Site Plan Review Requirements<br />
Historic Preservation Ordinance<br />
Landscape Ordinance<br />
Wetlands/Riparian Areas<br />
Conservation Plan<br />
Yes<br />
No<br />
Yes<br />
Yes<br />
N/A<br />
Yes<br />
Yes<br />
Yes<br />
No<br />
No<br />
No<br />
Leavenworth County has numerous studies, reports, and maps so <strong>the</strong>y know what <strong>the</strong>ir hazards<br />
and vulnerabilities are.<br />
Table 2.39. Leavenworth County Studies/Reports/Maps<br />
Element In Use, Yes, No, N/A Comments<br />
Studies/Reports/Maps<br />
Hazard Analysis/Risk<br />
Assessment (County)<br />
Yes<br />
2.81
Evacuation Route Map<br />
Yes<br />
Critical Facilities Inventory<br />
Yes<br />
Vulnerable Population Inventory Yes Through MARC<br />
Land Use Map<br />
Yes<br />
2.3.6 Critical Facilities:<br />
An essential component of this Mitigation Plan is <strong>the</strong> inventory and identification of Leavenworth<br />
County’s critical facilities. The objective of <strong>the</strong> critical facilities inventory is to maintain<br />
information on buildings and support infrastructure that are vital to <strong>the</strong> response and recovery<br />
from a disaster in <strong>the</strong> community. While it is important to reduce or eliminate risks to various<br />
sites throughout Leavenworth County, <strong>the</strong>re are several types of structures that should be<br />
prioritized because damage to <strong>the</strong>se critical facilities can delay recovery, impact <strong>the</strong> delivery of<br />
vital services, cause greater damages to o<strong>the</strong>r sectors of <strong>the</strong> county, or can put special<br />
populations at risk. For <strong>the</strong>se reasons, emphasis on planning and protection of critical facilities<br />
is a priority for this mitigation plan. Leavenworth County’s critical facilities and infrastructure list<br />
and maps are contained in Appendix C.<br />
Utilities and Transportation<br />
Leavenworth-Jefferson Electric COOP and Westar Energy Corp. provide electricity to <strong>the</strong><br />
county. A map of <strong>the</strong>se entities is provided in Appendix C.<br />
Water<br />
The Leavenworth Water Department provides water for <strong>the</strong> Lan Del Water District (which<br />
includes <strong>the</strong> City of Lansing), and six rural water districts surrounding <strong>the</strong> city of Leavenworth.<br />
Water systems in <strong>the</strong> county include <strong>the</strong> City of Easton, Ft Leavenworth American Water Ent.<br />
Inc., Lan Del Water District, Lansing Correctional Facility, Leavenworth Co. Consolidated RWD<br />
1, Leavenworth Co. RWD 1, 10, 2, 5, 6, 7, 8, 9, Leavenworth Water Department, city of<br />
Linwood, Paradise park mobile home court, Public wholesale WSD 6, Suburban Water Co., <strong>the</strong><br />
City of Tonganoxie, and Heartland Community Church.<br />
Water treatment plants are operated by <strong>the</strong> Lansing Correctional Facility, City of Lansing, City of<br />
Leavenworth, City of Tonganoxie, and Leavenworth Water Works (Kansteiner Plant), Easton,<br />
Linwood, and Basehor, Ft. Leavenworth, and <strong>the</strong> US Federal Penitentiary.<br />
Telecommunications<br />
Telecommunications for Leavenworth County are provided by Sprint and AT&T. Appendix C<br />
contains a map that shows <strong>the</strong> telecommunications grids.<br />
2.82
Transportation<br />
T<strong>here</strong> are three Federal highways and four State highways that traverse Leavenworth County.<br />
Total estimated mileage for state and federal roadways in <strong>the</strong> county is 108.4 miles. The total<br />
estimated mileage for federal, state, and county roads is 1,455.8 miles.<br />
A map of this infrastructure can be <strong>found</strong> in Appendix C.<br />
2.3.7 O<strong>the</strong>r Assets<br />
The vulnerability of Leavenworth to disaster also involves inventorying <strong>the</strong> natural,<br />
historic, cultural, and economic assets of <strong>the</strong> county. This is important for <strong>the</strong> following reasons:<br />
• These types of resources warrant a greater degree of protection due to <strong>the</strong>ir unique and<br />
irreplaceable nature and contribution to <strong>the</strong> overall economy.<br />
• A proactive stance before a disaster strikes can potentially reduce <strong>the</strong> damages incurred.<br />
• The rules for reconstruction, restoration, rehabilitation, and/or replacement are often complex.<br />
• Loss of <strong>the</strong>se economic assets could potentially have severe impacts on a community and its<br />
ability to recover from disaster.<br />
• Historic resources: T<strong>here</strong> are 34 Leavenworth County properties on <strong>the</strong> National Register of<br />
Historic Places. Information on <strong>the</strong>se properties is provided below:<br />
• Abernathy Furniture Company, 200-210 Seneca St, Leavenworth, 2004<br />
• Angell, A.J., House, 714 S. Broadway, Leavenworth, 1977<br />
• Arch Street Historic District, Bounded by Arch, Pine, S. Second, and S. Third St,<br />
Leavenworth, 2002<br />
• Atchison, Topeka and Santa Fe Railroad Passenger Depot, 781 Shawnee St.,<br />
Leavenworth, 1986<br />
• Begley Bridge, 1 mi. W of jct with 227 th St, and roe Rd, 1.75 mi. NW of Millwood,<br />
Millwood, 2003<br />
• Biehler Barn, 2.5 mi N of Easton, Easton, 1999<br />
• Brewer, David J., House, 403 5 th Ave, Leavenworth, 1972<br />
• Burt, Nathaniel H., House, 400 Fifth Ave., Leavenworth, 1987<br />
• Carroll, Edward, House, 334 Fifth Ave., Leavenworth, 1986<br />
• Evans Site, Tonganoxie, 2004<br />
• Fort Leavenworth, Leavenworth, 1966<br />
• Fort Leavenworth National Cemetery, Fort Leavenworth, 1966<br />
• Harris, Senator William A., House, NW of Linwood on KS32, Linwood, 1974<br />
• Harvey, Fred, House, 624 Olive St., Leavenworth, 1972<br />
• Hollywood Theater, 401 Delaware St., Leavenworth, 1990<br />
• Hund School, 31874 179 th St., Leavenworth, 2000<br />
• Insley, Merritt, House, 602 Seneca St., Leavenworth, 1986<br />
• Lansing Man Archeological Site, Lansing, 1971<br />
• Leavenworth County courthouse, 300 Walnut St., Leavenworth, 2002<br />
2.83
• Leavenworth Downtown Historic District, Leavenworth, 2002<br />
• Leavenworth Historic Industrial District, Leavenworth, 2002<br />
• Leavenworth Public Library, 601 S. Fifth St., Leavenworth, 1986<br />
• North Broadway Historic District, Leavenworth, 2002<br />
• North Esplanade Historic District, 203 – 515 N. Esplanade, Leavenworth, 1982<br />
• Old Union Depot, 123 N. Esplanade, Leavenworth, 1982<br />
• Powers, David W., House, 2 mi NW of Leavenworth off US 73, Leavenworth, 1977<br />
• Quarry Creek Archeological Site, Leavenworth, 1973<br />
• Scott Site, Tonganoxie, 2004<br />
• South Esplanade Historic District, Leavenworth, 2002<br />
• Third Avenue Historic District, Leavenworth, 2002<br />
• Union Park Historic District, Leavenworth, 2002<br />
• Western Branch, National Home for Disabled Volunteer Soldiers, Leavenworth, 1999<br />
• Zacharias Site, Leavenworth, 1987<br />
• AXA Building, 205 S. 5 th St., Leavenworth, 1972<br />
2.3.8 Cities<br />
City of Leavenworth<br />
The City of Leavenworth is a semi-urban community,<br />
as well as <strong>the</strong> county seat. The City of Leavenworth’s<br />
government consists of a Mayor and five member<br />
Commission.<br />
Land Use and Development Trends<br />
According to <strong>the</strong> 2010 census, <strong>the</strong> City of<br />
Leavenworth has a population of 32,251 people, a<br />
gain of 167 people since 2007. The land area is 23.5<br />
square miles, with a population density of 1,372 people per square mile.<br />
Technical and Fiscal Resources<br />
The City of Leavenworth is a fully functioning entity and has all <strong>the</strong> technical resources typical of<br />
a city. The following table lists <strong>the</strong> staff and technical resources.<br />
Table 2.40. City of Leavenworth Technical Resources<br />
Personnel Resources Yes/No Comments<br />
Building Code Official Yes<br />
Building Inspector<br />
Yes<br />
GIS<br />
Yes<br />
Engineer<br />
Yes<br />
Development Planner Yes<br />
Public Works Official<br />
Yes<br />
Emergency Manager Yes County<br />
NFIP Floodplain<br />
Yes<br />
2.84
Administrator<br />
Economic Development<br />
Department<br />
Yes<br />
Following are <strong>the</strong> fiscal resources available for potential mitigation action funding:<br />
• Community Development Block Grants<br />
• Capital Improvements Funding<br />
• Taxes for Specific Purposes<br />
• Fees for water, sewer, gas, or electric services<br />
• Debt through General Obligation Bonds<br />
• Debt through Special tax Bonds<br />
• Debt through Private Activities<br />
Existing Plans and Policies<br />
• Comprehensive Plan<br />
• Capital Improvement Plan<br />
• City Emergency Operations Plan<br />
• County Emergency Operations Plan<br />
• Economic Development Plan<br />
• Land-use Plan<br />
• Watershed Plan<br />
• Critical Facilities Plan<br />
• Building Code<br />
• Floodplain Ordinance<br />
• Subdivision Ordinance<br />
• Site Plan Review Requirements<br />
•<br />
O<strong>the</strong>r Mitigation Activities<br />
Since <strong>the</strong> last plan, public education has continued on a variety of issues such as: fire safety,<br />
household preparedness, environmental education, and water use. The city continues to<br />
address <strong>the</strong> 3 Mile Creek re-mapping project, with <strong>the</strong> preliminary work complete. The City has<br />
also submitted an application for a floodwall for <strong>the</strong> Riverfront Community Center to FEMA<br />
Property Valuation<br />
Table 2.41 below depicts <strong>the</strong> appraised values from <strong>the</strong> 2013 Abstract of Appraised and<br />
Assessed Values report.<br />
2.85
Table 2.41. Appraised Property Valuation, 2013<br />
Appraised Property Valuation<br />
Building Type Real Estate Structures ($) Median Home Value<br />
(2011)($)<br />
Residential 899,088,010 123,100<br />
Agricultural 5,171,290<br />
Commercial/Industrial 152,264,180<br />
Not for Profit 233,470<br />
Total $1,056,756,950<br />
Source: Leavenworth County Assessor Office/U.S. Census Bureau<br />
City of Lansing<br />
The City of Lansing is <strong>the</strong> second largest city in<br />
Leavenworth County and is located approximately five<br />
miles south of <strong>the</strong> City of Leavenworth. Lansing is a<br />
semi-urban city.<br />
The City of Lansing’s government is made up of a<br />
Mayor and 8 member City Council, two from each<br />
ward. The Mayor is elected at large.<br />
Land Use and Development Trends<br />
According to <strong>the</strong> 2010 census, <strong>the</strong> City of Lansing has a population of 11,265 people, a gain of<br />
560 people since <strong>the</strong> 2007 census. The land area is 8.6 square miles, and <strong>the</strong> population<br />
density is 1,310 people per square mile. Primary growth is west and south of Lansing.<br />
Technical and Fiscal Resources<br />
The City of Lansing is a fully functioning entity and has all <strong>the</strong> technical resources typical of a<br />
city. Following are <strong>the</strong>se staff and technical resources:<br />
Table 2.42. City of Lansing Technical Resources<br />
Personnel Resources Yes/No Comments<br />
Building Code Official Yes<br />
Building Inspector<br />
Yes<br />
GIS<br />
Yes<br />
Engineer Yes Contract<br />
Development Planner Yes<br />
Public Works Official<br />
Yes<br />
Emergency Manager<br />
No<br />
NFIP Floodplain<br />
Yes<br />
Administrator<br />
Economic Development<br />
Department<br />
Yes<br />
2.86
The following are <strong>the</strong> fiscal resources that can be used to fund potential mitigation activities:<br />
• Capital Improvements Funding<br />
• Taxes for Specific Purposes<br />
• Fees for sewer services<br />
• Impact Fees for New Development<br />
• Debt through General Obligation Bonds<br />
• Debt Through Special Tax Bonds<br />
Existing Plans and Policies<br />
• Comprehensive Plan<br />
• Capital Improvement Plan<br />
• Emergency Operations Plan<br />
• County Emergency Operations Plan<br />
• Transportation Plan<br />
• Land-use Plan<br />
• Zoning Ordinance<br />
• Building code<br />
• Floodplain Ordinance<br />
• Subdivision Ordinance<br />
• Storm Water Ordinance<br />
• Drainage ordinance<br />
O<strong>the</strong>r Mitigation Activities<br />
The City of Lansing has ongoing public education programs for water use, fire safety,<br />
environmental education, Community Rating System, flood awareness, flood safety, etc. The<br />
City also has a storm water detention requirement for new development that has been<br />
implemented.<br />
Property Valuation<br />
Table 2.43 below depicts <strong>the</strong> appraised values from <strong>the</strong> 2013 Abstract of Appraised and<br />
Assessed Values report.<br />
Table 2.43. Appraised Property Valuation, 2013<br />
Appraised Property Valuation<br />
Building Type Real Estate Structures ($) Median Home Value<br />
(2011)($)<br />
Residential 403,454,660 163,900<br />
Agricultural 6,966,620<br />
Commercial/Industrial 34,161,181<br />
Not for Profit 9,050<br />
Total $444,591,511<br />
Source: Leavenworth County Assessor Office/U.S. Census Bureau<br />
2.87
City of Tonganoxie<br />
The City of Tonganoxie is located<br />
approximately 19 miles southwest of <strong>the</strong><br />
City of Leavenworth. The government of<br />
Tonganoxie consists of one Mayor and<br />
five Council Members.<br />
Land Use and Development Trends<br />
According to <strong>the</strong> 2010 census,<br />
Tonganoxie has 4,996 residents, an increase of 2,268 people since 2007. The land area is 3.1<br />
square mile, and <strong>the</strong> population density is 1,611 people per square mile. The industrial park on<br />
<strong>the</strong> sou<strong>the</strong>ast section of <strong>the</strong> City is currently expected to grow. An expected expansion of <strong>the</strong><br />
Stone Creek neighborhood is also forecast. New development that is projected within <strong>the</strong> next<br />
five years includes a fire station at 825 E. 4 th Street in 2013, and a Chieftain Trail expansion.<br />
Technical and Fiscal Resources<br />
Tonganoxie is a small city that has <strong>the</strong> staff needed to oversee mitigation activities as well as<br />
day-to-day business. Following are <strong>the</strong> positions on staff:<br />
• Building Code Official<br />
• Building Inspector<br />
• Engineer<br />
• Development Planner<br />
• Public Works Official<br />
• Emergency Management Coordinator<br />
• NFIP Floodplain Administrator<br />
• County Emergency Management Commission<br />
The Fiscal resources that <strong>the</strong> City can use in order to fund mitigation activities, include:<br />
• The Community Development Block Grants<br />
• Capital Improvements Funding<br />
• Taxes for Specific Purposes<br />
• Fess for Water and Sewer Services<br />
• Fees for New Development<br />
• Debt through General Obligation Bonds<br />
• Debt Through Special Tax Bonds<br />
• Withhold Spending in Hazard Prone Areas<br />
Existing Plans and Policies<br />
• Comprehensive Plan<br />
• Capital Improvement Plan<br />
• County Emergency Operations Plan<br />
2.88
• County Recovery Plan<br />
• Economic Development Plan<br />
• Transportation Plan<br />
• Land-use Plan<br />
• Watershed Plan<br />
• Firewise or o<strong>the</strong>r fire mitigation Plan<br />
• Zoning Ordinance<br />
• Floodplain Ordinance<br />
• Subdivision Ordinance<br />
O<strong>the</strong>r Mitigation Activities<br />
The City of Tonganoxie continues with its public outreach programs such as <strong>the</strong> fire pup<br />
program for fire prevention. They have also received a firefighter grant through FEMA/DHS –<br />
critical facilities fire station upgrade generator and smoke exhaust removal. Ano<strong>the</strong>r grant in<br />
1993 allowed <strong>the</strong> city to do an acquisition of a mobile home park for flood mitigation.<br />
Property Valuation<br />
Table 2.44 below depicts <strong>the</strong> appraised values from <strong>the</strong> 2013 Abstract of Appraised and<br />
Assessed Values report.<br />
Table 2.44. Appraised Property Valuation, 2013<br />
Appraised Property Valuation<br />
Building Type Real Estate Structures ($) Median Home Value<br />
(2011)($)<br />
Residential 175,617,330 149,500<br />
Agricultural 1,627,430<br />
Commercial/Industrial 17,582,310<br />
Not for Profit 37,760<br />
Total $194,864,830<br />
Source: Leavenworth County Assessor Office/U.S. Census Bureau<br />
The City of Basehor<br />
Located approximately 14.5 miles south of<br />
Leavenworth, <strong>the</strong> City of Basehor’s government is<br />
comprised of a Mayor and five member city<br />
council.<br />
Land Use and Development Trends<br />
According to <strong>the</strong> 2010 census, Basehor has a<br />
population of 4,613 people, an increase of 2,375 people since 2007. Comprised of 6.68 square<br />
2.89
miles, <strong>the</strong> population density of Basehor is 691 people per square mile. The city has in<br />
development <strong>the</strong> plans for a new city hall and police station that includes a community room.<br />
Technical and Fiscal Resources<br />
Basehor is a small community that utilized <strong>the</strong> county for many of <strong>the</strong>ir technical resources such<br />
as <strong>the</strong> Emergency Management Coordinator and NFIP Floodplain Administrator.<br />
The Fiscal resources that <strong>the</strong> City can use in order to fund mitigation activities, include:<br />
• The Community Development Block Grants<br />
• Capital Improvements Funding<br />
• Taxes for Specific Purposes<br />
• Fees for Solid Waste and Sewer Services<br />
• Fees for New Development<br />
• Debt through General Obligation Bonds<br />
O<strong>the</strong>r Mitigation Activities<br />
The City of Basehor has developed plans to include a saferoom in <strong>the</strong>ir new city hall and police<br />
station when construction begins. This will be a community saferoom for <strong>the</strong> whole populace.<br />
Property Valuation<br />
Table 2.45 below depicts <strong>the</strong> appraised values from <strong>the</strong> 2013 Abstract of Appraised and<br />
Assessed Values report.<br />
Table 2.45. Appraised Property Valuation, 2013<br />
Appraised Property Valuation<br />
Building Type Real Estate Structures ($) Median Home Value<br />
(2011)($)<br />
Residential 267,178,900 Not Available<br />
Agricultural 3,103,160<br />
Commercial/Industrial 16,599,130<br />
Not for Profit 0<br />
Total $286,881,190<br />
Source: Leavenworth County Assessor Office/U.S. Census Bureau<br />
2.90
The City of Linwood<br />
The City of Linwood is located approximately 15 miles east of<br />
Lawrence, Kansas.<br />
Land Use and Development Trends<br />
The census of 2010 puts <strong>the</strong> population of Linwood at 375 people.<br />
The land area makes up .73 square miles, and <strong>the</strong> population<br />
density is 514 people per square mile. Growth in <strong>the</strong> City is fairly<br />
stagnant, making development a non issue.<br />
Technical and Fiscal Resources<br />
The City of Linwood has staff on its payroll to ensure mitigation projects have oversight. They<br />
are:<br />
• Building Code Official<br />
• Mapping Specialist (GIS)<br />
• Engineer<br />
• Public Works Official<br />
• Emergency Management Coordinator<br />
• NFIP Floodplain Administrator<br />
• Emergency Response Team<br />
Linwood also has financial resources available in order to help fund mitigation projects:<br />
• Community Development Block Grants<br />
• Capital Improvements Funding<br />
• Taxes for Specific Purposes<br />
• Fees for water, sewer, gas, or electric services<br />
• Debt through General Obligation Bond<br />
Existing Plans and Policies<br />
• Comprehensive plan<br />
• Capital Improvement Plan<br />
• City Emergency Operations Plan<br />
• County Emergency Operations Plan<br />
• Flood Mitigation Assistance Plan<br />
• Watershed plan<br />
• Firewise or o<strong>the</strong>r fire mitigation Plan<br />
• Critical Facilities Plan<br />
• Zoning Ordinance<br />
• Building Code<br />
• Floodplain Ordinance<br />
• Subdivision Ordinance<br />
2.91
O<strong>the</strong>r Mitigation Activities<br />
None<br />
Property Valuation<br />
Table 2.46 below depicts <strong>the</strong> appraised values from <strong>the</strong> 2013 Abstract of Appraised and<br />
Assessed Values report.<br />
Table 2.46. Appraised Property Valuation, 2013<br />
Appraised Property Valuation<br />
Building Type Real Estate Structures ($) Median Home Value<br />
(2011)($)<br />
Residential 7,913,120 Not Available<br />
Agricultural 476,350<br />
Commercial/Industrial 502,350<br />
Not for Profit 13,760<br />
Total $8,893,196<br />
Source: Leavenworth County Assessor Office/U.S. Census Bureau<br />
City of Easton<br />
Easton is located approximately 13.5 miles northwest of<br />
Leavenworth, and is mainly a rural area. It has a Mayor and<br />
City Council style of government.<br />
Land Use and Development Trends<br />
According to <strong>the</strong> 2010 census, Easton has a population of<br />
253 people, a decrease of 109 since 2007. The land area is<br />
0.1 square mile, and <strong>the</strong> population density is 10 per square<br />
mile. New development is not an issue since <strong>the</strong> population<br />
is decreasing.<br />
Technical and Fiscal Resources<br />
Easton is a small city and staffing is sparse. They do have a city clerk who also serves as <strong>the</strong><br />
NFIP Floodplain Administrator. The County supplements staffing services for <strong>the</strong> city.<br />
Fiscal resources are available to <strong>the</strong> City for funding of mitigation activities:<br />
• Community Development Block Grants<br />
• Capital Improvements Funding<br />
• Taxes for Specific Purposes<br />
• Fees for water, sewer, gas, or electric services<br />
2.92
• Debt through General Obligation Bonds<br />
• Debt through Special Tax Bonds<br />
• Debt through Private Activities<br />
Existing Plans and Policies<br />
• Floodplain Ordinance<br />
• National Flood Insurance Program<br />
O<strong>the</strong>r Mitigation Activities<br />
T<strong>here</strong> have been no mitigation activities since <strong>the</strong> last plan, however, <strong>the</strong> City of Easton is<br />
pursuing funding for a new water plant and <strong>the</strong> replacement of distribution lines.<br />
Property Valuation<br />
Table 2.47 below depicts <strong>the</strong> appraised values from <strong>the</strong> 2013 Abstract of Appraised and<br />
Assessed Values report.<br />
Table 2.47. Appraised Property Valuation, 2013<br />
Appraised Property Valuation<br />
Building Type Real Estate Structures ($) Median Home Value<br />
(2011)($)<br />
Residential 3,518,200 Not Available<br />
Agricultural 9,030<br />
Commercial/Industrial 587,380<br />
Not for Profit 0<br />
Total $4,114,610<br />
Source: Leavenworth County Assessor Office/U.S. Census Bureau<br />
2.3.9 Unified School Districts<br />
Leavenworth County has six Unified School Districts and <strong>the</strong> University of St. Mary’s. Following<br />
are <strong>the</strong> profiles for each one. Figure 2.7 on <strong>the</strong> next page shows <strong>the</strong> district lines.<br />
2.93
Figure 2.7. Leavenworth County Unified School Districts<br />
USD 207 Fort Leavenworth<br />
USD 207 serves Fort Leavenworth Army Post in<br />
Leavenworth County. Enrollment for <strong>the</strong> 2012 – 2013<br />
school year is 2,224 students. The district consists of<br />
three elementary schools, one middle school, and<br />
zero high schools.<br />
2.94
Technical and Fiscal Resources<br />
The school currently employs <strong>the</strong> following positions as technical resources for <strong>the</strong> purpose of<br />
this plan:<br />
• Full-time Building Official (Principle)<br />
Financial Resources available to <strong>the</strong> school district include:<br />
• Capital Improvements Project Funding<br />
• Local Funds<br />
• State and Federal Funds<br />
Existing Plans and Policies<br />
• Master Plan<br />
• Capital Improvement Plan<br />
• School Emergency Plan<br />
o Shelter in Place Protocols<br />
o Evacuation Protocols<br />
• Weapons Policy<br />
O<strong>the</strong>r Mitigation Activities<br />
USD 207 conducts fire drills monthly, annual trips to <strong>the</strong> local fire stations, in addition to tornado<br />
drills twice a year. The district also conducts lock-down security training for staff and students.<br />
The school district has installed emergency back-up generators at each of <strong>the</strong>ir buildings, and<br />
was approved for funding through FEMA for a safe room in <strong>the</strong>ir new school.<br />
Table 2.48. USD 207 Asset Inventory<br />
Asset Address Sq Feet Replacement<br />
Value<br />
(insured)<br />
Bradley<br />
Elementary<br />
School<br />
Eisenhower<br />
Elementary<br />
School<br />
1 Bradley<br />
Circle, Ft.<br />
Leavenworth,<br />
KS<br />
1 Eisenhower<br />
Circle, Ft<br />
Leavenworth,<br />
KS<br />
Contents<br />
Value<br />
Occupancy/Capacity<br />
#<br />
Hazards<br />
118,000 $20M $850K 644 Tornados,<br />
TSTM Wind<br />
2.95
USD 449 Easton<br />
USD 449 serves 117 square miles in Leavenworth County.<br />
Enrollment for <strong>the</strong> 2012 – 2013 school year is 668 students<br />
and consists of two elementary schools, one middle school,<br />
and one high school.<br />
Technical and Fiscal Resources<br />
The school currently employees <strong>the</strong> following positions as<br />
technical resources for <strong>the</strong> purpose of this plan:<br />
• Full-time Building Official – superintendent<br />
Financial resources available to <strong>the</strong> district to help fund mitigation activities include:<br />
• Capital Improvements Project Funding<br />
• Local Funds<br />
• General Obligation Bonds<br />
Existing Plans and Policies<br />
The following plans and policies are in place at USD 449:<br />
• Master Plan<br />
• Capital Improvement Plan<br />
• School Emergency Plan<br />
o Shelter in Place Protocols<br />
o Evacuation Protocols<br />
• Weapons Policy<br />
O<strong>the</strong>r Mitigation Activities<br />
USD 449 conducts fire and tornado drills once a month, in addition to lock-down security<br />
training for all staff and students. Also, <strong>the</strong> County Sheriff Office conducts emergency<br />
preparedness drills in all <strong>the</strong> schools.<br />
Table 2.49. USD449 Asset Inventory<br />
Asset Address Sq Feet<br />
Replacement<br />
Value (insured) Contents Value Occupancy/Capacity #<br />
Pleasant Ridge<br />
High School<br />
32500 Easton<br />
Rd. Easton, KS<br />
72,530 $9M $1.7M 275<br />
Pleasant Ridge<br />
Middle School<br />
32504 Easton<br />
Rd. Easton, KS<br />
50,000 $6.5M $800K 188<br />
2.96
Asset Address Sq Feet<br />
Replacement<br />
Value (insured) Contents Value Occupancy/Capacity #<br />
Pleasant Ridge<br />
Elementary<br />
20753 Easton<br />
Rd., Easton, KS<br />
60,892 $9.2M $1M 270<br />
Vocation<br />
Education Bldg<br />
Board of<br />
Education Office<br />
32501 Easton<br />
Rd., Easton, KS<br />
32502 Easton<br />
Rd., Easton, KS<br />
8,500 $1.2M $65K 30<br />
2,100 $78K $64K 3<br />
Total $25,978,000 $3,629,000 766<br />
USD 453 Leavenworth<br />
USD 453 services <strong>the</strong> City of Leavenworth. Enrollment for<br />
<strong>the</strong> 2012-2013 school year is 3,539 students and consists<br />
of four elementary schools, one intermediate school, one<br />
middle school, and one high school.<br />
Technical and Fiscal Resources<br />
The school district currently employs <strong>the</strong> following positions<br />
as technical resources for <strong>the</strong> purposes of this plan:<br />
• Full-time Building Official (Principal)<br />
• Emergency Manager (Director of Support Services)<br />
• Public Information Officer (Director of Public Relations)<br />
Financial resources available to <strong>the</strong> district to help fund mitigation activities include <strong>the</strong><br />
following:<br />
• Capital Improvements Project Funding<br />
• Local Funds<br />
• General Obligation Bonds<br />
• Private Activities/Donations<br />
• State and Federal Funds<br />
Existing Plans and Policies<br />
The plans and policies in place for USD 453 include <strong>the</strong> following:<br />
• Master Plan<br />
• Capital Improvement Plan<br />
• Weapons Policy<br />
• School emergency Plan<br />
o Shelter in place protocols<br />
o Evacuation protocols<br />
2.97
O<strong>the</strong>r Mitigation Activities<br />
Fire drills are conducted on a monthly basis. Tornado drills are conducted three times each<br />
year, and a Bus Evacuation drill is conducted once a year. In addition, USD 453 practices<br />
intruder drills and Emergency Medical drills. Lockdown security training is provided for staff and<br />
students, as well as ongoing public education for water use, fire safety, household<br />
preparedness and environmental education. All buildings are equipped with intercom systems<br />
and <strong>the</strong> newly renovated buildings have new alert tones included.<br />
O<strong>the</strong>r mitigation activities include new safe rooms being added to renovated buildings and a<br />
new elementary school.<br />
Asset Inventory<br />
Table 2.50. USD 453 Asset Inventory<br />
Asset Address Replacement Value (insured)<br />
High School 2012 10 th Ave 142,569,653<br />
West Junior High School 1901 Spruce 10,400,000<br />
Anthony Elementary 570 Evergreen 14,000,000<br />
David Brewer Elementary 401 N. 17 th St 14,000,000<br />
Lawson Elementary 820 N. 5 th St. 14,000,000<br />
Nettie Hartnett Elementary Bett<br />
1000 3 rd Ave 8,033,000<br />
Service Center<br />
401 S. 3 rd St 546,250<br />
Total 152,069,653<br />
USD 458 Basehor-Linwood<br />
USD 458 services <strong>the</strong> Cities of Basehor and Linwood.<br />
Enrollment for <strong>the</strong> 2012-2013 school year is 2,200 students<br />
and consists of four elementary schools, one middle school,<br />
and one high school.<br />
Technical and Fiscal Resources<br />
The school district currently employs <strong>the</strong> following positions as<br />
technical resources for <strong>the</strong> purpose of this plan:<br />
• Full-time Building Official (Principals)<br />
• Public Information Officer (District Office)<br />
The financial resources available to <strong>the</strong> district to help fund mitigation activities include <strong>the</strong><br />
following:<br />
• Capital Improvements Project Funding<br />
• Local Funds<br />
• Private Activities/Donations<br />
2.98
• State and Federal Funds<br />
Existing Plans and Policies<br />
The plans and policies in place for USD 458 include <strong>the</strong> following:<br />
• Weapons Policy<br />
• School Emergency Plan<br />
o Shelter in Place Protocols<br />
o Evacuation Protocols<br />
O<strong>the</strong>r Mitigation Activities<br />
Fire drills are conducted on a monthly basis, and tornado drills are performed 3 to 4 times per<br />
year. The district has a public address system and is equipped with NOAA wea<strong>the</strong>r radios.<br />
Lock-down security training is conducted for <strong>the</strong> staff and students.<br />
Table 2.51. USD458 Asset Inventory<br />
Asset Address Sq Feet<br />
Replacement<br />
Value (insured) Contents Value Occupancy/Capacity #<br />
Basehor-Linwood<br />
High School<br />
2108 N. 155 th St 130,000 $40M $1M 900<br />
Basehor-Linwood<br />
Middle School<br />
Basehor<br />
Elementary<br />
Basehor<br />
Intermediate<br />
Glenwood Ridge<br />
Elementary<br />
Linwood<br />
Elementary<br />
15900 Conley<br />
Road<br />
15602<br />
Leavenworth Rd.<br />
15241 Basehor<br />
Blvd.<br />
17550 157 th<br />
Terrace<br />
215 Park Street<br />
Linwood<br />
110,000 $25M $1M 750<br />
50,000 $15M $500K 415<br />
53,000 $15M $700K 400<br />
50,000 $15M $700K 400<br />
75,000 $12M $500K 200<br />
Total $122,000,000 $4,400,000 3065<br />
USD 464 Tonganoxie<br />
USD 464 serves <strong>the</strong> cities of Tonganoxie, and parts of<br />
Linwood, Basehor, Lawrence, and McLouth. Enrollment for<br />
<strong>the</strong> 2012-2013 school year is 1,999 students and consists of<br />
one elementary school, one middle school, and one high<br />
school that is divided between <strong>the</strong> east and <strong>the</strong> west.<br />
Technical and Fiscal Resources<br />
Currently <strong>the</strong> school has <strong>the</strong> following staffed positions as technical resources for <strong>the</strong> purpose of<br />
this plan:<br />
2.99
• Full-time Building Official (Principals)<br />
• Emergency Manager<br />
• Grant Writer<br />
Fiscal resources available to fund mitigation initiatives include:<br />
• Capital Improvements Project Funding<br />
• Local Funds<br />
• General Obligation Bonds<br />
• Special Tax Bonds<br />
• State and Federal Funds<br />
•<br />
Existing Plans and Policies<br />
The following plans and policies are currently in place at USD 464:<br />
• Master Plan<br />
• Capital Improvement Plan<br />
• Weapons Policy<br />
• School Emergency Plan<br />
o Shelter in Place Protocols<br />
o Evacuation Protocols<br />
O<strong>the</strong>r Mitigation Activities<br />
The school district conducts fire and tornado drills once a month in addition to conducting lockdown<br />
security training for all staff and students. They are equipped with a public address<br />
system, video surveillance, fire alarms, and do have wea<strong>the</strong>r radios.<br />
The school district is currently in <strong>the</strong> process of building a covered walkway between <strong>the</strong> east<br />
and west high school buildings.<br />
Table 2.52. USD 464 Asset Inventory<br />
Asset Address Sq Feet<br />
Replacement<br />
Value (insured) Contents Value Occupancy/Capacity #<br />
Tonganoxie<br />
Elementary<br />
304 Shawnee 72,236 $12.3M $2M 700<br />
High School West 300 24-40 Hwy 67,346 $11,4M $5.2M 325<br />
High School East 404 E. 24-40<br />
Hwy<br />
113,240 $19.3M $3.1M 340<br />
Middle School 824 Washington 75,841 $12.9M $4.2M 640<br />
Total $$55,900,000 $14,500,000 2005<br />
2.100
USD 469 Lansing<br />
USD serves 49 square miles in Leavenworth County.<br />
Enrollment for <strong>the</strong> 2012-2013 school year is 2,650<br />
students. The district has one elementary school, one<br />
middle school, and one high school.<br />
Technical and Fiscal Resources<br />
The school district currently employs <strong>the</strong> following<br />
positions as technical resources for <strong>the</strong> purpose of this<br />
plan:<br />
• Full-time building official (Principals)<br />
• Emergency Manager<br />
• Public Information Officer<br />
Financial resources that <strong>the</strong> district can potential use to fund mitigation activities include:<br />
• Contingency Funds<br />
Existing Plans and Policies<br />
• Master Plan<br />
• Capital Improvement Plan<br />
• Weapons Policy<br />
• School Emergency Plan<br />
o Shelter in Place Protocols<br />
o Evacuation Protocols<br />
O<strong>the</strong>r Mitigation Activities<br />
USD 469 conducts fire and tornado drills in accordance with state and municipal regulation.<br />
They rely on a variety of technology for emergency alerts such as <strong>the</strong> intercom, radios/buses,<br />
text, and <strong>the</strong> internet.<br />
Table 2.53. USD 469 Asset Inventory<br />
Asset Address Sq Feet<br />
Replacement<br />
Value (insured) Contents Value Occupancy/Capacity #<br />
Lansing High 220 Lion Lane, 125,000 $25.8M $1.6M 750<br />
School<br />
Lansing, KS<br />
Old HS & Int. 300 E. Olive, 44,545 $11.1M Leased to o<strong>the</strong>rs 228<br />
Bldg<br />
Lansing, KS<br />
Vocation<br />
220 Lion Lane, 2,000 $2.8M $26.4K 0<br />
Education Bldg. Lansing, KS<br />
District Office 200 E. Mary,<br />
Lansing KS<br />
15,327 $2.5M 162K 0<br />
2.101
Asset Address Sq Feet<br />
Replacement<br />
Value (insured) Contents Value Occupancy/Capacity #<br />
Special Education 210 E. Mary, 34,817 $5.2M 1.1M 0<br />
Leased by LV Co.<br />
Ext.<br />
Lansing KS<br />
613 Holiday<br />
Plaza, Lansing,<br />
2,800 $584.2K Leased to o<strong>the</strong>rs 0<br />
Lansing Middle<br />
School<br />
Industrial Bldg<br />
(Bus Barn)<br />
Lansing<br />
Elementary<br />
KS 509 W. Ida,<br />
Lansing, KS<br />
1102 Industrial<br />
St., Lansing, KS<br />
450 W. Mary St.,<br />
Lansing, KS<br />
128,000 $18.6M $1.4M 750<br />
25,000 $2.3M 0 0<br />
147,000 $20.9M $1.3M 900+<br />
Total $89,784,200 $5,588,400 2628+<br />
2.3.10 University of Saint Mary<br />
The University of Saint Mary serves Leavenworth<br />
and <strong>the</strong> surround communities. This is a private<br />
university that currently has 1,100 students enrolled<br />
for <strong>the</strong> 2012 – 2013 school year.<br />
Technical and Fiscal Resources<br />
The University currently employs <strong>the</strong> following<br />
positions as technical resources for <strong>the</strong> purpose of<br />
this plan:<br />
• Full-time Building Official (President)<br />
• Emergency Manager (Facilities/EHS Engineer)<br />
• Public Information Officer (Director of Marketing)<br />
Fiscal resources available to <strong>the</strong> University for <strong>the</strong> funding of mitigation activities include:<br />
• Capital Improvements Project Funding<br />
• Private Activities/Donations<br />
Existing Plans and Policies<br />
The University of Saint Mary has <strong>the</strong> following plans and policies currently in place:<br />
• Master Plan<br />
• Capital Improvement Plan<br />
• Weapons Policy<br />
• School Emergency Plan<br />
o Shelter in Place protocols<br />
o Evacuation Protocols<br />
2.102
O<strong>the</strong>r Mitigation Activities<br />
Fire evacuation drills are conducted quarterly and tornado sheltering exercises are conducted<br />
yearly for <strong>the</strong> staff and students who live in <strong>the</strong> two dorms. Campus-wide drills will also be<br />
conducted.<br />
Text alerts are utilized to alert staff and students during an emergency, as well as a phone alert<br />
system that is available to <strong>the</strong> two dorms. While <strong>the</strong> University does not hold lock-down security<br />
training, discussions are on-going about conducting some table-top exercises once <strong>the</strong><br />
Emergency Management Plan is updated this year.<br />
Table 2.54. University of Saint Mary Asset Inventory<br />
Asset Address Sq Feet<br />
Maria Hall 4100 S. 4 th St. 59,388<br />
Replacement Value<br />
(insured)<br />
Berkel Hall 4100 S. 4 th St. 28.500<br />
DePaul Library 4100 S. 4 th St. 38,086<br />
Miege Hall 4100 S. 4 th St. 50,176<br />
McGilley field House 4100 S. 4 th St. 29,725<br />
Ryan Sports Center 4100 S. 4 th St. 29,703<br />
Berchman’s Hall 4100 S. 4 th St. 73,100<br />
Saint Joseph Dining Hall 4100 S. 4 th St. 4,500<br />
Mead Hall 4100 S. 4 th St. 60,821<br />
Saint Mary Hall 4100 S. 4 th St. 33,975<br />
Xavier Hall 4100 S. 4 th St. 26,287<br />
Brooder House 4100 S. 4 th St. 800<br />
Total for all 435,061 sq ft $178,495,000<br />
2.103
2.4 Wyandotte County<br />
Wyandotte County History<br />
Wyandotte County is named after <strong>the</strong> Wyandot Indians, also known as <strong>the</strong> Huron by <strong>the</strong> French<br />
in Canada. The Wyandotte of today was once divided between Leavenworth and Johnson<br />
counties, much to <strong>the</strong> chagrin of <strong>the</strong> population that inhabited this land. Having little say in <strong>the</strong><br />
affairs of government and politics, and tired of <strong>the</strong> influx of Missourians, <strong>the</strong> people living in this<br />
area were determined to become <strong>the</strong>ir own political force.<br />
It was <strong>the</strong> Wyandotte Constitutional Convention that created Wyandotte County in 1859. This<br />
Constitutional Convention was a key event in <strong>the</strong> creation of <strong>the</strong> present Constitution of <strong>the</strong><br />
State of Kansas also. This Convention ensured that Kansas; became a state, was a state that<br />
was free from slavery, women were given some rights in voting and holding property, and<br />
Wyandotte County was created and established as a free and independent political entity.<br />
In 1997, Wyandotte County through a unanimous vote, consolidated <strong>the</strong> city and county<br />
governments to become <strong>the</strong> Unified Government of Wyandotte County/Kansas City, Kansas.<br />
2.4.1 Wyandotte County Geography/Topography<br />
The 143 square miles that make up Wyandotte County resides within <strong>the</strong> Kansas-Lower<br />
Republican basin. The planning area boast six major waterways which are <strong>the</strong> Kansas,<br />
Republican, Big Blue, Little Blue, Delaware, and Wakarusa Rivers. Streams and lakes cover 16<br />
square miles of Wyandotte County and include <strong>the</strong> Vermillion and Stranger creeks.<br />
Roughly triangular in shape, Wyandotte County lies principally between <strong>the</strong> Missouri and<br />
Kansas Rivers and is completely enveloped within <strong>the</strong> Glaciated Region. Leavenworth County<br />
borders it on <strong>the</strong> north and west, <strong>the</strong> Missouri River on <strong>the</strong> east, and to <strong>the</strong> south by Johnson<br />
County and <strong>the</strong> Kansas River.<br />
The uplands in <strong>the</strong> western part of <strong>the</strong> county are comprised of deeply dissected hills and are<br />
approximately 1,060 feet above sea level.. Steep slopes and breaks formed by differential<br />
erosion of limestone, shale, and sandstone lie along <strong>the</strong> Kansas River and its tributaries. The<br />
lower level of <strong>the</strong> county is 740 feet above sea level w<strong>here</strong> <strong>the</strong> Kansas and Missouri Rivers<br />
meet. Wyandotte County is <strong>the</strong> smallest county within <strong>the</strong> State of Kansas, yet boasts a hearty<br />
population of 157,505 people.<br />
The following is a map of <strong>the</strong> Wyandotte County planning area:<br />
2.104
Figure 2.8. Wyandotte County Planning Area<br />
2.4.2 Wyandotte County Climate<br />
The average rainfall is 37.1 inches per year as compared to <strong>the</strong> United States as a whole which<br />
is 36.5 per cent. Average snowfall is 18.2 inches per year, w<strong>here</strong>as <strong>the</strong> average for <strong>the</strong> United<br />
States is 25 inches per year. T<strong>here</strong> are approximately 89 days with some form of precipitation<br />
in <strong>the</strong> county for a given year. Sunny days make up 216 days per year with <strong>the</strong> average high in<br />
July being 89.9 degrees. The average January low is 20.7 degrees. The Comfort Index for<br />
Wyandotte County, with higher being more comfortable, is 33 out of a 100. The national<br />
average is 44. The aforementioned statistics do not take into account <strong>the</strong> recent drought that<br />
<strong>the</strong> whole State of Kansas has been under, since <strong>the</strong> numbers would be skewed if <strong>the</strong> drought<br />
years were included. As an example, Wyandotte County was 4.37 inches below average in<br />
precipitation for 2011, and 17.08 inches below normal for 2012.<br />
2.105
2.4.3 County Population/Demographics<br />
According to <strong>the</strong> U.S. Census Bureau, <strong>the</strong> total population of Wyandotte County in 2010 was<br />
157,505. The population between <strong>the</strong> 2000 and <strong>the</strong> 2010 census decreased by 377 people, or<br />
.24%. Table 2.34 belows shows <strong>the</strong> population trends for <strong>the</strong> participating jurisdictions that<br />
make up Wyandotte County:<br />
Table 2.34. Wyandotte County Jurisdictional Population/Demographics, 2000 to 2010.<br />
Jurisdiction 2000 Population 2010 Population Difference 2000 –<br />
2010<br />
Bonner Springs (pt) 6,767 7,314 547<br />
Edwardsville 4,146 4,340 194<br />
Kansas City 146,866 145,786 (1,080)<br />
Bal. of Wyandotte Co. 54 65 11<br />
Total County 157,882 157,505 (377)<br />
In Table 2.35 are <strong>the</strong> 2010 Census Bureau demographic and social characteristics for<br />
jurisdictions within Wyandotte County:<br />
Table 2.35. Wyandotte County Jurisdictional Demographics<br />
Jurisdiction White % Black or<br />
African<br />
Hispanic/Latin<br />
(Any Race) (%)<br />
Average<br />
Household<br />
Bonner Springs (pt) 84.8 5.4 10.8 2.70 27.8<br />
Edwardsville 86.6 6.0 7.3 2.55 10.1<br />
Kansas City 52.2 26.8 27.8 2.68 10.1<br />
Wyandotte Co. 67.6 25.1 26.7 2.71 15.2<br />
Source: U.S. Census Bureau (2010)<br />
Bachelor<br />
Degree or<br />
According to <strong>the</strong> U.S. Census Bureau for 2010, by gender breakdown, males represent 49.3%<br />
of <strong>the</strong> populations for Wyandotte County, and females represent 50.7%.<br />
2.4.4 County Economics<br />
Table 2.36 shows <strong>the</strong> industry trends for Wyandotte County:<br />
2.106
Table 2.36. Wyandotte County Economics<br />
INDUSTRY Estimate %<br />
Civilian employed population 16 years and over 68,067<br />
Agriculture, forestry, fishing and hunting, and mining 514 .8<br />
Construction 6,242 9.2<br />
Manufacturing 8,652 12.7<br />
Wholesale trade 1,775 2.6<br />
Retail trade 7,040 10.3<br />
Transportation and warehousing, and utilities 5,149 7.6<br />
Information 1,214 1.8<br />
Finance and insurance, and real estate and rental and leasing 3,957 5.8<br />
Professional, scientific, and management, and administrative and waste management 7,087 10.4<br />
Educational services, and health care and social assistance 13,628 20.0<br />
Arts, entertainment, and recreation, and accommodation and food services 5,960 8.8<br />
O<strong>the</strong>r services, except public administration 3,401 5.0<br />
Public administration 3,448 5.1<br />
Source: U.S. Census Bureau (2010)<br />
According to <strong>the</strong> data collected by <strong>the</strong> U.S. Census Bureau (2010), educational services, and<br />
health care and social assistance were <strong>the</strong> leading industries in Wyandotte County at 20%,<br />
followed by manufacturing by a distant second at 12.7%. Rounding out <strong>the</strong> bottom is<br />
agriculture at .8% of <strong>the</strong> workforce.<br />
By occupation, sales and office constitutes 24.8% of <strong>the</strong> sector, followed closely by<br />
management, business, science, and arts at 23.2%. Service occupations round out <strong>the</strong> top<br />
three at 20.3%. Last on <strong>the</strong> list are occupations dealing with natural resources, construction,<br />
and maintenance at 12.6% Production, transportation, and <strong>material</strong> moving occupations are<br />
second to last at 19%.<br />
Following is a chart that depicts <strong>the</strong> top four occupational fields within Wyandotte County:<br />
2.107
Sales & Office<br />
23%<br />
22%<br />
27%<br />
28%<br />
Management,Bus<br />
iness,Science,<br />
Arts<br />
Service<br />
Production/Trans<br />
portation,<br />
Material Moving<br />
2.4.5 Wyandotte Capabilities<br />
Mitigation capabilities are profiled in <strong>the</strong> following section and include: organizational structure,<br />
staff, fiscal, and technical resources; adopted plans, policies, and regulations, if any.<br />
As mentioned in <strong>the</strong> history of Wyandotte County, <strong>the</strong> county and city governments joined<br />
toge<strong>the</strong>r in 1997 to form <strong>the</strong> Unified Government of Wyandotte County, which services <strong>the</strong><br />
entire County for county level services and City level municipal services for <strong>the</strong> City of Kansas<br />
City, Kansas. For this reason Kansas City, Kansas will not be profiled separately from <strong>the</strong><br />
county in this plan. Currently, <strong>the</strong> Unified Government is staffed and managed by <strong>the</strong> following<br />
51 offices and departments:<br />
3-1-1 Call Center Economic Development Neighborhood Resource Center<br />
Air Quality Election Commissioner Operation Brightside<br />
Animal Control Emergency Management Parks and Recreation<br />
Appraiser Ethics Commission Police Department<br />
Area Agency on Aging Finance Property Management/Marketing<br />
Auto Licensing Fire Department Public Health Department<br />
Building Inspection<br />
Housing and Urban<br />
Redevelopment (Community<br />
Development)<br />
Public Relations Public Safety<br />
Business Office<br />
Business License Human Resources Public Works<br />
Code Enforcement Human Services Purchasing<br />
Commissioner’s Office K State Research & Extension Register of Deeds<br />
Community Policing Land Bank Rental Licensing<br />
County Administrator Legal Department Sheriff<br />
County Clerk’s Office Legislative Auditor's Office Technology<br />
2.108
Court Trustee Liveable Neighborhoods UG Transit<br />
Delinquent Real Estate Office Maps Urban Planning and Land Use<br />
District Attorney Mayor’s Office Water Pollution Control<br />
District Court Municipal Court Wyandotte County Museum<br />
Land Use and Development Trends<br />
Wyandotte County is <strong>the</strong> only county in Region L to lose a percentage of <strong>the</strong>ir population;<br />
however, it is unique due to its large Kansas City urban area, which tends to <strong>the</strong> industrial.<br />
While Wyandotte is <strong>the</strong> smallest county in Kansas, Kansas City makes up a large percentage of<br />
<strong>the</strong> county. The county must also deal with <strong>the</strong> Missouri and Kansas River flooding that can be<br />
problematic in some years. This occurred as recently as 2011 with <strong>the</strong> Missouri River flood<br />
which caused damage in Wyandotte County.<br />
While Wyandotte County has seen a decrease in population between <strong>the</strong> 2000 and 2010<br />
census, it continues to have housing gains. Whe<strong>the</strong>r <strong>the</strong> gains are due to aging homes being<br />
replaced by new construction, or <strong>the</strong> 2010 census not being an accurate reflection of <strong>the</strong><br />
population, housing has increased 1.3% during this 10 year time period. One area of immense<br />
growth is <strong>the</strong> Legends shopping area which is also home to a casino, speedway, Cabela’s, and<br />
Nebraska Furniture Mart. The Legends shopping area brings in consumers across Kansas and<br />
surrounding states as well.<br />
Technical and Fiscal Resources<br />
Planning, engineering, floodplain management and emergency management are fully staffed<br />
positions within <strong>the</strong> Unified Government. They have a 911 dispatch center as well as 76<br />
outdoor warning sirens. Table 2.37 depicts <strong>the</strong> Unified Government personnel resources in<br />
2013.<br />
Table 2.37. Personnel Resources<br />
Personnel Resources Yes/No Department/Position<br />
Planner/Engineer with knowledge<br />
of land development/land<br />
management practices<br />
Engineer/Professional trained in<br />
construction practices related to<br />
buildings and/or infrastructure<br />
Yes<br />
Yes<br />
Director of Planning<br />
County Engineer<br />
Planner/Engineer/Scientist with<br />
Yes<br />
County Engineer<br />
an understanding of natural<br />
hazards<br />
GIS Yes Director, Geo-Spatial Services<br />
Full time building official Yes Director, Neighborhood Resource<br />
Center<br />
2.109
Personnel Resources Yes/No Department/Position<br />
Floodplain Manager Yes Director of Planning<br />
Emergency Manager Yes Emergency Management<br />
Department<br />
Grant Writer Yes Director, Economic Development<br />
Fiscally, Wyandotte County has several funding resources that can potentially fund mitigation<br />
activities. The following is a list of <strong>the</strong>se resources:<br />
• Community Development Block Grants<br />
• Capital Improvements project funding<br />
• Authority to levy taxes for specific purposes<br />
• Fees for water, sewer, gas, or electric services<br />
• Authority for impact fees for new development<br />
• Ability to withhold spending in hazard prone areas<br />
• Ability to incur debt through general obligation bonds, special tax bonds, and private<br />
activities<br />
Existing Plans and Policies<br />
The following table list <strong>the</strong> plans and policies that exist within Wyandotte County:<br />
Element In Use, Yes, No, N/A Comments<br />
Planning Capabilities<br />
Comprehensive Plan Yes All 3 Cities<br />
Capital Improvement Plan Yes All 3 Cities<br />
County Emergency Operations<br />
Yes<br />
Plan<br />
Debris Management Plan Yes County<br />
Economic Development Plan<br />
No<br />
Flood Mitigation Assistance<br />
No<br />
(FMA) Plan<br />
Firewise or o<strong>the</strong>r Fire Mitigation<br />
No<br />
Plan<br />
Transportation Plan Yes County<br />
O<strong>the</strong>r Mitigation Activities<br />
Wyandotte County is proactive in its stance for programs that alleviate <strong>the</strong> threat of hazards, whe<strong>the</strong>r<br />
natural, man-made, or technological. The following table depicts various programs that <strong>the</strong> County uses<br />
as a mitigation tool:<br />
2.110
Policies/Ordinance<br />
Zoning Ordinance<br />
Yes<br />
Building Code Yes Varies by City<br />
Floodplain Ordinance Yes Varies by City<br />
Storm Water Ordinance Yes All 3 Cities<br />
Drainage Ordinance Yes All 3 Cities<br />
Site Plan Review Requirements Yes All 3 Cities<br />
Landscape Ordinance Yes All 3 Cities<br />
Historic Preservation Ordinance Yes Kansas City, KS<br />
Zoning/Land Use Restrictions<br />
Yes<br />
Tree Trimming Ordinance Yes Unitlity Contracts<br />
Wyandotte County has expended many resources into various studies, reports, and maps in<br />
order to illustrate what <strong>the</strong>ir hazards and vulnerabilities are.<br />
The following table represents some of <strong>the</strong>se:<br />
Element In Use, Yes, No, N/A Comments<br />
Studies/Reports/Maps<br />
Hazard Analysis/Risk Assessment Yes City<br />
Hazard Analysis/Risk Assessment Yes County<br />
Evacuation Route Map<br />
Yes<br />
Critical Facilities Inventory<br />
Yes<br />
Vulnerable Population Inventory<br />
Yes<br />
Land Use Map<br />
Yes<br />
2.4.6 Critical Facilities and Infrastructure<br />
An essential component of this Mitigation Plan is <strong>the</strong> inventory and identification of Wyandotte<br />
County’s critical facilities. The objective of <strong>the</strong> critical facilities inventory is to maintain<br />
information on buildings and support infrastructure that are vital to <strong>the</strong> response and recovery<br />
from a disaster in <strong>the</strong> community. While it is important to reduce or eliminate risks to various<br />
sites throughout Wyandotte County, <strong>the</strong>re are several types of structures that should be<br />
prioritized because damage to <strong>the</strong>se critical facilities can delay recovery, impact <strong>the</strong> delivery of<br />
vital services, cause greater damages to o<strong>the</strong>r sectors of <strong>the</strong> county, or can put special<br />
populations at risk. For <strong>the</strong>se reasons, emphasis on planning and protection of critical facilities<br />
is a priority for this mitigation plan. Wyandotte County’s critical facilities and infrastructure list<br />
are contained in Appendix C.<br />
2.111
2.4.7 O<strong>the</strong>r Assets<br />
O<strong>the</strong>r vulnerable assets in Wyandotte County involves <strong>the</strong> inventory of <strong>the</strong> natural, historic,<br />
cultural, and economic assets of <strong>the</strong> area. Some of <strong>the</strong> reasons this is so important is:<br />
• Due to <strong>the</strong>ir unique and irreplaceable footprint and <strong>the</strong>ir contribution to <strong>the</strong> overall<br />
economy.<br />
• A proactive stance to protect <strong>the</strong>m from damage should hazards be imminent.<br />
• Rules for reconstruction and restoration are complex.<br />
• Historic resources: T<strong>here</strong> are 35 Wyandotte County properties on <strong>the</strong> National Register<br />
of Historic Places. They are:<br />
o Argentine Carnegie Library, 28 th St. and Metropolitan Ave., Kansas City, 1986<br />
o Bonner Springs High School, 200 E. Third, Bonner Springs, 2002<br />
o Castle Rock, 852 Washington Blvd., Kansas City, 2000<br />
o Fairfax Hills Historic District, Kansas City, Kansas, 2007<br />
o Fire Station No. 9, 2 S. 14 th St., Kansas City, 1985<br />
o Gates, Judge Louis, House, 4146 Cambridge St., Kansas City, 1980<br />
o Granada Theater, 1013 – 1019 Minnesota Ave., Kansas City, 2005<br />
o Grinter Place, 1420 S. 78 th St., Muncie, 1971<br />
o H.W. Gates Funeral Home, 1901 Ola<strong>the</strong> Blvd, Kansas City, 2010<br />
o Hanover Heights Neighborhood Historic Drive, Kansas City, 1990<br />
o Huron Building, 905 N. 7 th St., Kansas City, 2000<br />
o Huron Cemetery, Minnesota Ave., Kansas City, 1971<br />
o KCK Hall and Fire Headquarters, 805 & 815 N. Sixth St., Kansas City, 1986<br />
o<br />
Lake of <strong>the</strong> Forest Historic District, KS 32, 9 mi. W. of Edwardsville, Bonner<br />
springs, 1996<br />
o Lowell Elementary School, 1040 Orville Ave., Kansas City, 2008<br />
o NE Junior High School, 400 Troup Ave, Kansas City, 2008<br />
o Quindaro Townsite, Kansas City, 2002<br />
o Rosedale WWI Memorial Arch, Kansas City, 1977<br />
o Sauer Castle, 945 Shawnee Dr., Kansas City, 1977<br />
o Schleifer-McAlpine House, 608 Splitlog Ave., Kansas City, 2007<br />
o Scottish Rite Temple, 803 N. 7 th St., Kansas City, 1985<br />
o Shafer, Theodore, House, 2518 N. 10 th St., Kansas City, 2000<br />
o Shawnee St. Overpass, NW of US35, Kansas City, 1984<br />
o Soldiers and Sailors Memorial Building, 600 N. 7 th St., Kansas City, 1985<br />
o St. Augustine Hall, 3301 Parallel Ave., Kansas City, 1971<br />
o St. Mary’s Church, 800 N. Fifth St., Kansas City, 1982<br />
o Sumner High School and Athletic Field, 1610 N. 8 th St., Kansas City, 2005<br />
o Trowbridge Archeological Site, Kansas City, 1971<br />
o Wes<strong>the</strong>ight Manor District, 18 th and 24 th Sts., Kansas City, 1975<br />
o Wes<strong>the</strong>ight Manor Historic District, Kansas City, 1982<br />
o White church Memorial Church & Delaware Indian Cemetery, Kansas City, 1982<br />
o Whitefea<strong>the</strong>r Spring, 3818 Ruby Ave., Kansas City, 1982<br />
o Williamson, Roy, House, 1865 Edwardsville Dr., Edwardsville, 2007<br />
2.112
Property Valuation<br />
o Wyandotte County Courthouse, 710 N. 7 th St., Kansas City, 2002<br />
o Wyandotte High School, 2500 Minnesota, Kansas City, 1986<br />
Table 2.)) below depicts <strong>the</strong> appraised values from <strong>the</strong> 2013 Abstract of Appraised and<br />
Assessed Values report for Kansas City, KS.<br />
Table 2.. Appraised Property Valuation, 2013, Kansas City, Kansas<br />
Appraised Property Valuation<br />
Building Type Real Estate Structures ($) Median Home Value<br />
(2011)($)<br />
Residential 3,122,017,860 93,300<br />
Agricultural 50,937,720<br />
Commercial/Industrial 1,078,387,860<br />
Not for Profit 2,421,240<br />
Total 4,253,764,680<br />
Source: Wyandotte County Assessor Office/U.S. Census Bureau<br />
2.4.7 Cities<br />
City of Bonner Springs<br />
Bonner Springs was <strong>the</strong> first commercial center and white<br />
settlement in Kansas in 1812. It is governed by a Mayor-<br />
Council-Manager form of government consisting of eight<br />
council members elected from four wards and a Mayor<br />
elected at large.<br />
Land Use and Development Trends<br />
Potential growth areas for <strong>the</strong> City are west of <strong>the</strong> city limits into Leavenworth County and <strong>the</strong><br />
nor<strong>the</strong>r portion of <strong>the</strong> City, north of 1-70. Because <strong>the</strong>re is no sewer to serve <strong>the</strong>se two areas, it<br />
will be many years before anything develops at ei<strong>the</strong>r location.<br />
Technical and Fiscal Resources<br />
Table 2. details staff resources for Bonner Springs:<br />
Personnel Resources Yes/No Comments<br />
Planner/Engineer with<br />
knowledge of land<br />
development/land<br />
management practices<br />
Yes<br />
City Planner<br />
2.113
Engineer/Professional<br />
trained in construction<br />
practices related to<br />
buildings and/or<br />
infrastructure<br />
Planner/Engineer/Scientist<br />
with an understanding of<br />
natural hazards<br />
Yes<br />
Yes<br />
Private – outsourced<br />
Project Manager Public<br />
Works Director<br />
GIS Yes Project Manager<br />
Public Works Director<br />
Full time building official Yes Building Official<br />
Floodplain Manager Yes City Planner<br />
Emergency Manager<br />
Yes<br />
Grant Writer<br />
No<br />
Financial tools that <strong>the</strong> city can potentially use to help fund mitigation activities include:<br />
• Taxes for Specific Purposes<br />
• Fees for Water, Sewer, or gas<br />
• Impact Fees for New Development<br />
• Debt through General Obligation Bonds<br />
• Withhold spending in Hazard Prone Areas<br />
• Debt through Special tax bonds<br />
Existing Plans and Policies<br />
Bonner Springs has <strong>the</strong> following plans and policies in place:<br />
• Master Plan<br />
• Zoning Ordinance<br />
• Subdivision Ordinance<br />
• Floodplain Ordinance<br />
• Stormwater Ordinance<br />
• Building Code<br />
• Fire Department ISO Rating 5<br />
• Site Plan Review Requirements<br />
• Local Emergency Operations Plan<br />
• Flood Insurance Study<br />
• Elevation Certificates<br />
• Comprehensive Plan<br />
O<strong>the</strong>r Mitigation Activities<br />
The City of Bonner Springs has seven outdoor warning sirens which are activated by <strong>the</strong> county<br />
Emergency Management Department Command Center. We have built a new library in <strong>the</strong><br />
past several years with a partially funded FEMA approved safe room. We purchased five<br />
homes that were in <strong>the</strong> flood plain with FEMA mitigation funds and put a walking trail across that<br />
location. Along Spring Creek, <strong>the</strong> city has done stabilization work due to its flood prone nature<br />
2.114
as well as constructed a bridge over Spring Creek at Kump Avenue which elimated an old,<br />
undersized culvert.<br />
Property Valuation<br />
Table 2.)) below depicts <strong>the</strong> appraised values from <strong>the</strong> 2013 Abstract of Appraised and<br />
Assessed Values report.<br />
Table 2.. Appraised Property Valuation, 2013<br />
Appraised Property Valuation<br />
Building Type Real Estate Structures ($) Median Home Value<br />
(2011)($)<br />
Residential 254,702,280 153,200<br />
Agricultural 6,394,810<br />
Commercial/Industrial 41,092,660<br />
Not for Profit 16,230<br />
Total 302,205,980<br />
Source: Wyandotte County Assessor Office/U.S. Census Bureau<br />
City of Edwardsville<br />
Located south of <strong>the</strong> Kansas Speedway adjacent to I-70<br />
and I-435, Edwardsville is governed by a<br />
Mayor/Council/Administrator form of governance.<br />
Land Use and Development Trends<br />
According to <strong>the</strong> 2010 census, <strong>the</strong> population of<br />
Edwardsville was 4,340, an increase of 194 people since<br />
<strong>the</strong> 2000 census was taken. Land are of <strong>the</strong> city is 9.2<br />
square miles, and population density is 472 people per square mile.<br />
Technical and Fiscal Resources<br />
The City of Edwardsville retains technical staff on contract for <strong>the</strong> positions of Building Code<br />
Official, Building Inspector, Development Planner and Public Works Official.<br />
Fiscal resources that <strong>the</strong> city can use to potentially fund mitigation activities are as follows:<br />
• Community Development Block Grants<br />
• Capital Improvements Funding<br />
• Taxes for Specific Purposes<br />
2.115
• Fees for Water, Sewer, Gas, or Electric Services<br />
• Debt through General Obligation Bonds<br />
• Debt through Special Tax Bonds<br />
• Debt through Private Activities<br />
Existing Plans and Policies<br />
The City of Edwardsville has <strong>the</strong> following plans and policies in place:<br />
• Comprehensive Plan<br />
• Land-use Plan<br />
• Zoning Ordinance<br />
• Building Code<br />
• Floodplain Ordinance<br />
• Subdivision Ordinance<br />
• Storm Water Ordinance<br />
• Site Plan Review Requirements<br />
• Codes Building Site/Design<br />
• National Flood Insurance Program<br />
O<strong>the</strong>r Mitigation Activities<br />
The City of Edwardsville has incorporated a safe room/storm shelter into its community center to<br />
protect its citizens from increment wea<strong>the</strong>r. They continue to participate in <strong>the</strong> NFIP, and also<br />
provide public education through various programs to include <strong>the</strong> Fire Alarm Program.<br />
Property Valuation<br />
Table 2.)) below depicts <strong>the</strong> appraised values from <strong>the</strong> 2013 Abstract of Appraised and<br />
Assessed Values report.<br />
Table 2.. Appraised Property Valuation, 2013<br />
Appraised Property Valuation<br />
Building Type Real Estate Structures ($) Median Home Value<br />
(2011)($)<br />
Residential 117,909,040 NA<br />
Agricultural 7,548,050<br />
Commercial/Industrial 61,432,410<br />
Not for Profit 0<br />
Total 186,889,500<br />
Source: Wyandotte County Assessor Office/U.S. Census Bureau<br />
2.116
2.4.8 Tribal<br />
Wyandotte Nation<br />
The Wyandotte Nation currently has approximately<br />
4,300 enrolled tribal members throughout <strong>the</strong> United<br />
States and has <strong>the</strong>ir headquarters in Wyandotte,<br />
Oklahoma. The Wyandotte Nation operates <strong>the</strong>ir<br />
housing authority as well as a tribal smoke shop,<br />
motor fuel outlets, truck stop, and three casinos. In<br />
Wyandotte County, Kansas, <strong>the</strong>y also own <strong>the</strong><br />
Scottish Rite Masonic Temple which was converted<br />
to <strong>the</strong> 7 th Street Casino located on trust land <strong>the</strong>y<br />
purchased. The Wyandotte National Burial Ground,<br />
also called <strong>the</strong> Huron Indian Cemetery, is nearby and<br />
<strong>the</strong> Wyandotte Nation has <strong>the</strong> legal authority of to preserve, protect, restore, and maintain.<br />
Technical and Fiscal Resources<br />
The Wyandotte Nation has a planner/engineer with land development and land management.<br />
Building construction is outsourced. They do staff GIS personnel, and have grant writing<br />
capabilities. The 7 th Street Casino security manager serves as <strong>the</strong> Emergency Manager.<br />
Fiscal Resource available to <strong>the</strong> Nation for potential mitigation projects include:<br />
• Community Development Block Grants<br />
• Taxes for Specific Purposes<br />
• Debt through General Obligation Bonds<br />
• Debt through Special Tax Bonds<br />
• Debt through Private Activities<br />
• Withhold Spending in Hazard Prone Areas<br />
Existing Plans and Policies<br />
The Wyandotte Nation has a master plan and a specific local emergency operations planned for<br />
<strong>the</strong> 7 th Street Casino.<br />
O<strong>the</strong>r Mitigation Activities<br />
None Reported<br />
Property Valuation<br />
Property Valuation for <strong>the</strong> Wyandotte Nation is not available for this planning period.<br />
2.117
2.4.9 Unified School Districts<br />
Wyandotte County has four Unified School Districts (USD), as well as a State School - <strong>the</strong><br />
Kansas School for <strong>the</strong> Blind in Kansas City. Turner USD 202, Piper USD 203, Bonner-<br />
Edwardsville USD 204, and Kansas City USD 500, as well as <strong>the</strong> Kansas School for <strong>the</strong> Blind<br />
are all participants of this plan update. Figure 2. Shows a map of <strong>the</strong> USD’s boundaries.<br />
Piper USD 203, Kansas City USD 500, and Turner USD 202 did not participate in this plan.<br />
2.118
Figure 2.9<br />
Unified School Districts of Wyandotte County<br />
Source: Kansas Data and Access Support Center, Wyandotte County/AIMS, Wyandotte Multi-jurisdictional Hazard<br />
Mitigation Plan, 2009.<br />
2.119
U.S.D. 204 Bonner-Edwardsville<br />
Bonner Springs and Edwardsville is serviced by USD 204. The enrollment for <strong>the</strong> 2012 – 2013<br />
school year was 2,500 students. The district has one high school, one middle school, three<br />
elementary schools, and an early childhood center.<br />
Technical and Fiscal Resources<br />
The Superintendent has <strong>the</strong> dual role of Emergency Manager for <strong>the</strong> district. Fiscal resource to<br />
help fund potential mitigation activities include a capital improvements project fund, local funds,<br />
general obligation bonds, private donations, and state and federal funds.<br />
Existing Plans and Policies<br />
The Bonner-Edwardsville school district has a master plan, school emergency plan, and a<br />
weapons policy.<br />
O<strong>the</strong>r Mitigation Activities<br />
The school district performs routine fire, tornado, and evacuation drills yearly. All school<br />
buildings are equipped with NOAA wea<strong>the</strong>r radios and public address systems in all<br />
classrooms.<br />
2.4.10. Kansas School for <strong>the</strong> Blind<br />
Since <strong>the</strong> last plan, <strong>the</strong> Kansas School for <strong>the</strong> Blind has merged with <strong>the</strong> School for <strong>the</strong> Deaf<br />
and is now <strong>the</strong> KSSB&D. For <strong>the</strong> purposes of this plan, <strong>the</strong> School for <strong>the</strong> Deaf is contained in<br />
Johnson County and <strong>the</strong> School for <strong>the</strong> Blind is contained within Wyandotte’s portion.<br />
The Kansas School for <strong>the</strong> Blind is located in Kansas City, Kansas on State Avenue and sets on<br />
approximately 10 acres. With approximately 88 staff members, <strong>the</strong> school serves 120<br />
blind/visually impaired children through 12 th grade. More than 300 students have access to<br />
KSSB Outreach Services. The school houses, feeds, provides health services, teaches, and<br />
provides outreach during <strong>the</strong> week for ten months out of <strong>the</strong> year.<br />
Technical and Fiscal Resources<br />
The Superintendent serves as <strong>the</strong> full-time building official and PIO. The Human Resources<br />
Director and Facilities Operations Manager serves as <strong>the</strong> Emergency manager with a team<br />
approach for emergencies. The KSSB can access capital improvements funds, state and<br />
2.120
federal funds with <strong>the</strong> approval of <strong>the</strong> state legislature for fiscal resource to fund potential<br />
mitigation activities.<br />
Existing Plans and Policies<br />
The School for <strong>the</strong> Blind has a master plan, a capital improvements plan, and a school<br />
emergency plan.<br />
O<strong>the</strong>r Mitigation Activities<br />
The KSSB provides fire safety, environmental education, and household preparedness as part<br />
of <strong>the</strong> curriculum. By law, <strong>the</strong> school conducts routine fire, tornado, and evacuation drills. The<br />
emergency alert system uses <strong>the</strong> phone lines. Any employee can access <strong>the</strong> emergency<br />
announcements. All buildings are equipped with NOAA wea<strong>the</strong>r radios.<br />
2.4.11 Kansas City, Kansas Community College<br />
Kansas City Kansas Community College is centrally located in Wyandotte County with 14 major<br />
buildings on <strong>the</strong> main campus. The average student enrollment per semester is approximately<br />
7,200 students.<br />
Technical and Fiscal Resources<br />
KCKCC has an Emergency Response Plan which details <strong>the</strong> warning and emergency<br />
notification system for faculty, staff, and students. The Director of Campus Police acts as an<br />
emergency manager, <strong>the</strong> Dean of Finance & Administration is <strong>the</strong> full-time building official, and<br />
<strong>the</strong> Director of College Advancement is <strong>the</strong> public information officer. Fiscal resources include a<br />
capital improvements project funds, local funds, general obligation bonds, special tax bonds,<br />
private donations, and state and federal funds.<br />
Existing Plans and Policies<br />
The college maintains a master plan, capital improvement plan, school emergency plan,<br />
disease containment plan, and a weapons policy.<br />
O<strong>the</strong>r Mitigation Activities<br />
None reported.<br />
Asset Inventory<br />
Located on Main Campus of 7250 State Ave:<br />
Baseball Office/Locker Room, Fieldhouse, Flint, Nursing, Math, Jewell, Performing Arts Center,<br />
Science, Henry Louis, Humanities, Library, Allied Health, Community Education Building, Print<br />
Shop, Conference Center, Child Care Center, Maintenance Building, Motorcycle Training<br />
Building, Lustrum House, Baseball and Softball Bathroom/Concession buildings.<br />
2.121
Located at 6565 State Avenue: The Dr. Thomas R. Burke Technical Education Building and<br />
Plaza.<br />
Located at 6736 State Avenue: The Dr. Thomas R. Burke Technical Education Auto Collision<br />
and Auto Mechanical Buildings, and student union.<br />
Total of replacement value insured: $180,700,000<br />
Total of Contents Value: $32,595,000<br />
Occupancy of all buildings: 7,965<br />
2.4.12 Medical Care Entities<br />
University of Kansas Hospital<br />
University of Kansas Hospital is a participating jurisdiction in this plan update.<br />
The community hospitals in Wyandotte County participate in <strong>the</strong> Kansas City Hospital<br />
Bioterrorism Preparedness Region which consists of Wyandotte, Johnson, and Leavenworth<br />
counties. The hospital region, as well as each community hospital receives funding from <strong>the</strong><br />
Kansas Department of Health and Environment’s Center for Public Health Preparedness as a<br />
part of <strong>the</strong> Health and Human Services (HHS) Hospital Preparedness Program (HPP) grant.<br />
The hospitals also participate in <strong>the</strong> Mid-America Regional Council (MARC) Regional Homeland<br />
Security Coordinating Committee Hospital Subcommittee. MARC serves counties in <strong>the</strong> Kansas<br />
City Metropolitan Area. Listed below are <strong>the</strong> participating hospitals in Wyandotte County:<br />
Rainbow Mental Health Facility employs 122 full time employees. They have 50 licensed beds,<br />
and 50 staffed beds. The admissions rate is 671 people per year. Some of <strong>the</strong> planning<br />
resources that <strong>the</strong> facility maintains are:<br />
• On Site Security<br />
• Capital Improvement Plan<br />
• Disease Outbreak Protocols<br />
• Pandemic Influenza Plan<br />
• Mass Prophylaxis Plan<br />
• Emergency Operations Plan<br />
The University of Kansas Hospital has approximately 4,599 full time employees. They have 644<br />
licensed beds, 508 staffed beds, and an admission rate of 19,992 people per year. Emergency<br />
room visits exceed 41,194. Planning resources <strong>the</strong> hospital maintains are:<br />
• On Site Security<br />
• Comprehensive Plan<br />
• Capital Improvement Plan<br />
• Disease Outbreak Protocols<br />
2.122
• Pandemic Influenza plan<br />
• Mass Prophylaxis Plan<br />
• Emergency Operations Plan<br />
University of Kansas Medical Center<br />
The University of Kansas Medical Center is located on Rainbow Boulevard in Kansas City, KS<br />
and is considered a campus of <strong>the</strong> University of Kansas. It offers educational programs through<br />
its Schools of Allied Health, Medicine, Nursing, and Graduate Studies. The campus is<br />
comprised of academic units operating alongside <strong>the</strong> University of Kansas Hospital, which<br />
provides opportunities for clinical experience and residency positions.<br />
Technical and Fiscal Resources<br />
The full-time building official is <strong>the</strong> Administration/Vice Chancellor of Administration. The Chief<br />
of Police for <strong>the</strong> University of Kansas Medical Center Police serves as <strong>the</strong> emergency manager.<br />
The Public Information Officer is <strong>the</strong> full-time Senior Director for Public Affairs.<br />
Financial tools available that could potentially be used to fund mitigation activities are:<br />
• Capital Improvements Project Funding<br />
• Debt through General Obligation Bonds<br />
• Debt through Special Tax Bonds<br />
• Private Activities/Donations<br />
• State and Federal Funds<br />
Existing Plans and Policies<br />
UKMC has established plans and policies. These include a Comprehensive Plan and a Hazard<br />
Awareness program.<br />
O<strong>the</strong>r Mitigation Activities<br />
The faculty and staff have annual safety training in order to keep up to date on evacuation and<br />
safety procedures.<br />
All campus buildings are equipped with ALERTUS alarm units. T<strong>here</strong> is also a wireless warning<br />
system called RAVE and a web-based system that can provide alert notifications via email.<br />
T<strong>here</strong> is a full police department that has authority “on property owned or operated by <strong>the</strong><br />
University, on <strong>the</strong> streets, property and highways immediately adjacent to <strong>the</strong> university, within<br />
<strong>the</strong> city limits (Kansas City, Kansas), with appropriate agreement by <strong>the</strong> local law enforcement<br />
agencies, and in any area (in Kansas) when a request for assistance has been made by <strong>the</strong> law<br />
enforcement officers from <strong>the</strong> area for which assistance is requested".<br />
The Medical Center is working towards an outdoor notification systems and an approved FEMA<br />
safe room.<br />
2.123
2.4.13 Drainage and Water Districts<br />
The Fairfax and Kaw Valley Drainage Districts, along with representatives from <strong>the</strong> Leavenworth<br />
Rural Water District #7 and WaterOne (Johnson Water District #1) participated in <strong>the</strong> planning<br />
process. The drainage district’s levee responsibilities are discussed in chapter 3 under <strong>the</strong> Dam<br />
and Levee Hazard.<br />
Fairfax Drainage District<br />
The Fairfax Drainage District (FDD) is located along <strong>the</strong> right bank of <strong>the</strong> Missouri River<br />
between river mile 367.9 and river mile 373.9. These river miles correlate approximately to<br />
levee stations 31+50 and 313+72, respectively.<br />
The FDD is responsible for routine maintenance and operation of <strong>the</strong> upstream portion of<br />
Kansas City’s flood control project that is designated as <strong>the</strong> Fairfax-Jersey Creek Unit. This<br />
Unit protects approximately 2,036 acres of developed and undeveloped industrial property in <strong>the</strong><br />
nor<strong>the</strong>ast corner of <strong>the</strong> City of Kansas City, KS. The Fairfax-Jersey Creek Levee Unit includes<br />
levees, floodwalls, stop log gap and riprap slope protection, drainage structures, pressure relief<br />
wells, seepage collection systems, interior drainage systems, <strong>the</strong> Jersey Creek box sewer, and<br />
eleven active pump stations.<br />
Technical and Fiscal Resources<br />
The FDD employs a General Manager, four maintenance and operations staff, and an<br />
administrative assistant. Governance is by three Board Members. The General Manager is a<br />
planner/engineer and also serves as <strong>the</strong> emergency manager in flood events.<br />
Financial tools and resources available for potential mitigation activities include:<br />
• Capital Improvements Funding<br />
• Taxes for Specific Purposes<br />
• Debt through General Obligation Bonds<br />
Existing Plans and Policies<br />
The FDD is a participating member of <strong>the</strong> NFIP, and maintains an Emergency Flood Plan that<br />
defines procedures for levee protection and sandbagging operations among o<strong>the</strong>r things.<br />
O<strong>the</strong>r Mitigation Activities<br />
The FDD provides annual information regarding drainage district matters via Fairfax Industrial<br />
Association luncheon meetings and newsletter. They are also regular participants in <strong>the</strong> Corps<br />
of Engineer sponsored flood fighting seminars. Improvements to <strong>the</strong> concrete floodwall at<br />
BPU/Quidero Power Plant are being planned for eventual construction in 2014-2015.<br />
2.124
Kaw Valley Drainage District<br />
The sou<strong>the</strong>rn portion of <strong>the</strong> Fairfax-Jersey Creek Levee Unit, Argentine Levee Unit, Armourdale<br />
Levee Unit, and Central Industrial District levee Unit are maintained by <strong>the</strong> Kaw Valley Drainage<br />
District (KVDD). Several of <strong>the</strong> flood protection facilities within <strong>the</strong> KVDD directly affect <strong>the</strong><br />
FDD’s operations. These facilities extend along <strong>the</strong> right bank of <strong>the</strong> Missouri River from<br />
Station 31+50 to near <strong>the</strong> mouth of <strong>the</strong> Kansas River. FDD and KVDD share responsibility for<br />
operation and maintenance of <strong>the</strong> Fairfax-Jersey Creek Unit.<br />
Technical and Fiscal Resources<br />
The KVDD has a General Manager and five maintenance and operations staff to manage <strong>the</strong>ir<br />
district. They are governed by a three Member Board. The General Manager also acts as <strong>the</strong><br />
emergency manager in flood events.<br />
Financial resources available for potential mitigation activities include:<br />
• Capital Improvements Project Funding via government Obligation Bonds<br />
• Debt through Special Tax Bonds such as No Fund Warrants<br />
Existing Plans and Policies<br />
The KVDD has a Flood Plan that includes emergency procedures for levee protection and<br />
sandbagging operations.<br />
O<strong>the</strong>r Mitigation Activities<br />
The KVDD annually provides flood protection updates to <strong>the</strong> Fairfax Industrial Association.<br />
Leavenworth Rural Water District #7<br />
RWD7 services <strong>the</strong> counties of Leavenworth and Wyandotte. They currently employ a<br />
mapping specialist and an engineer. Funding <strong>the</strong>y have available includes Capital<br />
Improvements Funds, Fees for water, sewer, gas, or electric services, impact fees for<br />
new development, debt through general obligation bonds, and special tax bonds.<br />
RWD 7 sends out responsible water use flyers as part of <strong>the</strong>ir mitigation activities. They<br />
currently have a new water district office at 142 nd St. and K-32 Hwy.<br />
2.125
2.4.14 Private Non-Profits<br />
The following private non-profit organizations participated in <strong>the</strong> planning process:<br />
• Boy Scouts of America, Camp Naish<br />
2.126
3 Risk Assessment<br />
44 CFR Requirement §201.6(c)(2): [The plan shall include] A risk assessment that<br />
provides <strong>the</strong> factual basis for activities proposed in <strong>the</strong> strategy to reduce losses from<br />
identified hazards. Local risk assessments must provide sufficient information to enable<br />
<strong>the</strong> jurisdiction to identify and prioritize appropriate mitigation actions to reduce losses<br />
from identified hazards.<br />
The risk assessment identifies and profiles hazards that are relevant to Region L as <strong>the</strong>y pertain<br />
to lives, property, and infrastructure. The goal is to estimate <strong>the</strong> potential for loss of life,<br />
personal injury, property damage or loss, and economic loss from a hazard event. This<br />
assessment encourages communities within Johnson, Leavenworth, and Wyandotte to<br />
understand <strong>the</strong>ir potential risk, and to help <strong>the</strong>m develop and prioritize mitigation actions that<br />
can reduce <strong>the</strong>se risks in future hazard events.<br />
The Federal Emergency Management Agency (FEMA) defines risk assessment terminology as<br />
follows:<br />
• Hazard—A hazard is an act or phenomenon that has <strong>the</strong> potential to produce harm or o<strong>the</strong>r<br />
undesirable consequences to a person or thing.<br />
• Vulnerability—Vulnerability is susceptibility to physical injury, harm, damage or economic<br />
loss. It depends on an asset’s construction, contents and economic value of its functions.<br />
• Exposure—Exposure describes <strong>the</strong> people, property, systems, or functions that could be<br />
lost to a hazard. Generally, exposure includes what lies in <strong>the</strong> area <strong>the</strong> hazard could affect.<br />
• Risk—Risk depends on hazards, vulnerability, and exposure. It is <strong>the</strong> estimated impact that<br />
a hazard would have on people, services, facilities and structures in a community. It refers to<br />
<strong>the</strong> likelihood of a hazard event resulting in an adverse condition that causes injury or<br />
damage.<br />
• Risk Assessment—Risk assessment is <strong>the</strong> process of measuring <strong>the</strong> potential loss of life,<br />
personal injury, economic injury, and property damage resulting from hazards.<br />
The risk assessment in this 2013 plan update for Region L will reflect recent events, <strong>the</strong><br />
availability of new information, and a reevaluation of <strong>the</strong> hazards that threaten <strong>the</strong> region. This<br />
section will summarize Region L as a whole, followed by <strong>the</strong> counties of Johnson, Wyandotte,<br />
and Leavenworth. Only in <strong>the</strong> case of unique or varied hazards will any participating<br />
jurisdictions be assessed. The three parts to be covered in this chapter are:<br />
• Section 3.1 Hazard Identification identifies <strong>the</strong> hazards that threaten <strong>the</strong> planning area and<br />
describes why some hazards have been omitted from fur<strong>the</strong>r consideration.<br />
• Section 3.2 Hazard Profiles discusses <strong>the</strong> threat to <strong>the</strong> planning area and describes previous<br />
occurrences of hazard events and <strong>the</strong> probability of future occurrence.<br />
• Section 3.3 Vulnerability Assessment assesses <strong>the</strong> Region’s total exposure to natural<br />
hazards, considering critical facilities and o<strong>the</strong>r community assets at risk, and assessing<br />
growth and development trends. Hazards that vary geographically across <strong>the</strong> planning area<br />
3.1
are addressed in greater detail. This section includes an inventory of assets and estimates<br />
losses from <strong>the</strong> identified hazards.<br />
3.1 Hazard Identification<br />
Requirement §201.6(c)(2)(i): [The risk assessment shall include a] description of <strong>the</strong><br />
type…of all natural hazards that can affect <strong>the</strong> jurisdiction.<br />
The Planning Committee <strong>review</strong>ed data and discussed each of <strong>the</strong> 22 natural, man-made, and<br />
technological hazards identified in <strong>the</strong> State of Kansas Hazard Mitigation Plan (SHMP). It was<br />
noted that while fog was removed from <strong>the</strong> SHMP, civil disorder was added as its own entity.<br />
The Region L Planning Committee supports <strong>the</strong>se changes, agrees that all 22 hazards currently<br />
identified in <strong>the</strong> SHMP could affect <strong>the</strong> region and has modified its list of hazard profiles to<br />
match <strong>the</strong> State plan. The Planning Committee also noted that in previous plans, counties<br />
within Region L addressed slightly different lists of hazards; <strong>the</strong>se variations are identified in<br />
summaries for individual counties at <strong>the</strong> end of each hazard section.<br />
Profiled hazards, listed alphabetically, are:<br />
Agricultural Infestation Hailstorm Soil Erosion and Dust<br />
Civil Disorder Hazardous Materials Terrorism/Agro-Terrorism<br />
Dam and Levee Failure Land Subsidence Tornado<br />
Drought Landslide Utility/Infrastructure Failure<br />
Earthquake Lightning Wildfire<br />
Expansive Soils Major Disease Outbreak Windstorm<br />
Extreme Temperatures Radiological Winter Storm<br />
Flood<br />
The following natural hazards identified by FEMA are not included in this analysis because <strong>the</strong>y<br />
do not threaten Kansas: avalanche, coastal erosion, coastal storm, hurricane, tsunami and<br />
volcano.<br />
3.2
3.1.1 Methodology<br />
The first part of <strong>the</strong> risk assessment is an analysis of <strong>the</strong> overall risk for each hazard with a tool<br />
called <strong>the</strong> Calculated priority Risk Index (CPRI). The CPRI value is obtained by assigning a<br />
numerical ranking to each of four hazard characteristics, <strong>the</strong>n calculating an index value based<br />
on a weighting scheme. The characteristics, definitions of rankings and weighting scheme are<br />
presented below.<br />
Table 3.1 Calculated Priority Risk Index (CPRI)<br />
Characteristic<br />
Ranking<br />
Definition<br />
Probability*<br />
Event is probable within <strong>the</strong> calendar year<br />
Event has up to 1 in 1 year chance of occurring (1/1=100%)<br />
4 - Highly Likely<br />
History of events is greater than 33% likely per year<br />
Event is "Highly Likely" to occur<br />
Event is probable within <strong>the</strong> next three years<br />
Event has up to 1 in 3 years chance of occurring (1/3=33%)<br />
3 - Likely<br />
History of events is greater than 20% but less than or equal to 33% likely per year<br />
Event is "Likely" to occur<br />
Event is probable within <strong>the</strong> next five years<br />
Event has up to 1 in 5 years chance of occurring (1/5=20%)<br />
2 - Possible<br />
History of events is greater than 10% but less than or equal to 20% likely per year<br />
Event could "Possibly" occur<br />
Event is possible within <strong>the</strong> next 10 years<br />
Event has up to 1 in 10 years chance of occurring (1/10=10%)<br />
1 - Unlikely<br />
History of events is less than or equal to 10% likely per year<br />
Event is "Unlikely" but is possible of occurring<br />
Magnitude / Severity**<br />
Multiple deaths<br />
4 - Catastrophic Complete shutdown of facilities for 30 or more days<br />
More than 50% of property is severely damaged<br />
Injuries and/or illnesses result in permanent disability<br />
3 - Critical Complete shutdown of critical facilities for at least two weeks<br />
25–50% of property is severely damaged<br />
Injuries and/or illnesses do not result in permanent disability<br />
2 - Limited Complete shutdown of critical facilities for more than one week<br />
10–25% of property is severely damaged<br />
Injuries and/or illnesses are treatable with first aid<br />
Minor quality of life lost<br />
1 - Negligible<br />
Shutdown of critical facilities and services for 24 hours or less<br />
Less than 10% of property is severely damaged<br />
Warning Time<br />
4 Less Than 6 Hours<br />
3 6-12 Hours<br />
3.3
Characteristic<br />
Ranking<br />
Definition<br />
2 12-24 Hours<br />
1 24+ Hours<br />
Duration<br />
4 More Than 1 Week<br />
3 Less Than 1 Week<br />
2 Less Than 1 Day<br />
1 Less Than 6 Hours<br />
* Based on history, using <strong>the</strong> definitions given, <strong>the</strong> likelihood of future events is quantified.<br />
** According to <strong>the</strong> severity associated with past events or <strong>the</strong> probable worst case scenario possible in <strong>the</strong> state.<br />
Using <strong>the</strong> rankings described in Table 3.1, <strong>the</strong> following formula is used to determine each<br />
hazard’s CPRI.<br />
(Probability x .45) + (Magnitude/Severity x .30) + (Warning Time x .15) + (Duration x .10)=CPRI<br />
Based on <strong>the</strong>ir CPRI, <strong>the</strong> hazards were separated into three categories of planning significance:<br />
High (3.0-4.0), Moderate (2.0-2.95) and Low (1.1-1.95). These categories determin <strong>the</strong> level of<br />
analysis given to a hazard in subsequent <strong>the</strong> risk assessment process; <strong>the</strong>y do not suggest that<br />
a hazard would have only a limited impact. In order to focus on <strong>the</strong> most critical hazards, those<br />
assigned a level of high or moderate significance were given more extensive attention in <strong>the</strong><br />
remainder of this analysis (e.g., quantitative analysis or loss estimation), while those with a low<br />
planning significance were addressed in more general or qualitative ways.<br />
Hazards, and <strong>the</strong>ir corresponding CPRI ranking were <strong>review</strong>ed and verified by all members of<br />
<strong>the</strong> planning committee during <strong>the</strong> plan update. The hazard ranking was based on <strong>the</strong> CPRI for<br />
<strong>the</strong> Region as a whole, followed by <strong>the</strong> county. Table 3.2 indicates <strong>the</strong> ranking established by<br />
<strong>the</strong> Region using <strong>the</strong> method described above.<br />
Table 3.2 Region L Hazard Rankings<br />
Hazard Type Probability Magnitude Warning Time Duration CPRI<br />
Planning<br />
Significance<br />
Regional CPRI<br />
Tornado 4 4 4 1 3.70 High<br />
Flood 4 3 3 4 3.55 High<br />
Winter Storm 4 3 2 3 3.30 High<br />
Windstorm 4 2 3 2 3.05 High<br />
Utility/Infrastructure Failure 4 1 4 3 3.00 High<br />
Drought 4 2 3 4 2.95 Moderate<br />
Hazardous Materials 4 1 4 2 2.90 Moderate<br />
Lightning 4 2 2 1 2.80 Moderate<br />
3.4
Wildfire 4 1 4 1 2.80 Moderate<br />
Civil Disorder 2 4 4 1 2.80 Moderate<br />
Major Disease Outbreak 2 4 1 4 2.75 Moderate<br />
Hailstorm 4 1 2 1 2.65 Moderate<br />
Terrorism/Agro-terrorism 1 4 4 4 2.65 Moderate<br />
Extreme Temperatures 3 2 1 4 2.50 Moderate<br />
Agricultural Infestation 3 2 1 4 2.50 Moderate<br />
Expansive Soils 3 1 1 4 2.20 Moderate<br />
Dam and Levee Failure 1 3 3 3 2.10 Moderate<br />
Radiological 1 3 3 3 2.10 Moderate<br />
Landslide 1 2 4 1 1.75 Low<br />
Soil Erosion and Dust 2 1 1 4 1.75 Low<br />
Earthquake 1 2 4 1 1.75 Low<br />
Land Subsidence 1 1 3 2 1.40 Low<br />
Each hazard is profiled on a regional basis; distinctive local circumstances or conditions relative<br />
to <strong>the</strong> hazard are noted when appropriate.<br />
3.1.2 Disaster Declaration History<br />
Historical events of significant magnitude or impact can result in a Secretarial or Presidential<br />
Disaster Declaration. Disaster Declarations within Region L are provided in <strong>the</strong> tables below.<br />
Table 3.3 Presidential Declarations that Include Region L, 1967 – Present<br />
Declaration<br />
Number<br />
Declaration<br />
Date*<br />
Major Disaster Declarations<br />
4035<br />
1885<br />
09/23/2011<br />
(6/1-<br />
8/1/2011)<br />
03/09/2010<br />
(12/9/2009-<br />
1/8/2010)<br />
Disaster<br />
Description<br />
Counties Involved<br />
Disaster Cost<br />
Flooding Atchison, Doniphan, Leavenworth and Wyandotte $7,462,881<br />
Severe<br />
Winter<br />
Storms and<br />
Snowstorm<br />
Allen, Anderson, Atchison, Bourbon, Brown,<br />
Butler, Cherokee, Cheyenne, Clay, Cowley,<br />
Crawford, Decatur, Doniphan, Elk, Franklin,<br />
Gove, Graham, Greenwood, Jackson, Jefferson,<br />
Jewell, Labette, Linn, Logan, Lyon, Marshall,<br />
Miami, Morris, Nemaha, Neosho, Norton, Osage,<br />
Phillips, Pottawatomie, Rawlins, Republic, Riley,<br />
Shawnee, Sheridan, Wabaunsee, Wallace,<br />
Washington, Wilson, Woodson and Wyandotte<br />
$19,100,658<br />
3.5
Declaration<br />
Number<br />
Declaration<br />
Date*<br />
1741 02/01/2008<br />
1699<br />
1638<br />
1615<br />
1579<br />
1562<br />
1535<br />
1462<br />
5/6/2007<br />
(5/4/2007)<br />
4/14/2006<br />
(3/12-<br />
13/2006)<br />
11/21/2005<br />
(10/1-<br />
2/2005)<br />
2/8/2005<br />
(1/4-6/2005)<br />
09/30/2004<br />
(8/27-<br />
30/2004)<br />
8/3/2004<br />
(6/12-<br />
7/25/2004)<br />
5/6/2003<br />
(5/4-<br />
30/2003)<br />
Disaster<br />
Description<br />
Severe<br />
Winter<br />
Storms<br />
Severe<br />
Storms,<br />
Tornadoes,<br />
and<br />
Flooding<br />
Severe<br />
Storms,<br />
Tornadoes,<br />
and<br />
Straight-Line<br />
Winds<br />
Severe<br />
Storms and<br />
Flooding<br />
Severe<br />
Winter<br />
Storm,<br />
Heavy<br />
Rains, and<br />
Flooding<br />
Severe<br />
Storms,<br />
Flooding,<br />
and<br />
Tornadoes<br />
Severe<br />
Storms,<br />
Flooding,<br />
and<br />
Tornadoes<br />
Severe<br />
Storms,<br />
Tornadoes,<br />
and<br />
Flooding<br />
Counties Involved<br />
Atchison, Barber, Barton, Brown, Butler, Chase,<br />
Cherokee, Clark, Clay, Cloud, Comanche,<br />
Crawford, Dickinson, Doniphan, Edwards, Ellis,<br />
Ellsworth, Ford, Geary, Graham, Gove, Harvey,<br />
Hodgeman, Jackson, Jefferson, Jewell, Kingman,<br />
Kiowa, Labette, Leavenworth, Lincoln, Logan,<br />
Lyon, Marion, Marshall, McPherson, Miami,<br />
Mitchell, Morris, Nemaha, Osage, Osborne,<br />
Ottawa, Pawnee, Phillips, Pottawatomie, Pratt,<br />
Reno, Republic, Rice, Riley, Rooks, Rush,<br />
Russell, Saline, Sedgwick, Shawnee, Sheridan,<br />
Smith, Stafford, Thomas, Wabaunsee, Wallace,<br />
Washington, and Woodson.<br />
Barton, Brown, Chase, Cherokee, Clay, Cloud,<br />
Comanche, Cowley, Dickinson, Doniphan,<br />
Douglas, Edwards, Ellsworth, Harper, Harvey,<br />
Jackson, Kingman, Kiowa, Leavenworth, Lincoln,<br />
Lyon, Marshall, McPherson, Morris, Nemaha,<br />
Osage, Osborne, Ottawa, Pawnee, Phillips,<br />
Pottawatomie, Pratt, Reno, Rice, Riley, Saline,<br />
Shawnee, Smith, Stafford, Sumner, Wabaunsee,<br />
Washington<br />
Douglas, Wyandotte<br />
Atchison, Jackson, Jefferson, Leavenworth,<br />
Shawnee<br />
Anderson, Atchison, Barber, Brown, Butler,<br />
Chase, Chautauqua, Clark, Coffey, Comanche,<br />
Cowley, Crawford, Douglas, Elk, Franklin,<br />
Greenwood, Harper, Harvey, Jackson, Jefferson,<br />
Kingman, Kiowa, Leavenworth, Lyon, Marion,<br />
McPherson, Morris, Osage, Pratt, Reno, Rice,<br />
Sedgwick, Shawnee, Sumner, Wabaunsee,<br />
Woodson, Wyandotte<br />
Disaster Cost<br />
$359,557,345<br />
$117,565,269<br />
$6,233,044<br />
$10,286,064<br />
$106,873,672<br />
Douglas, Wyandotte $2,103,376<br />
Barton, Butler, Cherokee, Decatur, Ellis, Geary,<br />
Graham, Jewell, Labette, Lyon, Marion, Mitchell,<br />
Morris, Ness, Osborne, Pawnee, Phillips, Rooks,<br />
Rush, Russell, Shawnee, Sheridan, Smith,<br />
Thomas, Trego, Wabaunsee, Wallace, Woodson,<br />
Wyandotte<br />
Allen, Anderson, Cherokee, Crawford, Douglas,<br />
Haskell, Labette, Leavenworth, Meade, Miami,<br />
Neosho, Osage, Seward, Woodson, Wyandotte<br />
$12,845,892<br />
$988,056<br />
3.6
Declaration<br />
Number<br />
Declaration<br />
Date*<br />
Disaster<br />
Description<br />
Counties Involved<br />
Disaster Cost<br />
1402<br />
2/6/2002<br />
(1/29-<br />
2/15/2002)<br />
Ice Storm<br />
Allen, Anderson, Barber, Bourbon, Butler,<br />
Chautauqua, Cherokee, Coffey, Comanche,<br />
Cowley, Crawford, Douglas, Elk, Franklin,<br />
Greenwood, Harper, Jefferson, Johnson,<br />
Kingman, Kiowa, Labette, Leavenworth, Linn,<br />
Lyon, Miami, Montgomery, Neosho, Osage, Pratt,<br />
Sedgwick, Shawnee, Sumner, Wilson, Woodson,<br />
Wyandotte<br />
$60,185,754<br />
1258<br />
11/5/1998<br />
(10/30-<br />
11/15/1998)<br />
Severe<br />
Storms and<br />
Flooding<br />
Butler, Chase, Coffey, Cowley, Douglas, Franklin,<br />
Greenwood, Harper, Harvey, Johnson,<br />
Leavenworth, Lyon, Marion, Neosho, Saline,<br />
Sedgwick, Sumner, Wilson, Woodson, Wyandotte<br />
1254<br />
10/14/1998<br />
(10/1-<br />
10/8/1998)<br />
Severe<br />
Storms,<br />
Flooding,<br />
and<br />
Tornadoes<br />
Bourbon, Cherokee, Douglas, Franklin, Jackson,<br />
Jefferson, Johnson, Leavenworth, Linn, Seward,<br />
Wabaunsee, Wyandotte<br />
1000<br />
7/22/1993<br />
(6/28-<br />
10/5/1993)<br />
Flooding,<br />
Severe<br />
Storms<br />
Atchison, Barton, Brown, Chase, Cherokee, Clay,<br />
Cloud, Crawford, Dickinson, Doniphan, Douglas,<br />
Edwards, Ellis, Ellsworth, Geary, Graham,<br />
Harvey, Hodgeman, Jackson, Jefferson, Jewell,<br />
Johnson, Lane, Leavenworth, Lincoln, Lyon,<br />
Marion, Marshall, McPherson, Mitchell, Morris,<br />
Nemaha, Ness, Osage, Osborne, Ottawa,<br />
Pawnee, Pottawatomie, Reno, Republic, Rice,<br />
Riley, Rooks, Rush, Russell, Saline, Sedgwick,<br />
Shawnee, Sheridan, Smith, Stafford, Sumner,<br />
Thomas, Trego, Wabaunsee, Washington,<br />
Wyandotte<br />
$99,790,368<br />
539 9/20/1977<br />
Severe<br />
Storms,<br />
Flooding<br />
Atchison, Brown, Doniphan, Jackson, Jefferson,<br />
Johnson, Leavenworth, Nemaha, Shawnee,<br />
Wyandotte<br />
$4,041,566<br />
3.7
Declaration<br />
Number<br />
Declaration<br />
Date*<br />
Disaster<br />
Description<br />
Counties Involved<br />
Disaster Cost<br />
403 9/28/1973<br />
Severe<br />
Storms,<br />
Tornadoes,<br />
Flooding<br />
Atchison, Barber, Barton, Brown, Butler, Chase,<br />
Clay, Cloud, Coffey, Comanche, Cowley,<br />
Dickinson, Doniphan, Douglas, Edwards,<br />
Ellsworth, Franklin, Geary, Greenwood, Harper,<br />
Harvey, Jackson, Jefferson, Kingman, Kiowa,<br />
Leavenworth, Lincoln, Linn, Lyon, Marion,<br />
Marshall, McPherson, Miami, Morris, Nemaha,<br />
Osage, Ottawa, Pawnee, Pottawatomie, Pratt,<br />
Reno, Republic, Rice, Riley, Saline, Sedgwick,<br />
Shawnee, Stafford, Sumner, Wabaunsee,<br />
Washington, Woodson, Wyandotte<br />
$4,296,913<br />
378 5/2/1973<br />
Severe<br />
Storms,<br />
Flooding<br />
Atchison, Barber, Barton, Bourbon, Brown, Butler,<br />
Chautauqua, Cherokee, Clark, Coffey, Crawford,<br />
Dickinson, Doniphan, Douglas, Edwards,<br />
Ellsworth, Ford, Franklin, Gray, Greenwood,<br />
Harper, Harvey, Haskell, Hodgeman, Jackson,<br />
Jefferson, Kingman, Kiowa, Labette,<br />
Leavenworth, Lincoln, Linn, Lyon, Marion,<br />
Marshall, McPherson, Meade, Miami,<br />
Montgomery , Morris, Nemaha, Ness, Osage,<br />
Osborne, Ottawa, Pawnee, Pottawatomie, Pratt,<br />
Reno, Republic, Rice, Rush, Russell, Saline,<br />
Sedgwick, Seward, Shawnee, Stafford, Stevens,<br />
Sumner, Wabaunsee, Washington, Woodson,<br />
Wyandotte<br />
$1,954,624<br />
267 7/15/1969<br />
229 7/18/1967<br />
Tornadoes,<br />
Severe<br />
Storms,<br />
Flooding<br />
Tornadoes,<br />
Severe<br />
Storms,<br />
Flooding<br />
Allen, Anderson, Bourbon, Crawford, Dickinson,<br />
Douglas, Ellsworth, Franklin, Johnson,<br />
Leavenworth, Linn, Lyon, McPherson, Miami,<br />
Morris, Neosho, Osage, Saline, Woodson,<br />
Wyandotte<br />
Anderson, Atchison, Chase, Cloud, Coffey,<br />
Crawford, Doniphan, Douglas, Finney, Franklin,<br />
Harper, Jackson, Jefferson, Kingman,<br />
Leavenworth, Linn, Lyon, Marion, Miami, Mitchell,<br />
Nemaha, Ness, Osage, Pottawatomie, Republic,<br />
Washington, Wabaunsee<br />
$733,524<br />
$847,439<br />
Emergency Declarations<br />
3324 6/25/2011 Flooding<br />
3282 12/12/2007<br />
3236 9/1/0/2005<br />
Severe<br />
Winter<br />
Storms<br />
Hurricane<br />
Katrina<br />
Evacuation<br />
Atchison,<br />
Doniphan,<br />
Leavenworth and<br />
Wyandotte<br />
All<br />
All<br />
n/a<br />
n/a<br />
n/a<br />
Table 3.4 lists <strong>the</strong> U.S. Department of Agriculture Secretarial Disaster Declarations relevant to<br />
Region L for <strong>the</strong> period 2010 – 2012. Secretarial Disasters are designated from a natural<br />
disaster and require a minimum production loss of 30 percent for at least one crop.<br />
3.8
Table 3.4 USDA Secretarial Disaster Declarations for Region L<br />
Declaration<br />
Number<br />
Declaration<br />
Date<br />
S3313 07/24/2012<br />
S3302 07/17/2012<br />
Disaster<br />
Description<br />
Drought-Fast<br />
Track<br />
Drought-Fast<br />
Track<br />
S3299 04/1/2012 Drought and Heat<br />
S3209 12/08/2011<br />
Severe Storms,<br />
Thunderstorms,<br />
Hail & High Winds<br />
Counties Involved<br />
Primary: Atchison, Brown,<br />
Doniphan, Jackson,<br />
Contiguous: Jefferson,<br />
Leavenworth, Nemaha,<br />
Pottawatomie, Shawnee<br />
Primary: Chase, Dickinson,<br />
Douglas, Ellis, Ellsworth,<br />
Franklin, Geary, Jefferson,<br />
Johnson, Leavenworth, Lincoln,<br />
Marion, Miami, Mitchell, Morris,<br />
Ness, Osage, Osborne,<br />
Ottawa, Rush, Russell, Saline,<br />
Shawnee, Smith, Wabaunsee,<br />
Wyandotte; Contiguous:<br />
Anderson, Atchison, Barton,<br />
Butler, Clay, Cloud, Coffey,<br />
Greenwood, Harvey, Jackson,<br />
Jewell, Linn, Lyon, McPherson,<br />
Pawnee, Phillips,<br />
Pottawatomie, Rice, Riley,<br />
Rooks, Trego,<br />
Primary: Missouri counties,<br />
Contiguous: Atchison, Bourbon,<br />
Cherokee, Crawford, Doniphan,<br />
Johnson, Leavenworth, Linn,<br />
Miami, Wyandotte<br />
Primary: Missouri counties:<br />
Contiguous: Atchison,<br />
Doniphan, Leavenworth,<br />
Wyandotte<br />
S3186 10/14/2011<br />
S3189<br />
04/04/2011<br />
S3020 08/20/2010<br />
Drought &<br />
excessive heat<br />
Drought, High<br />
Winds & Excessive<br />
Heat<br />
Flood, Excessive<br />
Rain, High Winds<br />
Primary: Missouri counties;<br />
Contiguous: Atchison, Bourbon,<br />
Cherokee, Crawford, Johnson,<br />
Leavenworth, Linn, Miami,<br />
Wyandotte<br />
Primary: Franklin, Geary,<br />
Johnson, Miami, Morris, Osage,<br />
Riley, Shawnee, Wabaunsee;<br />
Contiguous: Anderson, Chase,<br />
Clay, Coffey, Dickinson,<br />
Douglas, Jackson, Jefferson,<br />
Leavenworth, Linn, Lyon,<br />
Marion, Marshall,<br />
Pottawatomie, Washington,<br />
Wyandotte<br />
Primary: Missouri counties;<br />
Contiguous: Atchison, Bourbon,<br />
Crawford, Doniphan, Johnson,<br />
Leavenworth, Linn, Wyandotte<br />
3.9
3.2 Hazard Profiles<br />
Requirement §201.6(c)(2)(i): [The risk assessment shall include a] description of<br />
<strong>the</strong>…location and extent of all natural hazards that can affect <strong>the</strong> jurisdiction. The plan<br />
shall include information on previous occurrences of hazard events and on <strong>the</strong><br />
probability of future hazard events.<br />
Each hazard profile describes <strong>the</strong> hazard’s location, extent, previous occurrences and <strong>the</strong><br />
probability of future events.<br />
Location: location is <strong>the</strong> geographic areas within <strong>the</strong> planning area that are affected by<br />
a hazard, such as a floodplain. Hazard areas may be fur<strong>the</strong>r defined, such as high<br />
landslide hazard areas versus low landslide hazard areas. The entire planning area may<br />
be uniformly affected by some hazards, such as drought or winter storm.<br />
Previous occurrences: previous occurrences document <strong>the</strong> number of events<br />
experienced within <strong>the</strong> planning area over a specified period of time. This information<br />
supports estimates of <strong>the</strong> probability of future events.<br />
Extent: extent is <strong>the</strong> strength or magnitude of <strong>the</strong> hazard. Extent can be described in a<br />
combination of ways depending on <strong>the</strong> hazard. Examples include established scientific<br />
scales or measurement systems such as <strong>the</strong> Enhanced Fujita Scale or <strong>the</strong> Richter<br />
Scale. Water depth or wind speed can also indicate <strong>the</strong> extent of various wea<strong>the</strong>r<br />
phenomena. Speed of onset or duration offer o<strong>the</strong>r options for characterizing a hazard.<br />
Probability of future events: Probability is <strong>the</strong> likelihood of a hazard occurring in <strong>the</strong><br />
future.<br />
Impact/Vulnerability: The impact and vulnerability of a hazard on a community and<br />
how it affects <strong>the</strong> people, economy and infrastructure. The impact of a hazard directly<br />
affects <strong>the</strong> vulnerability of <strong>the</strong> people, property, and environment, but so to does <strong>the</strong><br />
vulnerability determine <strong>the</strong> level of <strong>the</strong> impact.<br />
All profiles have been updated to include events that have occurred since <strong>the</strong> last plans were<br />
completed, amended to reflect any subsequent changes in probability and realigned to follow<br />
<strong>the</strong> organization of <strong>the</strong> SHMP. Profiles were fur<strong>the</strong>r updated with more historical impact<br />
information w<strong>here</strong> it was available. The vulnerability assessment and regional estimates of<br />
potential losses have been expanded, and statewide flood and earthquake losses have been<br />
quantified using HAZUS-MH. Resources used to compile <strong>the</strong>se profiles can be <strong>found</strong> in<br />
Appendix D.<br />
3.2.1 EMAP Consequence Analysis<br />
A consequence analysis of <strong>the</strong> potential for detrimental impacts of each hazard was conducted<br />
for <strong>the</strong> Emergency Management Accreditation Program (EMAP ). The analyses are included at<br />
<strong>the</strong> end of each hazard profile to support plan accreditation through that program.<br />
Each analysis addresses <strong>the</strong> following elements:<br />
• Impact on <strong>the</strong> Public:<br />
3.10
− Health and safety of persons in <strong>the</strong> area of <strong>the</strong> incident<br />
• Impact on Responders:<br />
− Health and safety of responders (i.e., firefighters, law enforcement, emergency<br />
management personnel, etc) in <strong>the</strong> area responding to <strong>the</strong> incident<br />
• Continuity of Operations:<br />
− Activation of <strong>the</strong> Continuity of Operations Plan – will organization need to relocate in<br />
order to fulfill duties<br />
• Delivery of Services:<br />
− Delivery of services such as food, medical, or any o<strong>the</strong>r life sustaining entities<br />
• Impact on Property, Facilities, and Infrastructure:<br />
− Damages to structures (private and public), utilities, treatment plants, electric grid,<br />
roads, bridges, etc.<br />
• Impact on <strong>the</strong> Environment:<br />
− How has <strong>the</strong> incident affected <strong>the</strong> surrounding environment, i.e., contamination (water ,<br />
soil or air), erosion, crop damage, etc.<br />
• Impact on <strong>the</strong> Economy:<br />
− Affects to <strong>the</strong> economy due to loss of revenue, clean up efforts, and reconstruction<br />
• Impact of <strong>the</strong> Public Confidence in <strong>the</strong> jurisdiction‘s governance<br />
− How has <strong>the</strong> hazard affected public confidence<br />
The Consequence Analysis includes ranking determinations for each of <strong>the</strong> above elements.<br />
The ranking elements are categorized as Minimal, Moderate, or Severe. The Hazard<br />
Identification and Risk Assessment portion of <strong>the</strong> Regional Mitigation Plan was used to<br />
ascertain prior damages in an effort to estimate ratings on future impacts. The ratings are meant<br />
to be a guide, and not all inclusive, due to <strong>the</strong> variances that could apply such as population,<br />
location, time, hazard type, and <strong>the</strong> amount of jurisdictions within <strong>the</strong> hazard area. For instance,<br />
an F5 tornado in Overland Park at 2:00 p.m. would have a greater impact than an F5 tornado in<br />
western Kansas at <strong>the</strong> same time but located in a set- aside field. Table 3.5 presents <strong>the</strong><br />
methodology for determination of <strong>the</strong> ranking level (minimal, moderate, or severe)<br />
Table 3.5. Methodology for Consequence Analysis Ranking Levels<br />
Impact On: Minimal Moderate Severe<br />
Public (people) < 5 = 5<br />
Responders (people)
Based on FEMA minimum<br />
disaster requirements<br />
Environment (%)
3.2.2 Agricultural Infestation<br />
Calculated Priority Risk Index<br />
2.50 Moderate<br />
Description<br />
Planning Significance<br />
Agricultural infestation is <strong>the</strong> naturally occurring infection of vegetation, crops or livestock with<br />
insects, vermin (to include lice, roaches, mice, coyote, fox, fleas, etc), or diseases that render<br />
<strong>the</strong> crops or livestock unfit for consumption or use. The levels and types of agricultural<br />
infestation will vary according to many factors, including cycles of heavy rains and drought. A<br />
certain level of agricultural infestation is normal; however, infestation becomes an issue when<br />
<strong>the</strong> level of an infestation escalates suddenly, or a new infestation appears, overwhelming<br />
normal control efforts. Infestation of crops or livestock can pose a significant risk to state and<br />
local economies due to <strong>the</strong> dominance of <strong>the</strong> agricultural industry.<br />
Onset of agricultural infestation can be rapid. Controlling an infestation’s spread is critical to<br />
limiting impacts through methods including quarantine, culling, premature harvest and/or crop<br />
destruction when necessary. Duration is largely affected by <strong>the</strong> degree to which <strong>the</strong> infestation<br />
is aggressively controlled, but is generally more than one week. Maximizing warning time is<br />
also critical for this hazard, and is most affected by methodical and accurate monitoring and<br />
reporting of livestock and crop health and vigor, including both private individuals and<br />
responsible agencies.<br />
Animal Disease<br />
One of <strong>the</strong> key concerns regarding this hazard is <strong>the</strong> potential introduction of a rapid and<br />
economically devastating foreign animal disease, such as foot and mouth disease and bovine<br />
spongiform encephalopathy (BSE) disease, to Kansas. Because Kansas is a major cattle state,<br />
with cattle raised locally as well as imported into <strong>the</strong> state, <strong>the</strong> potential for highly contagious<br />
diseases such as <strong>the</strong>se is a continuing, significant threat to <strong>the</strong> economy of <strong>the</strong> state. The loss of<br />
milk production, abortion, decrease in production, and o<strong>the</strong>r lasting problems resulting from an<br />
outbreak could cause continual and severe economic losses, as well as widespread<br />
unemployment. It would affect not only farmers, ranchers, and butchers, but also support and<br />
related industries<br />
The Kansas Department of Agriculture, Division of Animal Health monitors and reports on<br />
animal reportable diseases such as Avian Influenza, Bovine Spongiform Encephalopathy (BSE)<br />
Disease, Chronic Wasting Disease, Exotic Newcastle Disease, Foot and Mouth Disease,<br />
Johne’s Disease, PseudoRabies, Scrapie and West Nile Virus. Producers are required by state<br />
law to report any of <strong>the</strong> reportable animal diseases.<br />
3.13
Crop Pests/Diseases<br />
Many factors influence disease development in plants, including hybrid/variety genetics, plant<br />
growth stage at <strong>the</strong> time of infection, wea<strong>the</strong>r (e.g., temperature, rain, wind, hail, etc.), single<br />
versus mixed infections, and genetics of <strong>the</strong> pathogen populations.<br />
Field crops in Kansas are also subject to various types of infestation. Significant wheat crop<br />
losses because of <strong>the</strong>se diseases are well documented in various areas of Kansas. Sorghum<br />
losses can occur when a crop is infected with sooty stripe early in <strong>the</strong> growing season.<br />
Aspergillus Ear Rot (Alfatoxin) is a growing problem for corn crops.<br />
According to <strong>the</strong> Kansas Department of Agriculture, Plant Protection and Weed Control Division,<br />
<strong>the</strong> following are <strong>the</strong> highest risk crop pests to Kansas:<br />
• Corn – Aspergillus Ear Rot (Alfatoxin)<br />
• Soybean – Austro-Asian Rust<br />
• Wheat – Black Stem Rust, Blast – South American strains, Stripe Rust, Leaf Rust, Karnal<br />
Bunt<br />
Infestation is not only a risk to crops in <strong>the</strong> field, but insect infestation can also cause major<br />
losses to stored grain. It is estimated that damage to stored grain by <strong>the</strong> lesser grain borer, rice<br />
weevil, red flour beetle, and rusty grain beetle costs <strong>the</strong> United States about $500 million<br />
annually.<br />
Tree Pests<br />
According to <strong>the</strong> Kansas Department of Agriculture, Plant Protection and Weed Control Division,<br />
<strong>the</strong> following are <strong>the</strong> highest risk plant pests by host to Kansas:<br />
• Ash Trees – Emerald Ash Borer<br />
• Maple, Birch, Willow, Mimosa, Ash, Sycamore & Poplar Trees – Asian Longhorned<br />
Beetle<br />
• Walnut Trees – Thousand Cankers<br />
The Asian Longhorned Beetle is an exotic insect that threatens a wide variety of hardwood trees<br />
in Kansas. It is suspected that Asian Longhorned Beetle came to <strong>the</strong> U.S. via wood packing<br />
<strong>material</strong> from Asia. Tens of thousands of trees have been destroyed since it was first discovered<br />
in Brooklyn, New York in 1996. This beetle feeds on a wide variety of hardwood tree species<br />
that are native or planted in Kansas. It kills trees by creating large tunnels as larvae causing<br />
branches or stems to break and eventually lead to tree death. Because this beetle is not native<br />
to North America, it has no known natural enemies, and our trees have low resistance to this<br />
pest. While it has not been detected in Kansas, vigilance is paramount to prevention.<br />
The Thousand Cankers is newly recognized disease in 2008 and first noticed in <strong>the</strong> western<br />
U.S. Currently it is located in both <strong>the</strong> east and western parts of <strong>the</strong> U.S. It has not been<br />
3.14
detected in Kansas. This disease is caused by a combination of a fungus and <strong>the</strong> walnut twig<br />
beetle. The walnut twig beetles carries fungal spores, and when <strong>the</strong>y tunnel through <strong>the</strong> outer<br />
bark into <strong>the</strong> tree <strong>the</strong> fungus is transmitted during gallery construction. This has also been <strong>found</strong><br />
if <strong>the</strong> beetle “tastes” <strong>the</strong> tree and does not produce a gallery. The fungus kills an area under <strong>the</strong><br />
bark and <strong>the</strong> areas of dead tissue are called cankers. When <strong>the</strong> walnut twig beetles are<br />
abundant, numerous cankers can form and coalesce to girdle twigs and branches, restricting<br />
movement of water and nutrients. Black walnut, <strong>the</strong> most valuable native species to <strong>the</strong> state, is<br />
<strong>the</strong> most susceptible to this disease.<br />
Emerald ash borer is a pest of ash trees native to Asia. This pest is a slender, emerald green<br />
beetle that is ½ inch long, and responsible for <strong>the</strong> destruction of approximately 20 million ash<br />
trees in Indiana, Illinois, Iowa, Kentucky, Maryland, Michigan, Minnesota, Missouri, New York,<br />
Ohio, Pennsylvania, Tennessee, Virginia, West Virginia, Wisconsin and Ontario, Canada. In<br />
2012, it was detected in Kansas, Connecticut and Massachusetts. Financially, <strong>the</strong> United States<br />
risks an economic loss of $20 billion to $60 billion because of this pest. A complete devastation<br />
of ash trees could seriously affect our ecosystem.<br />
According to <strong>the</strong> Kansas Forest Action Plan, revised 2011 from Kansas State University, ash<br />
trees are <strong>the</strong> third most common species of trees <strong>found</strong> in <strong>the</strong> native woodlands of Kansas. The<br />
Thousand Cankers Disease has not yet been <strong>found</strong> in Kansas. However, <strong>the</strong>re are an estimated<br />
26.2 million black walnut (35.3 million cubic feet) and 56.1 million green and white ash (60.8<br />
million cubic feet) in Kansas rural and urban landscapes at risk. Most of <strong>the</strong>se trees occur in <strong>the</strong><br />
rural landscape (94 percent black walnut and 97 percent ash). It also estimates that <strong>the</strong>re are<br />
1.5 million ash trees in Kansas towns and cities.<br />
On August 29, 2012, <strong>the</strong> Emerald Ash Borer pest was confirmed at <strong>the</strong> Wyandotte County Lake<br />
in Wyandotte County, Kansas. Previously in July 2012, it had been detected in Parkville,<br />
Missouri which is four miles from <strong>the</strong> Wyandotte County line. Immediately after confirmation by<br />
USDA, <strong>the</strong> Kansas Secretary of Agriculture implemented an emergency intrastate quarantine for<br />
Wyandotte County.<br />
Figure 3.1 is a map of <strong>the</strong> Cooperative Emerald Ash Borer Project from <strong>the</strong> USDA, Animal and<br />
Plant Health Inspection Service. It shows <strong>the</strong> Federal Emerald Ash Borer (EAB) Quarantine and<br />
Authorized Transit areas as of October 1, 2012. Kansas is not shown as a Federal EAB<br />
Quarantine area. Neighboring Clay and Platte, Missouri counties are in <strong>the</strong> quarantine area.<br />
3.15
Figure 3.1 Map of Cooperative Emerald Ash Borer Project in <strong>the</strong> U.S. October 1, 2012<br />
Source: USDA, Animal and Plant Health Inspection Service<br />
http://www.aphis.usda.gov/plant_health/plant_pest_info/emerald_ash_b/index.shtml<br />
3.16
Wildlife Pests<br />
Kansas farmers also lose a significant amount of crops each year as a result of wildlife foraging.<br />
This can be particularly problematic in areas w<strong>here</strong> natural habitat has been diminished or in<br />
years w<strong>here</strong> wea<strong>the</strong>r patterns such as early/late frost deep snow, or drought has caused <strong>the</strong><br />
wild food sources to be limited.<br />
Also <strong>the</strong>re are several fatal diseases that can affect <strong>the</strong> deer or captive elk population in<br />
Kansas. One is <strong>the</strong> Chronic Wasting Disease (CWD) and <strong>the</strong>re is no known treatment or<br />
eradiation method. T<strong>here</strong> have been 48 positive cases of CWD <strong>found</strong> in Kansas since<br />
surveillance started in 1996. The only preventive measure is for people to not transport live or<br />
dead deer or elk to those areas which have not been exposed to CWD.<br />
Ano<strong>the</strong>r disease called Hemorrhagic Disease (HD) is <strong>the</strong> most devastating viral disease of<br />
white-tailed deer in <strong>the</strong> U.S. according to <strong>the</strong> Sou<strong>the</strong>astern Cooperative Wildlife Disease Study.<br />
The HD is transmitted by biting flies and <strong>the</strong> HD occurs seasonally in late summer and fall.<br />
Death losses during outbreaks are usually well below 25 percent of <strong>the</strong> deer population, but in a<br />
few instances have been 50 percent or more. T<strong>here</strong> are no wildlife management tools or<br />
strategies available to prevent or control HM.<br />
O<strong>the</strong>r diseases such as bovine tuberculosis and a host of detrimental parasites such as exotic<br />
lice, meningeal worms, flukes, and stomach worms are fatal to deer and are transmitted more<br />
efficiently when deer are concentrated in a small area.<br />
These diseases can seriously damage <strong>the</strong> populations of <strong>the</strong> captive deer and elk farms and <strong>the</strong><br />
wild deer populations but also affect <strong>the</strong> annual $350 million dollar hunting economy in Kansas.<br />
Location<br />
The entire planning area may be affected by agricultural infestation. While rural areas within <strong>the</strong><br />
region are more susceptible to crop and livestock infestation, urban and suburban areas are<br />
also at risk: landscaping, urban gardens and parks, all of which add value to homes and<br />
communities, may be susceptible to damage or loss. Agricultural infestation does not cause<br />
damage to buildings or critical facilities.<br />
Previous Occurrences<br />
• August 29, 2012: The emerald ash borer pest was confirmed at <strong>the</strong> Wyandotte County<br />
Lake in Wyandotte County, Kansas. Immediately after confirmation by USDA, <strong>the</strong> Kansas<br />
Secretary of Agriculture implemented an emergency intrastate quarantine for Wyandotte<br />
County. The stipulations for <strong>the</strong> quarantine can be <strong>found</strong> on <strong>the</strong> Kansas Department of<br />
Agriculture’s website: http://www.ksda.gov/plant_protection/content/379.<br />
• 2001: A major infestation of webworms attacked <strong>the</strong> State’s alfalfa crop particularly in<br />
eastern Kansas.<br />
• 1989: Gray leaf spot of corn was first identified in <strong>the</strong> State in <strong>the</strong> Republican River Valley.<br />
The disease reached economic threshold levels by 1992 and has caused economic<br />
damages somew<strong>here</strong> in <strong>the</strong> State every year from 1992 to 1998. In 1998, it was <strong>the</strong> most<br />
3.17
severe in nor<strong>the</strong>ast Kansas and in <strong>the</strong> irrigated areas of south central and southwest<br />
Kansas.<br />
Extent<br />
The magnitude and severity of an Agricultural Infestation is relative to <strong>the</strong> type of infestation. A<br />
foreign animal disease like foot and mouth could potentially cause <strong>the</strong> economy to crumble,<br />
w<strong>here</strong>as an infestation of fleas would be manageable. The planning committee has determined<br />
that <strong>the</strong> magnitude of this hazard in <strong>the</strong> planning area would be limited. Any shutdown of critical<br />
facilities would not be for more than one week, and no more than 10% to 25% of property would<br />
be severely damaged.<br />
Probability of Future Hazard Events<br />
Region L experiences agricultural losses every year as a result of insects, vermin or diseases<br />
that impact plants and livestock. The Probability for this hazard is “Highly Likely”.<br />
Impact and Vulnerability<br />
Table 3.6 provides an indication of <strong>the</strong> impact of agricultural infestation in Region L. This table<br />
only reflects insured losses that were claimed. According to <strong>the</strong> 2011 Kansas Crop Insurance<br />
profile Report issued by <strong>the</strong> USDA Risk Management Agency, 82 percent of Kansas row crops<br />
were insured in 2011 (<strong>the</strong>re is no information available for <strong>the</strong> 18 percent of uninsured crop<br />
losses).<br />
Data regarding <strong>the</strong> number or value of livestock and wildlife lost to disease or infestation was<br />
not available for this planning effort. An action for <strong>the</strong> Region has been submitted to facilitate a<br />
process by which animal loss can be tracked due to disease or infestation.<br />
Table 3.6 Total Insured Crop Insurance paid per County in Region L from 2002 -2007,<br />
Top Livestock Inventory Number and Top Crop in Acres from USDA Census 2007<br />
Annualized Crop<br />
Insurance Paid for<br />
Agricultural Infestation<br />
Damage<br />
All Goats<br />
Inventory<br />
Cattle & Calves<br />
Inventory<br />
Hogs & Pigs<br />
Inventory<br />
Horses & Ponies<br />
Inventory<br />
Sheep & Lamb<br />
Inventory, Wool<br />
Production<br />
Corn Harvested in<br />
Acres<br />
Forage Harvested<br />
in Acres<br />
Sorghum For Grain<br />
Harvested in Acres<br />
Soybeans for<br />
Beans Harvested<br />
in Acres<br />
County<br />
Mitigation Planning Region L<br />
Johnson $2,501 659 13,911 2,717 2,303 2,519 11,992 17,841 941 20,993 5,755<br />
Leavenworth $2,038 367 28,134 1,919 1,796 576 15,736 38,890 0 25,687 6,804<br />
Wyandotte $0 225 1,734 37 368 0 1,963 2,814 0 6,013 (D)<br />
Total $4,538 1,251 43,779 4,673 4,467 3,095 29,691 59,545 941 52,693 12,559<br />
Source: USDA Risk Management Agency, 2012; USDA Census of Agriculture, 2007.<br />
Note: (D) is cannot be disclosed.<br />
Wheat Harvested<br />
in Acres<br />
3.18
Depending on <strong>the</strong> type of infestations and location, <strong>the</strong> impact of an agricultural infestation could<br />
be moderate to severe. Leavenworth County has 1203 farms, which provides a market value of<br />
$33,219,000 of products sold. 63% is in crop sales and 37% is in livestock sales. Johnson<br />
County has 610 farms, which provides a market value of $40,659,000 in products sold. 72% is<br />
in crop sales and 28% is in livestock sales. Wyandotte County elected to not disclose this<br />
information for public use.<br />
Should Region L have an agricultural infestation that affects crops or livestock, <strong>the</strong> impacts<br />
would reverberate throughout <strong>the</strong> community. With potential losses in <strong>the</strong> millions of dollars, <strong>the</strong><br />
vulnerability of <strong>the</strong> Region would be felt throughout <strong>the</strong> economy.<br />
Summary<br />
Agricultural Infestation is a concern in <strong>the</strong> planning area as it pertains to crops, livestock,<br />
cultivated and landscaped gardens. While Leavenworth County is in <strong>the</strong> top 10 counties of<br />
Kansas for total number of farms with 1203, Johnson County has <strong>the</strong> highest market value of<br />
crop sales at $40,659.000. Should a potential infestation affect <strong>the</strong> Region, both counties could<br />
potentially take a large revenue loss which would hurt <strong>the</strong> local economy. Livestock sales in<br />
Leavenworth County supersede <strong>the</strong> value of livestock in Johnson or Wyandotte Counties at an<br />
estimated $12,236,000. Should a FAD or o<strong>the</strong>r infestation occur in this region <strong>the</strong> losses due to<br />
livestock contamination could also greatly hurt <strong>the</strong> farmers and <strong>the</strong> economy. While Wyandotte<br />
does not give actual market value of crops and livestock, at $5,112,000 total its loss would be<br />
less, but still painful.<br />
Local Mitigation Concerns<br />
• Region L has growers of sensitive and organic crops such as blueberries, grapes, fruit<br />
and nut trees, strawberries, and tomatoes which are vulnerable to vermin and disease.<br />
Ano<strong>the</strong>r concern is <strong>the</strong> risk of pesticides used for crops to <strong>the</strong> west of <strong>the</strong> Region that<br />
through <strong>the</strong> easterly flow of <strong>the</strong> wind can damage <strong>the</strong>se crops. The Kansas Department<br />
of Agriculture hosts a sensitive crop registry w<strong>here</strong> growers can make <strong>the</strong>ir sensitive<br />
crop locations known. Pesticide applicators can use this registry to identify w<strong>here</strong> extra<br />
care should be taken to protect <strong>the</strong>se vulnerable crops.<br />
http://www.ksda.gov/pesticides_fertilizer/content/177<br />
• T<strong>here</strong> is <strong>the</strong> possibility of <strong>the</strong> Emerald Ash Borer pest spreading in Kansas. Cooperation<br />
from <strong>the</strong> public, firewood dealers, arborists, and <strong>the</strong> nursery industry to prevent fur<strong>the</strong>r<br />
spreading is paramount to <strong>the</strong> success of isolating this pests. Prevention is far more<br />
cost-effective than trying to contain it as an established pest. The 1.5 million ash trees<br />
that grow in Kansas towns and cities will pose a great cost to Kansas in removal, stump<br />
grinding and replacement if <strong>the</strong> pest is <strong>found</strong> throughout <strong>the</strong> State.<br />
• While Wyandotte County has <strong>the</strong> least amount of agricultural land in <strong>the</strong> state, it does<br />
have meat processing/distribution plants, and dairy processing/distribution facilities.<br />
These entities could be greatly impacted should a foreign animal disease hit any part of<br />
Kansas.<br />
3.19
• Johnson County saw a 7% decrease in <strong>the</strong> number of farms between <strong>the</strong> years of 2002<br />
– 2007. Total land in farms decreased by 23%, and <strong>the</strong> average size of farms<br />
decreased by 17% (see Table 3.8). With <strong>the</strong> decrease in agricultural land comes a<br />
decrease in agricultural infestation. However, domesticated plants are still at risk, which<br />
include nurseries, and landscapes in residential and commercial areas.<br />
Table 3.7. Johnson County Agricultural Land, 2002 – 2007<br />
Farms 2007 2002 % Change<br />
Number of farms 610 659 (7)<br />
Land in farms 114,202 acres 148,606 acres (23) acres<br />
Average Size of Farm 187 acres 226 acres (17) acres<br />
Source: USDA, 2007 Census of Agriculture, www.agcensus.usda.gov<br />
• According to <strong>the</strong> USDA, Leavenworth County has 1,203 farms, ranking it in <strong>the</strong> top 10<br />
counties in Kansas. While <strong>the</strong> amount of land used for agricultural purposes decrease<br />
between <strong>the</strong> years 2002 – 2007, <strong>the</strong> number of farms increased, which lends itself to a<br />
higher risk of crop or animal infestation.<br />
• Table 3.8. Leavenworth County Agricultural Land, 2002 - 2007<br />
Farms 2007 2002 % Change<br />
Number of farms 1203 1094 10<br />
Land in farms 194,854 acres 197,168 acres (1)<br />
Average Size of Farm 162 acres 180 acres (10)<br />
Source: USDA, 2007 Census of Agriculture, www.agcensus.usda.gov<br />
• Wyandotte County saw an increase of farms by 19% between <strong>the</strong> years 2002 – 2007.<br />
The amount of land in farms increased by 31%. This statistically raises <strong>the</strong> potential for<br />
agricultural infestation in <strong>the</strong> county.<br />
Table 3.9. Wyandotte County Agricultural Land, 2002 - 2007<br />
Farms 2007 2002 % Change<br />
Number of farms 191 161 19<br />
Land in farms 18,107 acres 13,804 acres 31 acres<br />
Average Size of Farm 95 acres 86 acres 10 acres<br />
Source: USDA, 2007 Census of Agriculture, www.agcensus.usda.gov<br />
3.20
The CPRIs for each county of Region L is provided below:<br />
Johnson County<br />
Johnson County CPRI: 2.65 – Moderate planning significance<br />
Table 3.10. Johnson County Agricultural Infestation Ranking<br />
Hazard Type Probability Magnitude<br />
Warning<br />
Time Duration CPRI<br />
Planning<br />
Significance<br />
Agricultural Infestation 4 1 1 4 2.65 Moderate<br />
Leavenworth County<br />
Leavenworth County CPRI: 2.95 – Moderate planning significance<br />
Table 3.11 Leavenworth County Agricultural Infestation Ranking<br />
Hazard Type Probability Magnitude<br />
Warning<br />
Time Duration CPRI<br />
Planning<br />
Significance<br />
Agricultural Infestation 4 2 1 4 2.95 Moderate<br />
Wyandotte County<br />
Wyandotte County CPRI: 2.65 – Moderate planning significance<br />
Table 3.12 Wyandotte County Agricultural Infestation Ranking<br />
Warning<br />
Planning<br />
Hazard Type Probability Magnitude Time Duration CPRI Significance<br />
Agricultural Infestation 4 1 1 4 2.65 Moderate<br />
Development in Hazard Prone Areas<br />
Agricultural Infestation does not cause damage to buildings and critical facilities; however, as<br />
more agricultural land is converted to developed land, it will decrease agriculture infestation.<br />
Consequence (Impact) Analysis<br />
The information in Table 3.11 provides <strong>the</strong> Consequence Analysis of Potential for Detrimental<br />
Impacts of Hazards done for accreditation with <strong>the</strong> Emergency management Accreditation<br />
Program (EMAP).<br />
3.21
Table 3.13. EMAP Consequence Analysis: Agricultural Infestation<br />
Subject Ranking Impacts/Agricultural Infestation<br />
Minimal<br />
Impact for this incidence on <strong>the</strong> Health and<br />
Safety of Persons in <strong>the</strong> area would be<br />
minimal. If <strong>the</strong> infestation is unrecognized,<br />
<strong>the</strong>n <strong>the</strong>re is <strong>the</strong> potential for <strong>the</strong> food supply<br />
to be contaminated.<br />
Health and Safety of Persons in <strong>the</strong><br />
Area of <strong>the</strong> Incident<br />
Responders Minimal Impact to responders would be minimal with<br />
protective clothing, gloves, etc as <strong>the</strong>se<br />
diseases cause no risk to humans.<br />
Continuity of Operations Minimal Minimal expectation of execution of <strong>the</strong><br />
COOP.<br />
Property, Facilities, and Infrastructure Minimal Localized impact to facilities and<br />
infrastructure in <strong>the</strong> incident area is minimal<br />
to non-existent.<br />
Delivery of Services Minimal Impacts to <strong>the</strong> delivery of services would be<br />
non-existent to minimal. Impact could be<br />
larger depending on <strong>the</strong> extent of <strong>the</strong><br />
contaminated crop/crop loss.<br />
Environment Minimal to Severe Impact could be severe to <strong>the</strong> incident area,<br />
specifically, plants, trees, bushes, and crops.<br />
Economic Conditions Minimal to Severe Impacts to <strong>the</strong> economy will depend on <strong>the</strong><br />
severity of <strong>the</strong> infestation. The potential for<br />
economic loss to <strong>the</strong> community and state<br />
could be severe if <strong>the</strong> infestation is hard to<br />
contain, eliminate, or reduce. Impact could<br />
be minimized due to crop insurance.<br />
Public Confidence in Jurisdiction’s<br />
Governance<br />
Minimal to Severe<br />
Confidence could be in question depending<br />
on timeliness and steps taken to warn <strong>the</strong><br />
producers and public, and treat/eradicate <strong>the</strong><br />
infestation.<br />
3.22
3.2.3 Civil Disorder<br />
Regional Calculated Priority Risk Index<br />
Planning Significance<br />
2.80 Moderate<br />
Description<br />
Civil disorder is a term that generally refers to groups of people purposely choosing not to<br />
observe a law, regulation, or rule, usually in order to bring attention to <strong>the</strong>ir cause, concern, or<br />
agenda. According to U.S. Code (18 U.S.C. §232), civil disorder is “any public disturbance<br />
involving acts of violence by a group of three or more persons causing immediate danger,<br />
damage, or injury to <strong>the</strong> property or person of ano<strong>the</strong>r individual.” In Kansas, civil disorder is<br />
recognized as a societal hazard because of <strong>the</strong> associated potential for injury, loss of life,<br />
property damage, and economic disruption. Civil disorder can take <strong>the</strong> form of small ga<strong>the</strong>rings<br />
or large groups impeding access to a building or disrupting normal activities by generating noise<br />
and intimidating people. They can range from a peaceful sit-in to a full-scale riot. Even in its<br />
more passive forms, a group that blocks roadways, sidewalks, or buildings interferes with public<br />
order.<br />
Types of Crowds<br />
Crowds can be classified into four general categories:<br />
• Casual Crowd—A casual crowd is merely a group of people who happen to be in <strong>the</strong> same<br />
place at <strong>the</strong> same time. Examples of this type include shoppers and sightseers. The<br />
likelihood of violent conduct is all but nonexistent.<br />
• Cohesive Crowd—A cohesive crowd consists of members who are involved in some type<br />
of unified behavior. Members of this group are involved in some type of common activity,<br />
such as worshiping, dancing, or watching a sporting event. Although <strong>the</strong>y may have intense<br />
internal discipline (e.g., rooting for a team), <strong>the</strong>y require substantial provocation to arouse to<br />
action.<br />
• Expressive Crowd—An expressive crowd is one held toge<strong>the</strong>r by a common commitment<br />
or purpose. Although <strong>the</strong>y may not be formally organized, <strong>the</strong>y are assembled as an<br />
expression of common sentiment or frustration. Members wish to be seen as a formidable<br />
influence. One of <strong>the</strong> best examples of this type is a group assembled to protest something.<br />
• Aggressive Crowd—An aggressive crowd is made up of individuals who have assembled<br />
for a specific purpose. This crowd often has leaders who attempt to arouse <strong>the</strong> members or<br />
motivate <strong>the</strong>m to action. Members are noisy and threatening and will taunt authorities. They<br />
tend to be impulsive and highly emotional and require only minimal stimulation to arouse<br />
<strong>the</strong>m to violence. Examples of this type of crowd include demonstrations and strikers.<br />
3.23
Types of Mobs<br />
A mob can be defined as a large disorderly crowd or throng. Mobs are usually emotional, loud,<br />
tumultuous, violent, and lawless. Like crowds, mobs have different levels of commitment and<br />
can be classified into four categories:<br />
• Aggressive Mob—An aggressive mob is one that attacks, riots, and terrorizes. The object<br />
of violence may be a person, property, or both. An aggressive mob is distinguished from an<br />
aggressive crowd only by lawless activity. Examples of aggressive mobs are <strong>the</strong> inmate<br />
mobs in prisons and jails, mobs that act out <strong>the</strong>ir frustrations after political defeat, or violent<br />
mobs at political protests or rallies.<br />
• Escape Mob—An escape mob is attempting to flee from something such as a fire, bomb,<br />
flood, or o<strong>the</strong>r catastrophe. Members of escape mobs have lost <strong>the</strong>ir capacity to reason and<br />
are generally impossible to control. They are characterized by unreasonable terror.<br />
• Acquisitive Mob—An acquisitive mob is one motivated by a desire to acquire something.<br />
Riots caused by o<strong>the</strong>r factors often turn into looting sprees. This mob exploits a lack of<br />
control by authorities in safeguarding property. Examples of acquisitive mobs would include<br />
<strong>the</strong> looting in South Central Los Angeles in 1992, or food riots in o<strong>the</strong>r countries.<br />
• Expressive Mob—An expressive mob is one that expresses fervor or revelry following<br />
some sporting event, religious activity, or celebration. Members experience a release of pent<br />
up emotions in highly charged situations. Examples of this type of mob include <strong>the</strong> June<br />
1994 riots in Canada following <strong>the</strong> Stanley Cup professional hockey championship,<br />
European soccer riots, and those occurring after o<strong>the</strong>r sporting events in many countries,<br />
including <strong>the</strong> United States.<br />
Although members of mobs have differing levels of commitment, as a group <strong>the</strong>y are far more<br />
committed than members of a crowd. As such, a “mob mentality” sets in, which creates a<br />
cohesiveness and sense of purpose that is generally lacking in crowds.<br />
Location<br />
The entire planning area of Region L is susceptible to Civil Disorder. Region L is <strong>the</strong> most<br />
densely populated portion of Kansas, making it easier for crowds or mobs to ga<strong>the</strong>r for a<br />
purported cause. The arena venues available for large crowds is also greater in this region,<br />
such as <strong>the</strong> Kansas Speedway, <strong>the</strong> NFL and ABA sports arenas, and <strong>the</strong> shopping malls that<br />
cater to not only <strong>the</strong> residents of <strong>the</strong> region, but outside <strong>the</strong> region also. While <strong>the</strong> region varies<br />
in its economic interest, this does not negate <strong>the</strong> risk to <strong>the</strong> people and property. Leavenworth<br />
has a high military footprint, w<strong>here</strong>as Wyandotte County is more industrialized. Johnson County<br />
is <strong>the</strong> most populated county in Kansas and has an urban landscape. Each of <strong>the</strong>se counties<br />
carry <strong>the</strong>ir own risk for Civil Disorder, from protest at <strong>the</strong> Leavenworth Penitentiary to Fighting<br />
Clubs in Wyandotte County. This hazard carries <strong>the</strong> risk to both people and property.<br />
3.24
Previous Occurrences<br />
• Summer of 2012 saw a Bradley Manning Protest in North Leavenworth. Bradley<br />
Manning was arrested on suspicion of leaking information which contributed to <strong>the</strong> Wiki<br />
Leaks controversy. While being incarcerated at <strong>the</strong> Leavenworth Prison, <strong>the</strong> County<br />
spent over 30,000 in protecting or mitigation <strong>the</strong> protest of people in support of Manning.<br />
Business was at a standstill for over 6 hours to maintain a safe and secure passage of<br />
people traveling through Leavenworth City. This event involved over 80 officers from<br />
<strong>the</strong> Leavenworth area, along with <strong>the</strong> Kansas Highway Patrol. While <strong>the</strong>re were no<br />
injuries, and Leavenworth County saw minimal damage, this event could have escalated<br />
but for Leavenworth’s proactive stance<br />
• While not considered a civil disorder event, in November 2012 a video surfaced of a<br />
“Fight Club” at Wyandotte High School. This club was allegedly set up for entertainment<br />
for <strong>the</strong> kids involved, and <strong>the</strong>re was no adult supervision or referees. These type of<br />
events could potentially get out of control, resulting in a civil disorder event, particularly<br />
in <strong>the</strong> case of a knife or gun being drawn<br />
Extent<br />
While civil disorder is a fairly rare event, when <strong>the</strong>y do occur <strong>the</strong>y are extremely disruptive and<br />
difficult to control. Law enforcement presence is often staffed below <strong>the</strong> peak loads at <strong>the</strong> start<br />
of an event like civil disorder, which in turn gives <strong>the</strong> event time to escalate. This hazard can<br />
occur anytime a large group ga<strong>the</strong>rs, which makes Region L particularly susceptible due to its<br />
venues for large ga<strong>the</strong>rings and events. Political, social, or o<strong>the</strong>r causes make it difficult to<br />
determine when and w<strong>here</strong> <strong>the</strong>y will occur. Pre-planning is done to quell potential civil<br />
disturbances simply through <strong>the</strong> presence of sufficient law enforcement personnel and preplanning<br />
for crowd control. Because Region L , specifically Johnson County, is <strong>the</strong> most<br />
densely populated area in Kansas, it is even more important that pre-planning be considered<br />
during events that have large crowd participation. Should a civil disorder event occur in <strong>the</strong><br />
planning area <strong>the</strong> result could be catastrophic, resulting in multiple deaths and a complete<br />
shutdown of facilities for 30 or more days. More than 50% of property could be severely<br />
damaged.<br />
Probability of Future Hazard Events<br />
Nationally, riots are likely to be a feature of life. Region L will no doubt not be unaffected by<br />
events that could lead to civil disorder, due to protests, demonstrations, or marches. Of notable<br />
concern is <strong>the</strong> rise nationally in school shootings and random shootings by individuals looking to<br />
make a statement or incite <strong>the</strong> masses. As depicted in <strong>the</strong> previous occurrences above, <strong>the</strong>re<br />
have been only a couple of notable incidents in <strong>the</strong> past couple of years. While this is not a<br />
statistically significant amount, it does show that incidents are becoming disconcerting enough<br />
to report. The probability of this type of hazard occurring in Region L is “Possible” within <strong>the</strong><br />
next 5 years.<br />
3.25
Impact and Vulnerability<br />
Potential losses from Civil Disorder include infrastructure, critical facilities, and human life. The<br />
degree of impact would be directly related to <strong>the</strong> type of incident and <strong>the</strong> target. Potential losses<br />
could include cost of repair or replacement of damaged facilities, lost economic opportunities for<br />
businesses, loss of human life, injuries to persons, and immediate damage to <strong>the</strong> surrounding<br />
environment.<br />
While it is not possible to predict <strong>the</strong> location of civil disorders, those locations with correctional<br />
facilities are somewhat more likely to be susceptible to such incidents. Table 3.14 below<br />
provides resident average daily inmate populations for each Kansas Correctional Facility. The<br />
cost of a response and recovery from a civil disorder is difficult to determine.<br />
As discussed previously, it is difficult to quantify potential losses in terms of <strong>the</strong> jurisdictions<br />
most threatened by Civil Disorder due to <strong>the</strong> many variables and human elements. T<strong>here</strong>fore,<br />
for <strong>the</strong> purposes of this plan, <strong>the</strong> loss estimates will take into account a hypo<strong>the</strong>tical scenario.<br />
Please note that <strong>the</strong> hypo<strong>the</strong>tical scenarios are included to provide a sample methodology for<br />
local jurisdictions to estimate potential losses.<br />
****THE FOLLOWING HYPOTHETICAL SCENARIO IS FOR INSTRUCTIONAL AND<br />
ILLUSTRATIVE PURPOSES ONLY****<br />
Riot Event<br />
Scenario Overview: A large mob is formed following a football game which descends on <strong>the</strong><br />
local downtown area. Potential losses with this type of scenario include both human and<br />
structural assets.<br />
Assumptions: (1) The population density in <strong>the</strong> parking lot during <strong>the</strong> beginning and ending of<br />
<strong>the</strong> games is high, at least 5 persons per 25 square feet. (2) The level of violence among<br />
persons is moderate. (3) 6,000 persons crowd <strong>the</strong> streets.<br />
Described Losses:<br />
Total Traumatic Injuries<br />
Total Urgent Care Injuries<br />
Injuries not Requiring Hospitalization<br />
Structures and O<strong>the</strong>r Physical Assets<br />
(Damages would certainly occur to vehicles and<br />
depending on <strong>the</strong> proximity of o<strong>the</strong>r structures. The<br />
exact amount of <strong>the</strong>se damages is difficult to predict<br />
because of <strong>the</strong> large numbers of factors, including <strong>the</strong><br />
type of violence and <strong>the</strong> amount of insurance held by<br />
vehicle owners. )<br />
Source: Kansas State Hazard Mitigation Plan<br />
250 persons<br />
1,000 persons<br />
2,500 persons<br />
Vehicles –<br />
Window /headlight replacement cost for approximately<br />
200 vehicles @ $400 = $ 8,000<br />
Repair / repainting cost for approximately 200 vehicles<br />
@ $ 4,000 per vehicle inside <strong>the</strong> BATF described Falling<br />
Glass Hazard = $80,000<br />
Buildings –<br />
Window replacement cost for approximately 50 buildings<br />
@ $1600 per building = $80,000<br />
3.26
Table 3.14. Inmates in Region L<br />
Facility / Location 2010 Inmate Population 2011 Inmate Population<br />
Lansing / Leavenworth County 2,346 2,368<br />
Source: Kansas Department of Corrections<br />
Summary<br />
With a dense population of 1,149.6 people per square mile in Johnson County, 1,039 per<br />
square mile in Wyandotte County, and 164.7 people per square mile in Leavenworth County, a<br />
Civil Disorder event has <strong>the</strong> potential to affect a multitude of people. The more densely<br />
populated an area, <strong>the</strong> more damage that can be inflicted. This Region also has large venues<br />
for outdoor ga<strong>the</strong>rings which can create <strong>the</strong> atmosp<strong>here</strong> for unrest, such as <strong>the</strong> Kansas<br />
Speedway, and large shopping malls. Leavenworth County has a presence of penitentiaries that<br />
can invite protest such as in <strong>the</strong> Bradley Manning case. These protest affect <strong>the</strong> businesses in<br />
<strong>the</strong> community and create an unsafe atmosp<strong>here</strong> for <strong>the</strong> residents, costing <strong>the</strong> community<br />
revenue.<br />
Local Mitigation Concerns<br />
• Region L is <strong>the</strong> most densely populated area in <strong>the</strong> State of Kansas, making it a high<br />
visibility region for <strong>the</strong> ga<strong>the</strong>ring of crowds and mobs. It is also a part of <strong>the</strong> Kansas City<br />
Metro area which also lends itself to varying degrees of emotions as <strong>the</strong>y relate to<br />
current issues that can spark protest, whe<strong>the</strong>r controlled or uncontrolled. While <strong>the</strong>re<br />
has not been any noteworthy riots or protest that have caused catastrophic economic,<br />
structural, or population loss, <strong>the</strong> potential is <strong>the</strong>re due to <strong>the</strong> make-up of <strong>the</strong> region.<br />
• Leavenworth County houses <strong>the</strong> Leavenworth Federal Penitentiary which has<br />
documented protests aimed at subject matter that creates a high emotional impact in<br />
various groups. The military presence itself is a deterrent to uncontrolled mobs,<br />
however, <strong>the</strong> risk remains due to <strong>the</strong> various high profile inmates that are serving <strong>the</strong>ir<br />
time <strong>the</strong>re.<br />
• Leavenworth, Wyandotte, and Johnson County’s are located approximately 65 miles<br />
from Topeka, KS, which is home to <strong>the</strong> Westboro Church. Known as a hate group due<br />
to its extreme ideologies and protest against gays, it is significant to <strong>the</strong> planning area<br />
due to its close proximity to <strong>the</strong> church’s headquarters. Headed by Fred Phelps, it is<br />
mainly made up of his large extended family who ga<strong>the</strong>r and protest at <strong>the</strong> funerals of<br />
fallen soldiers. Region L has been <strong>the</strong> recipient of <strong>the</strong>se protest, and while <strong>the</strong>y are<br />
normally peaceful, <strong>the</strong> potential for violence is always <strong>the</strong>re.<br />
Future Development<br />
With human-caused hazards such as this that can have multiple variables involved, increases in<br />
development, and increases in <strong>the</strong> replacement cost of <strong>the</strong> built environment, can be a factor in<br />
increased cost of <strong>the</strong> event. The cost for such an event is largely related to <strong>the</strong> location and <strong>the</strong><br />
level of violence <strong>the</strong> crowd chooses.<br />
3.27
The CPRIs for each county of Region L is broken out below:<br />
Johnson County<br />
Table 3.15. Johnson County CPRI:<br />
Hazard Type Probability Magnitude<br />
Warning<br />
Time Duration CPRI<br />
Planning<br />
Significance<br />
Johnson County<br />
Civil Disorder 2 4 4 1 2.80 Moderate<br />
Leavenworth County<br />
Table 3.16. Leavenworth County CPRI:<br />
Hazard Type Probability Magnitude<br />
Warning<br />
Time Duration CPRI<br />
Planning<br />
Significance<br />
Leavenworth County<br />
Civil Disorder 2 4 4 1 2.80 Moderate<br />
Wyandotte County<br />
Table 3.17. Wyandotte County CPRI:<br />
Hazard Type Probability Magnitude<br />
Warning<br />
Time Duration CPRI<br />
Planning<br />
Significance<br />
Wyandotte<br />
Civil Disorder 2 4 4 1 2.80 Moderate<br />
Hazard Consequence Analysis Impact Overview<br />
When rioting does break out, it generally proves extremely difficult for law enforcement<br />
authorities to stop <strong>the</strong> violence promptly. The rules of constitutional law set stringent limits on<br />
how police officers can behave toward <strong>the</strong> people <strong>the</strong>y try to arrest. Restraint also plays a<br />
crucial part in avoiding any action that “fans <strong>the</strong> flames.” Initial police presence is often<br />
undermined because forces may be staffed below <strong>the</strong> peak loads needed to bring things back<br />
under control. As a result, <strong>the</strong> riot may continue until enough state police or National Guard<br />
units arrive to bolster <strong>the</strong> arrest process and subsequently restore order. In many cases,<br />
damage to life and property may already be extensive.<br />
3.28
The information in Table 3.18 provides <strong>the</strong> Impact Analysis of Potential for Detrimental Impacts<br />
of Hazards done for accreditation with <strong>the</strong> Emergency Management Accreditation Program<br />
(EMAP).<br />
Table 3.18. Regional Consequence Analysis: Civil Disorder<br />
Subject Ranking Impacts/Civil Disorder<br />
Health and Safety of Persons in<br />
<strong>the</strong> Area of <strong>the</strong> Incident<br />
Severe<br />
Impact could be severe for persons in <strong>the</strong> incident<br />
area.<br />
Responders Minimal to Severe Impact to responders could be severe if not trained<br />
and properly equipped. Responders that are properly<br />
trained and equipped will have a low to moderate<br />
impact.<br />
Continuity of Operations Minimal to Severe Depending on damage to facilities/personnel in <strong>the</strong><br />
incident area, re-location may be necessary and lines<br />
of succession execution (minimal to severe).<br />
Property, Facilities, and<br />
Infrastructure<br />
Severe<br />
Impact within <strong>the</strong> incident area could be severe for<br />
explosion, moderate to low for Hazmat.<br />
Delivery of Services Minimal to Severe Delivery of services could be affected within and<br />
around <strong>the</strong> affected area especially if communications,<br />
road and railways, and facilities incur damage (minimal<br />
to severe).<br />
Environment Minimal to Severe Localized impact within <strong>the</strong> incident area could be<br />
severe depending on <strong>the</strong> type of human caused<br />
incident.<br />
Economic Conditions Minimal to Severe Economic conditions could be adversely affected and<br />
dependent upon time and length of clean up and<br />
investigation (minimal to severe).<br />
Public Confidence in<br />
Jurisdiction’s Governance<br />
Minimal to Severe<br />
Impact will be dependent on whe<strong>the</strong>r or not <strong>the</strong><br />
incident could have been avoided by government or<br />
non-government entities, clean-up and investigation<br />
times, and outcomes. (minimal to severe)<br />
3.29
3.2.4 Dam and Levee Failure<br />
Calculated Priority Risk Index<br />
Planning Significance<br />
2.10 Moderate<br />
Description<br />
Kansas is a state with many dams, impoundments, and levees. The failure of <strong>the</strong>se structures<br />
could result in injuries, loss of life and property, and environmental and economic damage.<br />
While levees are built solely for flood protection, dams often serve multiple purposes, one of<br />
which may be flood control. Severe flooding and o<strong>the</strong>r storms can increase <strong>the</strong> potential that<br />
dams and levees will be damaged and fail as a result of <strong>the</strong> physical force of <strong>the</strong> flood waters or<br />
overtopping.<br />
Dams and levees are usually engineered to withstand a flood with a computed risk of<br />
occurrence. If a larger flood occurs, <strong>the</strong>n that structure will likely be overtopped. If during <strong>the</strong><br />
overtopping <strong>the</strong> dam or levee fails or is washed out, <strong>the</strong> water behind it is released as a flash<br />
flood. Failed dams and levees can create floods that are catastrophic to life and property<br />
because of <strong>the</strong> tremendous energy of <strong>the</strong> released water.<br />
Dams<br />
A dam is defined by <strong>the</strong> National Dam Safety Act as an artificial barrier that impounds or diverts<br />
water and (1) is more than 6 feet high and stores 50 acre feet or more or (2) is 25 feet or more<br />
high and stores more than 15 acre feet. Based on this definition, <strong>the</strong>re are approximately 80,000<br />
dams in <strong>the</strong> United States. Over 95 percent of <strong>the</strong>se dams are non federal, with most being<br />
owned by state governments, municipalities, watershed districts, industries, lake associations,<br />
land developers, and private citizens. Dam owners have primary responsibility for <strong>the</strong> safe<br />
design, operation, and maintenance of <strong>the</strong>ir dams. They also have responsibility for providing<br />
early warning of problems at <strong>the</strong> dam, for developing an effective emergency action plan, and<br />
for coordinating that plan with local officials.<br />
Dams can fail for many reasons. The most common are as follows:<br />
• Piping—Internal erosion caused by embankment leakage, <strong>found</strong>ation leakage, and/or<br />
deterioration of pertinent structures appended to <strong>the</strong> dam;<br />
• Erosion—Inadequate spillway capacity causing overtopping of <strong>the</strong> dam, flow erosion,<br />
and/or inadequate slope protection;<br />
• Structural Failure—Caused by an earthquake, slope instability, and/or faulty construction.<br />
State-Regulated Dams<br />
In Kansas, <strong>the</strong> State has regulatory jurisdiction over non-federal dams that meet <strong>the</strong> following<br />
definition of a “jurisdictional” dam as defined by K.S.A. 82a-301 et seq, and amendments<br />
<strong>the</strong>reto:<br />
3.30
any artificial barrier including appurtenant works with <strong>the</strong> ability to impound<br />
water, waste water or o<strong>the</strong>r liquids that has a height of 25 feet or more; or has a<br />
height of six feet or greater and also has <strong>the</strong> capacity to impound 50 or more<br />
acre feet. The height of a dam or barrier shall be determined as follows: (1) A<br />
barrier or dam that extends across <strong>the</strong> natural bed of a stream or watercourse<br />
shall be measured from <strong>the</strong> downstream toe of <strong>the</strong> barrier or dam to <strong>the</strong> top of<br />
<strong>the</strong> barrier or dam; or (2) a barrier or dam that does not extend across a stream<br />
or watercourse shall be measured from <strong>the</strong> lowest elevation of <strong>the</strong> outside limit<br />
of <strong>the</strong> barrier or dam to <strong>the</strong> top of <strong>the</strong> barrier or dam.<br />
The Kansas Department of Agriculture, Division of Water Resources (KDA-DWR) is <strong>the</strong> State<br />
agency responsible for regulation of jurisdictional dams. Within <strong>the</strong> Division of Water<br />
Resources, <strong>the</strong> Water Structures Program has <strong>the</strong> following Responsibilities: <strong>review</strong>ing and<br />
approving of plans for constructing new dams and for modifying existing dams, ensuring quality<br />
control during construction, and monitoring dams that, if <strong>the</strong>y failed, could cause loss of life, or<br />
interrupt public utilities or services<br />
Dam classifications have been developed to describe <strong>the</strong> level of risk associated with dam<br />
failure. These classifications do not reflect <strong>the</strong> physical condition of <strong>the</strong> dams, but ra<strong>the</strong>r<br />
describe areas downstream of <strong>the</strong> dams that could be impacted in <strong>the</strong> event of failure, which is<br />
generally unlikely. The KDA-DWR classifies jurisdictional dams as follows:<br />
• Class C (high hazard)—A “hazard class C dam” shall mean a dam located in an area w<strong>here</strong><br />
failure could result in any of <strong>the</strong> following: extensive loss of life, damage to more than one<br />
home, damage to industrial or commercial facilities, interruption of a public utility serving a<br />
large number of customers, damage to traffic on high-volume roads that meet <strong>the</strong><br />
requirements for hazard class C dams or a high-volume railroad line, inundation of a<br />
frequently used recreation facility serving a relatively large number of persons, or two or<br />
more individual hazards described in hazard class B. Emergency Action Plans (EAPs) are<br />
required for all High Hazard Dams.<br />
• Class B (significant hazard)—A “hazard class B dam” means a dam located in an area<br />
w<strong>here</strong> failure could endanger a few lives, damage an isolated home, damage traffic on<br />
moderate volume roads that meet <strong>the</strong> requirements for hazard class B dams, damage lowvolume<br />
railroad tracks, interrupt <strong>the</strong> use or service of a utility serving a small number of<br />
customers, or inundate recreation facilities, including campground areas intermittently used<br />
for sleeping and serving a relatively small number of persons.<br />
• Class A (low hazard)—A “hazard class A dam” means a dam located in an area w<strong>here</strong><br />
failure could damage only farm or o<strong>the</strong>r uninhabited buildings, agricultural or undeveloped<br />
land including hiking trails, or traffic on low-volume roads that meet <strong>the</strong> requirements for<br />
hazard class A dams.<br />
At <strong>the</strong> time this plan was developed <strong>the</strong>re were 6,128 state-regulated jurisdictional dams in<br />
Kansas. Of those, 227 were Class C (High Hazard Dams), 209 were Class B (Significant<br />
Hazard Dams), and 5,692 were Class A (Low Hazard Dams).<br />
3.31
Location<br />
Table 3.19 provides <strong>the</strong> numbers of state-regulated low, significant, and high hazard dams for<br />
each county in Region L.<br />
County<br />
Low Hazard<br />
Dams<br />
Significant<br />
Hazard Dams<br />
High Hazard<br />
Dams<br />
High Hazard<br />
Dams Without<br />
EAP<br />
Total Dams<br />
Region L<br />
Johnson 68 9 31 15 108<br />
Leavenworth 159 3 6 3 168<br />
Wyandotte 29 2 13 5 44<br />
Total 256 14 50 23 320<br />
Most of <strong>the</strong> state-regulated dams in Kansas are in <strong>the</strong> central and eastern parts of <strong>the</strong> state.<br />
The map in Figure 3.2 provides <strong>the</strong> point locations of Significant and High Hazard Stateregulated<br />
dams in Kansas, with 320 being in <strong>the</strong> Region L planning area. High and Significant<br />
Hazard Dams for each county will be listed under <strong>the</strong> county summary.<br />
3.32
Figure 3.2. High and Significant Dams<br />
3.33
Figure 3.3. Dams in Johnson County, Kansas<br />
3.34
Figure 3.4. Dams in Leavenworth County, Kansas<br />
3.35
Figure 3.5. Dams in Wyandotte County, Kansas<br />
3.36
Federal Dams/Reservoirs<br />
Within <strong>the</strong> State of Kansas <strong>the</strong>re are 33 dams that are maintained and operated by <strong>the</strong> federal<br />
government. Seven of <strong>the</strong>se are maintained and operated by <strong>the</strong> Bureau of Reclamation, seven<br />
are maintained and operated by <strong>the</strong> U.S. Army, two are maintained and operated by <strong>the</strong> U.S.<br />
Fish & Wildlife Service, and <strong>the</strong> remaining seventeen are maintained and operated by <strong>the</strong> U.S.<br />
Army Corps of Engineers (USACE). Of <strong>the</strong>se seventeen, <strong>the</strong> Kansas City District Office<br />
maintains nine of <strong>the</strong>m.<br />
Table 3.20<br />
Federal Reservoirs in Region L<br />
MT<br />
Planning<br />
Region<br />
Contributing<br />
Drainage<br />
Area (Sq.<br />
Est.<br />
Storage<br />
Capacity<br />
(acre<br />
feet)<br />
Reservoir County<br />
Year<br />
Storage<br />
Began<br />
Operating<br />
Agency*<br />
River<br />
Basin miles)<br />
Surface<br />
Area<br />
(acres)<br />
L Merritt Lake Leavenworth 1/1/1942 US ARMY NR NR 19<br />
L Smith Lake Leavenworth 1/1/1942 US ARMY NR NR 9<br />
L<br />
Sunflower<br />
Pond B<br />
Dam Johnson 1/1/1943 US ARMY NR NR 36<br />
Of particular interest for Region L are <strong>the</strong> Dams/Reservoirs in adjacent states. As evidenced<br />
during <strong>the</strong> 2011 Missouri River flooding, <strong>the</strong> dams upstream can play a huge role in what<br />
happens downstream, when releases exceed capacity.<br />
Nebraska: T<strong>here</strong> are nine high hazard dams in sou<strong>the</strong>rn Nebraska Counties that border<br />
Kansas as follows:<br />
• Harlan county-Harlan County Dam<br />
• Thayer County-Hebron Dam<br />
• Gage County-Little Indian Creek 15A Dam, Upper Big Nemaha 25C Dam, Mud Creek 2A<br />
Dam, and Big Indian Creek 14B Dam.<br />
• Richardson County-Long Branch 21 Dam<br />
Missouri:<br />
Levees<br />
Levees are earth embankments constructed along rivers and coastlines to protect adjacent<br />
lands from flooding. Floodwalls are concrete structures, often components of levee systems,<br />
designed for urban areas w<strong>here</strong> <strong>the</strong>re is insufficient room for ear<strong>the</strong>n levees. Levees are<br />
usually engineered to withstand a flood with a computed risk of occurrence. When a larger<br />
flood occurs and/or levees and floodwalls and <strong>the</strong>ir appurtenant structures are stressed beyond<br />
<strong>the</strong>ir capabilities to withstand floods, levee failure can result in loss of life and injuries as well as<br />
damages to property, <strong>the</strong> environment, and <strong>the</strong> economy. In Kansas, <strong>the</strong>re are hundreds of<br />
levees ranging in size from small agricultural levees that were constructed primarily to protect<br />
farmland from high frequency flooding to large urban levees that were constructed to protect<br />
3.37
people and property from larger, less frequent flooding events, such as <strong>the</strong> 100-year and 500-<br />
year flood events. For purposes of this plan, <strong>the</strong> levee failure hazard will refer to both<br />
overtopping and breach of a levee as defined in FEMA’s publication “So You Live Behind a<br />
Levee” (http://content.asce.org/ASCELeveeGuide.html)<br />
• Overtopping: When a Flood Is Too Big—Overtopping occurs when floodwaters exceed <strong>the</strong><br />
height of a levee and flow over its crown. As <strong>the</strong> water passes over <strong>the</strong> top, it may erode <strong>the</strong><br />
levee, worsening <strong>the</strong> flooding and potentially causing an opening, or breach, in <strong>the</strong> levee.<br />
• Breaching: When a Levee Gives Way—A levee breach occurs when part of a levee gives<br />
way, creating an opening through which floodwaters may pass. A breach may occur<br />
gradually or suddenly. The most dangerous breaches happen quickly during periods of high<br />
water. The resulting torrent can quickly swamp a large area behind <strong>the</strong> failed levee with little<br />
or no warning.<br />
Levees are usually engineered to withstand a flood with a computed risk of occurrence. Many<br />
levees in Kansas were largely constructed to protect agricultural land and are not built to design<br />
standards established to protect people and property. Their presence can, in some cases,<br />
generate a false sense of security.<br />
Levees have been constructed across <strong>the</strong> State by public and private entities with varying levels<br />
of protection, inspection oversight, and maintenance. Currently <strong>the</strong>re is no one comprehensive<br />
database of all levees in <strong>the</strong> State. However, significant strides have been made toward<br />
compiling such an inventory. In 2010, FEMA published <strong>the</strong> Midterm Levee Inventory (MLI)<br />
database of levees. The MLI contains levee data ga<strong>the</strong>red primarily for structures that were<br />
designed to provide protection from at least <strong>the</strong> base (1-percent-annual-chance) flood. Levees<br />
that provide protection for less than <strong>the</strong> base flood event are included, but only were data was<br />
readily available. The MLI was developed to complement <strong>the</strong> USACE National Levee Database<br />
(NLD). During development of this plan update, USACE was in <strong>the</strong> process of integrating <strong>the</strong><br />
MLI with <strong>the</strong> NLD to provide a more comprehensive database of levees. Every effort was made<br />
during development of this plan to consider all known levees from both databases.<br />
The levee failure hazard proifile and risk assessment in this plan are fur<strong>the</strong>r discussed in four<br />
categories:<br />
1. Levees in <strong>the</strong> USACE levee Safety Program<br />
2. FEMA Accredited Levees<br />
3. Levees that are both in <strong>the</strong> USACE Levee Safety Program and Accredited by FEMA<br />
4. All o<strong>the</strong>r levees<br />
Levees in <strong>the</strong> USACE Levee Safety Program<br />
The Levee Safety program (LSP) was created by <strong>the</strong> USACE in 2006 to assess <strong>the</strong> integrity and<br />
viability of levees and to make sure levee systems do not present unacceptable risk to <strong>the</strong><br />
public, property, and environment. Under this program <strong>the</strong> USACE conducts levee inspections.<br />
These inspections are used to rate levee systems to determine compliance with operation and<br />
maintenance requirements, understand <strong>the</strong> overall levee condition, and determine eligibility for<br />
federal rehabilitation assistance under P.L. 84-99.<br />
3.38
According to <strong>the</strong> National Levee Database managed by USACE, <strong>the</strong>re are currently 12 levees in<br />
Region L that are included in <strong>the</strong> Levee Safety Program, of which 7 are rated minimally<br />
acceptable, and 5 were not reported. See Table 3.))))))for ratings of specific levees in <strong>the</strong><br />
USACE Levee Safety Program.<br />
FEMA Accredited Levees<br />
Many levees shown on effective Flood Insurance Rate Maps (FIRM) were mapped in <strong>the</strong> 1970s<br />
and 1980s and have never been remapped by FEMA. Prior to 1986, levees were shown on<br />
FIRMs as providing protection from <strong>the</strong> base flood when <strong>the</strong>y were designed and constructed in<br />
accordance with sound engineering practices. Since 1986, levees have been shown as<br />
accredited on FIRMs only when <strong>the</strong>y meet <strong>the</strong> requirements of 44 CFR 65.10 “Mapping Areas<br />
Protected by Levee Systems”, including certification by a registered professional engineer or a<br />
Federal agency with responsibility for levee design.<br />
Levees that do not meet <strong>the</strong> requirements of 44 CFR 65.10 cannot be shown as accredited on a<br />
FIRM. Fur<strong>the</strong>rmore, floodplain areas behind <strong>the</strong> levee are at risk to base flood inundation and<br />
are mapped as high risk areas subject to FEMA’s minimum floodplain management regulations<br />
and mandatory flood insurance purchase requirement.<br />
In 2004, as it initiated work under <strong>the</strong> Flood Map Modernization Initiative (Map Mod), FEMA<br />
determined that analysis of <strong>the</strong> role of levees in flood risk reduction would be an important part<br />
of <strong>the</strong> mapping efforts. A report issued in 2005 noted that <strong>the</strong> status of <strong>the</strong> Nation‘s levees was<br />
not well understood and <strong>the</strong> condition of many levees and floodwalls had not been assessed<br />
since <strong>the</strong>ir original inclusion in <strong>the</strong> NFIP. As a result, FEMA established policies to address<br />
existing levees.<br />
For <strong>the</strong> remainder of this discussion, FEMA Accredited levees will be discussed in two main<br />
types: Those mapped on Digital Flood Insurance Rate Maps (DFIRM) since <strong>the</strong> Flood Map<br />
Modernization Initiative and those that were mapped prior to <strong>the</strong> Flood Map Modernization<br />
Initiative and are not mapped on DFIRMs.<br />
FEMA Accredited Levees mapped on DFIRMs<br />
As DFIRMs are developed, levees fall under one of <strong>the</strong> three following categories:<br />
Accredited Levee - With <strong>the</strong> except of areas of residual flooding (interior drainage), if <strong>the</strong> data<br />
and documentation specified in 44 CFR 65.10 is readily available and provided to FEMA, <strong>the</strong><br />
area behind <strong>the</strong> levee will be mapped as a moderate-risk area. T<strong>here</strong> is no mandatory flood<br />
insurance purchase requirement in a moderate-risk area, but flood insurance is strongly<br />
recommended.<br />
Provisionally Accredited Levee (PAL) - If data and documentation is not readily available, and<br />
no known deficiency precludes meeting requirements of 44 CFR 65.10, FEMA can allow <strong>the</strong><br />
party seeking recognition up to two years to compile and submit full documentation to show<br />
compliance with 44 CFR 65.10. During this two-year period of provisional accreditation, <strong>the</strong> area<br />
3.39
ehind <strong>the</strong> levee will be mapped as moderate-risk with no mandatory flood insurance purchase<br />
requirement.<br />
De-Accredited Levees – If <strong>the</strong> information established under 44 CFR 65.10 is not readily<br />
available and provided to FEMA, and <strong>the</strong> levee is not eligible for <strong>the</strong> PAL designation, <strong>the</strong> levee<br />
will be de-accredited by FEMA. If a levee is de-accredited, FEMA will evaluate <strong>the</strong> level of risk<br />
associated with each non-accredited levee through <strong>the</strong>ir Levee Analysis Mapping Procedures<br />
(LAMP) criteria to consider how to map <strong>the</strong> floodplain and which areas on <strong>the</strong> dry side of <strong>the</strong><br />
levee will be shown as high risk. The mapping will <strong>the</strong>n be updated to reflect this risk..<br />
Location – Levee’s<br />
Region L has all of <strong>the</strong>ir accredited levees through FEMA on DFIRMs. Figure 3.6 status within<br />
<strong>the</strong> region.<br />
3.40
Figure 3.6. Status of DFIRMs<br />
3.41
Table 3.21. Region L DFIRM With Levees<br />
Mitigation Planning Region<br />
L<br />
L<br />
DFIRM Counties with Levees<br />
Leavenworth<br />
Wyandotte<br />
FEMA Accredited Levees not Mapped on DFIRMs<br />
All accredited levees in Region L have been mapped on DFIRMs.<br />
Levees that are both in <strong>the</strong> USACE Levee Safety Program and Accredited<br />
by FEMA<br />
Table 3.22 shows <strong>the</strong> list of levees in Region L that are in <strong>the</strong> USACE levee<br />
Safety Program and accredited through FEMA.<br />
Table 3.22.<br />
Levees in Region L<br />
Mitigat<br />
ion<br />
Planni<br />
ng<br />
Region County Levee Name<br />
Johnson_Kansas_River<br />
L Johnson<br />
L<br />
L<br />
Johnson<br />
Leavenworth<br />
USACE<br />
LSP<br />
USA<br />
CE<br />
Distri<br />
ct<br />
USACE<br />
Inspection<br />
Rating<br />
_1 No N/A N/A Yes<br />
Johnson_Kansas_River<br />
_2 No N/A N/A Yes<br />
Fall Leaf Drainage<br />
District Yes KC<br />
L Leavenworth Ft. Leavenworth Yes KC<br />
Grape-Bollin-Schwartz<br />
Levee Association-<br />
L Leavenworth Leavenworth Yes KC<br />
L<br />
L<br />
Leavenworth<br />
Leavenworth<br />
Kansas Department Of<br />
Corrections Yes KC<br />
Lawrence Unit-<br />
Leavenworth Yes KC<br />
Minimally<br />
Acceptable<br />
Not<br />
Reported<br />
Not<br />
Reported<br />
Minimally<br />
Acceptable<br />
Minimally<br />
Acceptable<br />
L Leavenworth Lower Iatan Bend No N/A N/A Yes<br />
L<br />
Leavenworth<br />
Wolcott Drainage<br />
District Section 1 Yes KC<br />
L Wyandotte Argentine Unit Yes KC<br />
L Wyandotte Armourdale Unit Yes KC<br />
L Wyandotte Cid, Kansas Yes KC<br />
L Wyandotte Fairfax-Jersey Creek Yes KC<br />
Not<br />
Reported<br />
Minimally<br />
Acceptable<br />
Minimally<br />
Acceptable<br />
Minimally<br />
Acceptable<br />
Minimally<br />
Acceptable<br />
L Wyandotte Lower Fairfax No N/A N/A Yes<br />
Nearman Creek Power<br />
L Wyandotte Station Levee No N/A N/A Yes<br />
L<br />
L<br />
Wyandotte<br />
Wyandotte<br />
Wolcott Drainage<br />
District Section 2 Yes KC<br />
Wolcott Drainage<br />
District Section 3 Yes KC<br />
Not<br />
Reported<br />
Not<br />
Reported<br />
MLI<br />
Yes<br />
Yes<br />
Yes<br />
Yes<br />
Yes<br />
Yes<br />
Yes<br />
Yes<br />
Yes<br />
Yes<br />
Yes<br />
No<br />
Flooding<br />
Source<br />
KANSAS<br />
Accredited<br />
DFIR<br />
M<br />
KANSAS<br />
RIVER No Yes<br />
MISSOUR<br />
I RIVER No Yes<br />
Design<br />
Frequency<br />
RIVER No Yes Unknown<br />
KANSAS<br />
RIVER No Yes Unknown<br />
< 1%<br />
Annual<br />
Chance<br />
Figure 3.7 Shows <strong>the</strong> location of <strong>the</strong> accredited levees in Leavenworth<br />
County, and Figure 3.8 and 3.8a show <strong>the</strong> location of <strong>the</strong> Levees in<br />
Wyandotte County.<br />
Figure 3.7. Levee’s In Leavenworth County<br />
Source: FEMA.gov<br />
3.43
Figure 3.8. Levee’s in Wyandotte County<br />
Source: FEMA.Gov<br />
3.44
Figure 3.8A. Levee’s in Wyandotte County<br />
Previous Occurrences<br />
This section discusses previous occurrences for dam and levee failure in Region L:<br />
Dam Failure<br />
According to Stanford University‘s National Performance of Dams Program, <strong>the</strong>re were 31 dam<br />
incidents in Kansas between 1925 and 2002. Of <strong>the</strong>se 31 incidents, 7 (23 percent) of <strong>the</strong>m were<br />
failures. While Region L had 4 incidences, none of <strong>the</strong>m were dam failures. Table 3.23 reflects<br />
<strong>the</strong> dams in Region L that had incidences.<br />
Table 3.23. Region L Dam Incidence<br />
MT<br />
Planning<br />
Region<br />
County<br />
NID # Dam Name<br />
Incident<br />
Date Incident Type<br />
L Wyandotte KS02987 Ksnoname 2987 5/14/1997 Seepage; Piping No<br />
L Leavenworth KS01253 Demaranville, Don, 7/25/2001 Seepage; Headcut No<br />
Dam<br />
Failure<br />
3.45
MT<br />
Planning<br />
Region<br />
County<br />
Incident<br />
Date<br />
Dam<br />
Failure<br />
NID # Dam Name<br />
Incident Type<br />
Sarcoxie Lake Dam<br />
in <strong>the</strong> emergency<br />
spillway<br />
L Leavenworth KS01251 Larson, Dr. O.M. 1/22/2001 Piping; Seepage No<br />
L Wyandotte KS02987 Ksnoname 2987 3/6/2002 Seepage No<br />
Source: Stanford University’s National Performance of Dams Program,<br />
http://ce-npdp-serv2.stanford.edu/DamDirectory/DamIncidentQuery/IncidentForm.jsp; *=These dams could not be located in <strong>the</strong><br />
current state inventory. It is possible that <strong>the</strong>se dams have been removed.<br />
Levee Failure<br />
• 2011 Flood: USACE reported that every non-federal levee from Rulo to Wolcott, Kansas on<br />
both sides of <strong>the</strong> river were ei<strong>the</strong>r overtopped or breached as a result of this flood.<br />
Specifically, <strong>the</strong> following levees along <strong>the</strong> Missouri River and tributaries in Leavenworth<br />
County were breached.<br />
− Grape Bollin-Schwartz levee<br />
− Sherman Airfield Levee (federal levee)—water reached <strong>the</strong> hangars which had been<br />
evacuated.<br />
− Ft. Leavenworth levee<br />
− Kansas Department of Corrections Levee<br />
The Levee Repair Working Group of <strong>the</strong> Missouri River Flood Task Force, established in<br />
response to <strong>the</strong> Missouri River Basin flood of 2011, reported that <strong>the</strong> following federal and nonfederal<br />
levees in Region L were damaged by <strong>the</strong> flooding.<br />
Table 3.24 Region L levees damaged during Missouri River Flooding of 2011<br />
Project Type Project Name MR Mile Markers State City<br />
Non-Federal<br />
Grape-Bollin-Schwartz Levee<br />
Association 409.9 to 406.2 KS Leavenworth<br />
Non-Federal Kansas Department of Corrections 394.0 to 388.0 KS Leavenworth<br />
Non-Federal Wolcott Drainage District Section 1 386.4 to 383.7 KS Wyandotte<br />
Non-Federal Wolcott Drainage District Section 2 386.4 to 383.7 KS Wyandotte<br />
Non-Federal Wolcott Drainage District Section 3 382.3 to 381.3 KS Wyandotte<br />
Source: Missouri River Flood Task Force,<br />
http://www.nwdmr.usace.army.mil/rcc/MRFTF/docs/20JunListofLeveeRehabsv1.pdf<br />
• 2009 Flooding: Two non-federal Kansas levees were damaged by flooding in 2009 as<br />
follows: Wolcott Levee Section 1 and Wolcott Levee Section 2.<br />
3.46
Figure 3.9.<br />
2009 Flood Damaged Levees in Region L<br />
Source: USACE KC District Website,<br />
http://www.nwk.usace.army.mil/Portals/29/docs/emergencymanagement/leveerehab/2009-<br />
LeveeRepairs-Status-MO.pdf<br />
• 1993 Floods: During <strong>the</strong> spring floods of 1993, which covered nine Midwest states, a high<br />
percentage of crop acres in <strong>the</strong> U.S. Army Corps of Engineers KC District floodplain areas<br />
suffered losses because of overtopping of nine of <strong>the</strong> 15 units in <strong>the</strong> federally constructed<br />
Missouri River Levee System and virtually all <strong>the</strong> nonfederal farm levees in <strong>the</strong> district<br />
Extent<br />
Region L is a highly populated and traveled area within <strong>the</strong> state which is co-located with <strong>the</strong><br />
Missouri and Kansas Rivers. The levees and dams that protect <strong>the</strong> planning area are critical to<br />
ensuring <strong>the</strong> safety of <strong>the</strong> population, property, and infrastructure. The planning committee has<br />
determined that a dam or levee failure would be critical to <strong>the</strong> Region with 25% - 50% of<br />
property severely damaged, a complete shutdown of critical facilities for at least two weeks, and<br />
injuries or illnesses that could result in permanent disability.<br />
Probability of Future Hazard Events<br />
Dam Failure<br />
Due to <strong>the</strong> variability of <strong>the</strong> size and construction of <strong>the</strong> dams in Kansas, estimating <strong>the</strong><br />
probability of dam failure is difficult on any scale greater than a case-by-case basis. The limited<br />
data on previous occurrences indicates that in <strong>the</strong> last 87 years, <strong>the</strong>re have been 7 recorded<br />
dam failure events in Kansas which is less than 1 event in 10 years. T<strong>here</strong>fore, this hazard’s<br />
CPRI probability is “Unlikely” (event is possible within <strong>the</strong> next 10 years)<br />
3.47
Levee Failure<br />
Although both federal and nonfederal levees have been damaged in previous regional flood<br />
events such as <strong>the</strong> floods in 1993, 2007, and 2011, <strong>the</strong> damage has not resulted in catastrophic<br />
failure and/or damages. Table 3.25 and Table 3.26 show <strong>the</strong> estimated losses and damages<br />
should a levee fail in <strong>the</strong> planning area. Levees in <strong>the</strong> Region, and Kansas that have been<br />
constructed to protect development and populations from <strong>the</strong> 1-percent annual chance flood are<br />
routinely inspected and maintained. Based on current historical data pertaining to<br />
damaging/significant Levee Failure incidents in <strong>the</strong> State of Kansas, This hazard’s CPRI<br />
probability is “Unlikely” (event is possible within <strong>the</strong> next 10 years).<br />
Impact and Vulnerability<br />
The probability is unlikely that a failure will occur, however, in <strong>the</strong> event it did <strong>the</strong> potential<br />
losses to Region L through dam or levee failure could be catastrophic. The following table<br />
shows <strong>the</strong> population and structural losses should a levee failure occur. Data limitations exists<br />
to include lack of delineation for all levees.<br />
Table 3.25. Populations and Values Protected by Levees (by Mitigation Planning Region)<br />
Region<br />
County<br />
Structural Exposure<br />
($1000’s)<br />
Contents<br />
Exposure<br />
($1000’s)<br />
Total Exposure<br />
($1000’s) Population<br />
L Leavenworth $6,166 $3,617 $9,783 76<br />
L Wyandotte $1,298,365 $1,421,835 $2,720,200 3,936<br />
Source: FEMA Mid-term Levee Inventory, 2010<br />
To estimate potential losses associated with levee failure, 20% loss was considered for all<br />
development (structural and content).<br />
Table 3.26 Estimates of Potential Loss-Levee Failure for Region L<br />
Value of Development in<br />
Region<br />
County<br />
levee Protected Areas<br />
($1000s)<br />
Loss Estimates at 20%<br />
Damage ($1000s)<br />
L Wyandotte $2,720,200 $544,040<br />
L Leavenworth $9,783 $1,957<br />
L Total $2,729,983 $545,997<br />
The impact on lives, structures, and <strong>the</strong> economy could be catastrophic, depending on <strong>the</strong> size<br />
of <strong>the</strong> dam or levee failure. During <strong>the</strong> Missouri River floods of 2011, levee failure in Wyandotte<br />
and Leavenworth Counties was extensive; however <strong>the</strong>re was no loss of life due to <strong>the</strong>se<br />
failures. The expense was concentrated in <strong>the</strong> rebuilding of <strong>the</strong> levees.<br />
3.48
Dams<br />
All high and significant hazard dams are required to have and maintain emergency action plans<br />
in <strong>the</strong> event of an incident. This has not been re-enforced and throughout <strong>the</strong> state <strong>the</strong> number<br />
of dams far exceeds <strong>the</strong> number that does not have plans. State-wide this number is 111 plans<br />
for <strong>the</strong> 227 high hazard dams, and only 19 plans for <strong>the</strong> 209 significant dams.<br />
The Kansas Water Plan noted in 2009 that some of <strong>the</strong> dams are exhibiting structural<br />
deficiencies due to age, and post-construction development downstream of o<strong>the</strong>rs has raised<br />
<strong>the</strong>ir hazard class.<br />
Some of <strong>the</strong> common problems seen with aging dams are:<br />
• Deteriorating metal pipes and structural components<br />
• Inadequate hydrologic capacity<br />
• Increased runoff because of upstream development<br />
To complete an analysis of vulnerability to dam failure as well as attempt to describe<br />
vulnerability in terms of <strong>the</strong> jurisdictions most threatened by dam failure, points were assigned to<br />
each type of dam and <strong>the</strong>n aggregated for a total point score for each county. Points were<br />
assigned as follows for each dam: Low Hazard Dams, 1 point, Significant Hazard Dams, 2<br />
points, High Hazard Dams, 3 points, High Hazard Dams without an EAP, an additional 2 points,<br />
Federal Reservoir Dams, 3 points. This analysis does not intend to demonstrate vulnerability in<br />
terms dam structures that are likely to fail, but ra<strong>the</strong>r provides a general overview of <strong>the</strong><br />
counties that have a high number of dams, with weighted consideration given to dams whose<br />
failure would result in greater damages. Table 3.27 shows <strong>the</strong> results of this analysis for each<br />
county in Region L.<br />
Table 3.27 Dam Failure Vulnerability Analysis<br />
Low<br />
Hazard<br />
Dams<br />
Significant<br />
Hazard<br />
Dams<br />
High<br />
Hazard<br />
Dams<br />
High<br />
Hazard<br />
Dams<br />
Without<br />
EAP<br />
Vulnerability<br />
Level<br />
Federal Vulnerability<br />
County<br />
Reservoirs Rating<br />
Mitigation Planning Region L<br />
Johnson 68 9 31 15 1 212 High<br />
Leavenworth 159 3 6 3 2 195 Medium-High<br />
Wyandotte 29 2 13 5 82 Medium<br />
Total 256 14 50 23 3 489<br />
Source: Kansas Department of Agriculture, Division of Water Resources, Water Structures program, U.S. Army<br />
Corps of Engineers, Bureau of Reclamation, U.S. Army, U.S. Fish and Wildlife, State Hazard Mitigation Plan<br />
Table 3.28 shows <strong>the</strong> top ten counties by dam failure vulnerability rating based on <strong>the</strong><br />
vulnerability analysis methodology described above. The top ten counties for <strong>the</strong> state are<br />
shown to put <strong>the</strong> placement of <strong>the</strong> counties of Region L in perspective.<br />
3.49
Table 3.28 Top 10 Counties by Dam Failure Vulnerability Rating<br />
Mitigation<br />
Planning<br />
Region<br />
County<br />
K Jefferson 327<br />
G Butler 277<br />
K Jackson 267<br />
K Brown 243<br />
K Atchison 225<br />
L Johnson 212<br />
K Nemaha 206<br />
L Leavenworth 195<br />
J Shawnee 190<br />
H Greenwood 187<br />
Source: State Hazard Mitigation Plan, 2013<br />
Levees<br />
Vulnerability<br />
Rating<br />
Delineation of areas protected is included in <strong>the</strong> MLI geodatabase for 107 of <strong>the</strong> 136 levees<br />
cataloged. To complete an analysis of vulnerability to levee failure as well as attempt to<br />
describe vulnerability in terms of <strong>the</strong> jurisdictions most threatened by levee failure, this data was<br />
used, along with census block data available in HAZUS MH 2.1 to determine <strong>the</strong> number of<br />
people and <strong>the</strong> value of development in <strong>the</strong>se identified levee protected areas. This analysis<br />
does not attempt to evaluate which levees are more prone to overtopping or failure, but ra<strong>the</strong>r<br />
provide a general picture of those counties that have more people and property protected by<br />
levees and <strong>the</strong>refore <strong>the</strong> potential for more damage if failure or overtopping were to occur.<br />
Table 3.29 provides a breakdown by county of <strong>the</strong> population, structure value, contents value,<br />
and total value in levee protected areas for <strong>the</strong> 107 levees in <strong>the</strong> MLI with available delineated<br />
protection areas. This data is to be used only for general determination of those areas of <strong>the</strong><br />
state that could suffer <strong>the</strong> greatest losses in <strong>the</strong> event of levee failure events. Data limitations<br />
prevent a more accurate analysis including: lack of delineation of protected areas for all levees<br />
and, lack of statewide parcel-type data which would provide more accurate results in<br />
determining structures and values within levee protected areas.<br />
Table 3.29 Populations and Values Protected by Levees<br />
Mitigation<br />
Structure Exposure Contents<br />
Total Exposure<br />
County<br />
Planning Region<br />
(1,000s)<br />
Exposure (1000s) (1000s)<br />
Population<br />
L Leavenworth $6,166 $3,617 $9,783 76<br />
L Wyandotte $1,298,365 $1,421,835 $2,720,200 3,936<br />
L Total $1,304,531 $1,425,452 $2,729,983 4,012<br />
3.50
Table 3.30 Top 10 Counties – Development and Populations Protected by Levees<br />
Development<br />
Population<br />
Mitigation<br />
Planning<br />
Region<br />
County<br />
Total<br />
Development<br />
in Levee<br />
Protected<br />
Areas<br />
Mitigation<br />
Planning<br />
Region<br />
County<br />
Population<br />
G Sedgwick $18,180,862 G Sedgwick 140,247<br />
G Reno $5,090,378 G Reno 45,171<br />
F Saline $4,621,575 F Saline 41,580<br />
L Wyandotte $2,720,200 J Shawnee 19,047<br />
J Shawnee $2,278,254 E Barton 16,751<br />
E Barton $1,848,122 G Cowley 12,904<br />
G Cowley $1,441,248 B Ellis 9,603<br />
B Ellis $1,164,170 D Ford 4,728<br />
I Riley $521,874 L Wyandotte 3,936<br />
F Dickinson $438,595 F Dickinson 3,543<br />
Source: State Hazard Mitigation Plan, 2013<br />
Summary<br />
Region L has low, significant and high hazard dams within its borders, and numerous accredited<br />
and unaccredited levees. The levees provide protection to $2,729,983 in property with a 20%<br />
loss estimate of $545,997, and approximately 4000 individuals. A levee failure could be<br />
catastrophic for <strong>the</strong> planning area, however, <strong>the</strong> probability of this happening is unlikely. T<strong>here</strong><br />
have been no dam failures within <strong>the</strong> planning area.<br />
Local Mitigation Concerns<br />
• Region L has its borders on <strong>the</strong> Missouri River and <strong>the</strong> Kansas River, which are prone to<br />
flooding during high precipitation events. As with <strong>the</strong> floods of 2011, even states as far<br />
north as Montana can add to this problem when <strong>the</strong>y have record snow or rainfall, even<br />
when Kansas is in a drought. Ensuring that <strong>the</strong> levees and dams maintain <strong>the</strong>ir<br />
structural integrity to protect against breeches, overtopping, and failure continues to be a<br />
main priority.<br />
• Johnson and Leavenworth County have grown since <strong>the</strong> census of 2000 was taken and<br />
with that population growth is <strong>the</strong> critical area of housing growth, and ensuring that <strong>the</strong><br />
floodplains remain in a green zone as construction on new housing ensues.<br />
• While Wyandotte County has not seen <strong>the</strong> growth of Johnson and Leavenworth<br />
Counties, it does have a high industrial and commercial footprint. Mitigating against<br />
commercial loss can be an expensive endeavor for <strong>the</strong> county and its residents.<br />
• The USACE maintains many levee’s in and around <strong>the</strong> planning area, however, <strong>the</strong>re<br />
are also levees that are not federally maintained, so local jurisdictions or private property<br />
3.51
owners are responsible for maintaining <strong>the</strong> structures. As <strong>the</strong> levees age, <strong>the</strong> costs to<br />
repair and rebuild <strong>the</strong>m will increase.<br />
• Levee breeches can threaten wastewater treatment plants that are located in <strong>the</strong> area,<br />
causing shortages in this commodity.<br />
Development in Hazard Prone Areas<br />
Of <strong>the</strong> top 10 counties with <strong>the</strong> highest vulnerability rating for dam failure, 4 were also in <strong>the</strong> top<br />
10 for greatest housing unit gains from 2000 to 2010. Two of those four counties are Johnson<br />
and Leavenworth. It is not known if development is occurring within dam inundation zones.<br />
Most counties within Kansas do not have ordinances prohibiting or limiting development in dam<br />
inundation areas. If additional development does occur in inundation areas, <strong>the</strong> vulnerability to<br />
this hazard also increases.<br />
Levee Failure<br />
Of <strong>the</strong> top 10 counties in terms of development protected by levees, none in Region L made <strong>the</strong><br />
list. However, Leavenworth and Wyandotte counties do have numerous levees that do protect<br />
property and lives. If additional development and population growth is occurring in levee<br />
protected areas this increases <strong>the</strong> vulnerability should a levee failure or overtopping occur.<br />
Johnson County<br />
Table 3.31. Johnson County CPRI<br />
Hazard Type Probability Magnitude<br />
Warning<br />
Time Duration CPRI<br />
Planning<br />
Significance<br />
Johnson County<br />
Dam and Levee Failure 1 3 2 3 1.95 Low<br />
Leavenworth County<br />
Table 3.32. Leavenworth County CPRI<br />
Hazard Type Probability Magnitude<br />
Warning<br />
Time Duration CPRI<br />
Planning<br />
Significance<br />
Leavenworth County<br />
Dam and Levee Failure 1 3 4 4 2.35 Moderate<br />
3.52
Wyandotte County<br />
Table 3.33. Wyandotte County CPRI<br />
Hazard Type Probability Magnitude<br />
Warning<br />
Time Duration CPRI<br />
Planning<br />
Significance<br />
Leavenworth County<br />
Dam and Levee Failure 1 4 3 3 2.40 Moderate<br />
Consequence (Impact) Analysis When a dam fails, <strong>the</strong> stored water can be suddenly<br />
released and have catastrophic effects on life and property downstream. Homes, bridges, and<br />
roads can be demolished in minutes. At least 7 dam failures have occurred in Kansas since<br />
1924. Residents near a Significant or High Hazard dam should become familiar with <strong>the</strong> dam’s<br />
emergency actions plans, if available. Emergency plans written for dams include procedures for<br />
notification and coordination with law enforcement and o<strong>the</strong>r governmental agencies,<br />
information on <strong>the</strong> potential inundation area, plans for warning and evacuation, and procedures<br />
for making emergency repairs.<br />
The impact of levee failure during a flooding event can be very similar to a dam failure in that<br />
<strong>the</strong> velocity of <strong>the</strong> water caused by sudden release as a result of levee breach can result in a<br />
flood surge or flood wave that can cause catastrophic damages. If <strong>the</strong> levee is overtopped as a<br />
result of flood waters in excess of <strong>the</strong> levee design, impacts are similar to flood impacts.<br />
The information in Table 3.30 provides <strong>the</strong> Consequence Analysis of Potential for Detrimental<br />
Impacts of Hazards done for accreditation with <strong>the</strong> Emergency Management Accreditation<br />
Program (EMAP).<br />
Table 3.34 Consequences Analysis: Dam and Levee Failure<br />
Subject Ranking Impacts/Dam and Levee Failure<br />
Health and Safety of Persons in <strong>the</strong><br />
Area of <strong>the</strong> Incident<br />
Severe<br />
Localized impact expected to be severe<br />
for <strong>the</strong> inundation area and moderate to<br />
minimal for o<strong>the</strong>r affected areas.<br />
Responders Minimal Impact to responders is expected to be<br />
minimal with proper training. Impact<br />
could be severe if <strong>the</strong>re is lack of<br />
training.<br />
Continuity of Operations Minimal Temporary relocation may be necessary<br />
if inundation affects government<br />
facilities.<br />
Property, Facilities, and Infrastructure Minimal to Severe Localized impact could be severe in <strong>the</strong><br />
inundation area of <strong>the</strong> incident to<br />
facilities and infrastructure. The fur<strong>the</strong>r<br />
away from <strong>the</strong> incident area <strong>the</strong> damage<br />
lessens to minimal to moderate.<br />
Delivery of Services Minimal to Severe Delivery of services could be affected if<br />
<strong>the</strong>re is any disruption to <strong>the</strong> roads<br />
and/or utilities due to <strong>the</strong> inundation.<br />
3.53
Minimal to severe depending on area<br />
size and location affected.<br />
Environment Severe Impact will be severe for <strong>the</strong> immediate<br />
impacted area. Impact will lessen as<br />
distance increases from <strong>the</strong> immediate<br />
incident area.<br />
Economic Conditions Minimal to Severe Impacts to <strong>the</strong> economy will greatly<br />
depend on <strong>the</strong> scope of <strong>the</strong> inundation<br />
and <strong>the</strong> amount of time it takes for <strong>the</strong><br />
water to recede.<br />
Public Confidence in Jurisdiction’s<br />
Governance<br />
Minimal to Severe<br />
Depending on <strong>the</strong> perception of whe<strong>the</strong>r<br />
<strong>the</strong> failure could have been prevented,<br />
warning time, and <strong>the</strong> time it takes for<br />
response and recovery will greatly<br />
impact <strong>the</strong> public’s confidence.<br />
3.54
3.2.5 Drought<br />
Calculated Priority Risk Index<br />
Planning Significance<br />
2.95 Moderate<br />
Description<br />
Drought is defined as a condition of moisture levels significantly below normal for an extended<br />
period of time over a large area that adversely affects plants, animal life, and humans. It can<br />
also be defined in terms of meteorology, agricultural, hydrological and socio-economic.<br />
Meteorological drought is defined on <strong>the</strong> basis of <strong>the</strong> degree of dryness (in comparison to some<br />
“normal” or average amount) and <strong>the</strong> duration of <strong>the</strong> dry period. A meteorological drought must<br />
be considered as region-specific since <strong>the</strong> atmospheric conditions that result in deficiencies of<br />
precipitation are highly variable from region to region.<br />
Agricultural drought links various characteristics of meteorological (or hydrological) drought to<br />
agricultural impacts, focusing on precipitation shortages, differences between actual and<br />
potential evaporation, soil water deficits, reduced ground water or reservoir levels, and so forth.<br />
Plant water demand depends on prevailing wea<strong>the</strong>r conditions, biological characteristics of <strong>the</strong><br />
specific plant, its stage of growth, and <strong>the</strong> physical and biological properties of <strong>the</strong> soil.<br />
Deficient topsoil moisture at planting may hinder germination, leading to low plant populations<br />
per hectare and a reduction of final yield. However, if topsoil moisture is sufficient for early<br />
growth requirements, deficiencies in subsoil moisture at this early stage may not affect final<br />
yield if subsoil moisture is replenished as <strong>the</strong> growing season progresses or if rainfall meets<br />
plant water needs.<br />
Hydrological drought is associated with <strong>the</strong> effects of periods of precipitation (including snowfall)<br />
shortfalls on surface or subsurface water supply (i.e., streamflow, reservoir and lake levels,<br />
ground water). The frequency and severity of hydrological drought is often defined on a<br />
watershed or river basin scale. Although all droughts originate with a deficiency of precipitation,<br />
hydrologists are more concerned with how this deficiency plays out through <strong>the</strong> hydrologic<br />
system. Hydrological droughts are usually out of phase with or lag <strong>the</strong> occurrence of<br />
meteorological and agricultural droughts. It takes longer for precipitation deficiencies to show<br />
up in components of <strong>the</strong> hydrological system such as soil moisture, streamflow, and ground<br />
water and reservoir levels. As a result, <strong>the</strong>se impacts are out of phase with impacts in o<strong>the</strong>r<br />
economic sectors.<br />
Socioeconomic drought refers to when physical water shortage begins to affect people.<br />
The four different definitions all have significance in <strong>the</strong> planning area. A meteorological<br />
drought is <strong>the</strong> easiest to determine based on rainfall data and is an easier drought to monitor<br />
from rain gauges and reports. A hydrological drought means that stream and river levels are<br />
low, which also has an impact for surface water and ground water irrigators. In addition,<br />
discharges from reservoirs that are made to meet in stream targets, fur<strong>the</strong>r reduce <strong>the</strong> levels in<br />
3.55
<strong>the</strong> reservoirs—some of which are set to protect threatened and endangered mussel<br />
populations. An agricultural drought represents difficulty for <strong>the</strong> region’s agricultural-based<br />
economy and is also relatively easy to monitor based on crop viabilities for different regions.<br />
Periods of drought are normal occurrences in <strong>the</strong> region as a whole. Drought in <strong>the</strong> area is<br />
caused by severely inadequate amounts of precipitation that adversely affect farming and<br />
ranching, surface and ground water supplies, and uses of surface waters for navigation and<br />
recreation. Drought can also create favorable conditions for wildfires and wind erosion (See<br />
Section 3.3.20 Wildfire and Section 3.3.16 Soil Erosion and Dust).<br />
The impacts of drought can be categorized as economic, environmental, or social. Many<br />
economic impacts occur in agriculture and related sectors, including increasing food prices<br />
globally. In addition to obvious losses in yields in both crop and livestock production, drought is<br />
associated with increases in insect infestations, plant disease, and wind erosion. Droughts also<br />
bring increased problems with insects and disease to forests and reduce growth. The incidence<br />
of wildfires increases substantially during extended droughts, which in turn places both human<br />
and wildlife populations at higher levels of risk. Income loss is ano<strong>the</strong>r indicator used in<br />
assessing <strong>the</strong> impacts of drought because so many sectors are affected.<br />
Although environmental losses are difficult to quantify, increasing public awareness and concern<br />
for environmental quality has forced public officials to focus greater attention and resources on<br />
<strong>the</strong>se effects. Environmental losses are <strong>the</strong> result of damages to plant and animal species,<br />
wildlife habitat, and air and water quality, wildfires, degradation of landscape quality, loss of<br />
biodiversity, and soil erosion. Some of <strong>the</strong> effects are short-term and conditions quickly return<br />
to normal following <strong>the</strong> end of <strong>the</strong> drought. O<strong>the</strong>r environmental effects linger for some time or<br />
may even become permanent. Wildlife habitat, for example may be degraded through <strong>the</strong> loss<br />
of wetlands, lakes, and vegetation. However, many species will eventually recover from this<br />
temporary aberration. The degradation of landscape quality, with increased soil erosion, may<br />
lead to a more permanent loss of biological productivity of <strong>the</strong> landscape.<br />
Although drought is not predictable, long-range outlooks may indicate an increased chance of<br />
drought, which can serve as a warning (P.L. 109-430 established a National Integrated Drought<br />
Information System within <strong>the</strong> National Oceanic and Atmospheric Administration to improve<br />
drought monitoring and forecasting capabilities http://www.drought.gov/drought/). A drought<br />
period can last for months, years, or even decades. It is rarely a direct cause of death, though<br />
<strong>the</strong> associated heat, dust, and stress can all contribute to increased mortality.<br />
Location<br />
All of Region L is at risk, and has been in a drought 10% to 14.9% of <strong>the</strong> 100 years that span<br />
1895 – 1995. Drought affects agricultural land as well as <strong>the</strong> urban landscape and can put<br />
stress on homeowners should <strong>the</strong>ir property have structural issues due to lack of moisture<br />
content in <strong>the</strong> soil. Ano<strong>the</strong>r issue would be power production should <strong>the</strong> Missouri and Kansas<br />
Rivers become extremely low, and wildfires could increase threatening land, property, and<br />
people.<br />
3.56
Figure 3.10. Region L Drought Index 1895-1995<br />
3.57
In Region L, <strong>the</strong> primary source of water is surface water from rivers, federal reservoirs,<br />
multipurpose small lakes, and municipal lakes. Region L is bordered by <strong>the</strong> Missouri River and<br />
<strong>the</strong> Kansas River at various points, which are a main source of water for <strong>the</strong> Region.<br />
As of 26 Feburary 2013, <strong>the</strong> U.S. Drought Monitor shows Region L as being in a severe<br />
drought, down from an exceptional drought, as shown in figure 3.10.<br />
Previous Occurrences<br />
Kansas has had recurring periods of drought throughout history, some of <strong>the</strong>m lasting for<br />
extended periods of time. Figure 3.10 shows Kansas was in severe or extreme drought<br />
between 10 and 14.9% Percent of <strong>the</strong> last century. The Dust Bowl years of <strong>the</strong> 1930s being <strong>the</strong><br />
most well known. But, as Table 3.34 shows, drought in Kansas is a recurring <strong>the</strong>me.<br />
Table 3.34. Drought State Declaration Summary 2000-2012<br />
Date<br />
Executive<br />
Order<br />
Emergency Warning Watch<br />
Total<br />
Counties<br />
7/24/2012 12-10 105 0 0 105<br />
7/03/2012 12-08 36 55 14 105<br />
5/04/2012 12-07 0 16 75 91<br />
11/21/2011 11-48 40 24 37 101<br />
10/05/2011 11-37 30 29 27 86<br />
9/02/2011 11-29 17 42 21 80<br />
8/24/2011 11-27 15 26 36 77<br />
4/07/2011 11-06 0 20 27 47<br />
8/22/2008 08-11 0 4 7 11<br />
6/11/2008 08-07 0 5 8 13<br />
5/14/2007 07-13 0 0 0 0<br />
3/06/2007 07-04 0 3 57 60<br />
8/21/2006 06-09 0 105 0 105<br />
3/20/2006 06-04 0 80 25 105<br />
2/07/2006 06-03 0 6 66 69<br />
9/08/2004 04-09 0 6 9 15<br />
6/15/2004 04-08 31 12 14 57<br />
10/27/2003 03-22 28 77 0 105<br />
8/22/2003 03-19 11 0 0 11<br />
8/22/2003 03-18 0 94 0 94<br />
7/31/2003 03-16 3 0 0 52 52<br />
7/31/2003 03-15 3 0 53 0 53<br />
7/30/2002 0 83 22 105<br />
7/03/2002 0 61 0 61<br />
5/03/2002 0 0 41 41<br />
7/12/2000<br />
UREP<br />
& SO<br />
6/09/2000<br />
KLR &<br />
MO<br />
Source: Kansas Water Office, www.kwo.org/Reports%20&%20Publications/Drought/Tbl_drought_declarations_051107_twl.pdf<br />
3.58
No declarations were made in 2001, 2005, 2009, or 2010<br />
Declaration issued for river basins ra<strong>the</strong>r than counties. URER (Upper Republican) and SO (Solomon); KLR (Kansas Lower<br />
Republic and MO (Missouri) River Basins.<br />
Because drought has affected <strong>the</strong> whole state, <strong>the</strong> data provided below includes Region L in its<br />
synopsis:<br />
• 2012: The Kansas Water Office increased <strong>the</strong> frequency of <strong>the</strong> Drought/Climate report<br />
(<strong>found</strong> at www.kwo.org) to weekly for much of <strong>the</strong> year due to intensity of conditions. The<br />
Governor signed 3 executive orders this year for drought with all 105 counties were declared<br />
in emergency drought status with <strong>the</strong> last order. The Governor approved <strong>the</strong> June 2012<br />
Operations Plan for <strong>the</strong> Governor‘s Drought Response Team which updated activities and<br />
responses. The Governor’s Office created a Drought Resources Website,<br />
http://governor.ks.gov/kansasdrought-resources, to provide drought information for all Kansans<br />
and to utilize drought relief assistance initiatives.<br />
Drought conditions continued from 2011, although appeared to lessen in <strong>the</strong> early months of<br />
2012, when above normal precipitation occurred in February, March and April compared to<br />
30 year averages. By May 3 rd however, precipitation was well below normal and<br />
temperatures above. These conditions prompted <strong>the</strong> first 2012 Executive Order for drought<br />
watch and warning declarations for 91 counties. Conditions also included extremely low soil<br />
moisture for crops and vegetation. May was <strong>the</strong> second driest and third warmest on record.<br />
By June 5 th , 58 percent of <strong>the</strong> State was in moderate drought (D2) according to <strong>the</strong> U.S.<br />
Drought Monitor, with drought affecting all but portions of <strong>the</strong> south east to some degree. By<br />
<strong>the</strong> end of June, severe (D2) and extreme drought (D3) impacted in <strong>the</strong> majority of <strong>the</strong> State<br />
with <strong>the</strong> worst in western areas. By July, <strong>the</strong> entire state was in severe (D2) or worse, with<br />
areas of extreme (D3) and exceptional (D4) expanding. The areas of severity of drought<br />
changed, but <strong>the</strong> entire state remained at some level of drought for <strong>the</strong> rest of 2012.<br />
Temperatures and precipitation both contributed to <strong>the</strong> severity of drought conditions. July<br />
thru August was <strong>the</strong> warmest period on record, with numerous months ranking as driest or<br />
warmest for various locations, regions or <strong>the</strong> entire state. October to September was also<br />
<strong>the</strong> warmest on record. Overall, only two small areas of <strong>the</strong> State received near normal<br />
precipitation in 2012 with <strong>the</strong> majority receiving 25-90 percent of normal precipitation<br />
(through Dec 5). As of December 1, precipitation needed to return to normal moisture levels<br />
using <strong>the</strong> Palmer Drought Severity Index ranged from 3.5 inches in <strong>the</strong> southwest to<br />
9.31inches in east central division.<br />
USDA agricultural disaster due to drought was declared for all 105 counties in Kansas<br />
based on crop losses through a series of six designations in July and August. This makes<br />
producers eligible for certain emergency. The crop losses were estimated at $1.5 billion. At<br />
least 197communities and rural water districts in Kansas had voluntary or mandatory<br />
restrictions on water use as drought and high demand depleted public water supplies and<br />
challenged treatment and distribution. Mandatory restrictions were placed on water right<br />
holders junior to minimum desirable streamflow (MDS) in as many as 17 locations affecting<br />
540 water appropriations. Livestock ponds, feed and pasture were insufficient to meet<br />
needs. Contingencies for feed and water were made available to producers through hay<br />
3.59
networks, motor carrier authorities and emergency water from state fishing lakes and federal<br />
reservoirs. Despite <strong>the</strong>se efforts, livestock numbers in June marked <strong>the</strong> lowest cattle<br />
inventory since 1973. The risk of wildfires was high throughout <strong>the</strong> State with as many as<br />
78 counties issuing burn bans over some period of 2012. At least 41,000 acres burned. Dry<br />
conditions in <strong>the</strong> fall resulted in dust storms visible by satellite.<br />
• 2011: Precipitation for 2011 was -8.92 inches below normal for <strong>the</strong> year statewide, with<br />
climatic divisions varying from -3.51 to -14.36 inches below normal. The Governor signed 6<br />
executive orders between April and November for various drought stages over <strong>the</strong> year,<br />
increasing <strong>the</strong> number of counties to 100 in <strong>the</strong> November order including 40 counties in<br />
emergency stage. The year began with extraordinarily low winter moisture and <strong>the</strong> very little<br />
precipitation continued throughout <strong>the</strong> year. Throughout <strong>the</strong> year <strong>the</strong> severity and area<br />
affected varied. Drought conditions reached <strong>the</strong>ir greatest extent as reflected by <strong>the</strong><br />
Drought Monitor October 4 when exceptional drought (D4) covered 18 percent of <strong>the</strong> State<br />
while 93 percent of <strong>the</strong> State was shown as abnormally dry (D1-D4), 54 percent severe (D2-<br />
D4) and 33 percent extreme (D3-D4). Conditions improved slightly through <strong>the</strong> end of <strong>the</strong><br />
year.<br />
USDA agricultural disaster due to drought was declared for 70 counties in Kansas based on<br />
crop losses. Kansas agricultural losses were estimated by <strong>the</strong> Kansas Department of<br />
Agriculture at over $1.77 billion due to drought. The hot dry conditions in Kansas were<br />
centered in southwest and south central Kansas, being <strong>the</strong> hottest and driest for <strong>the</strong>se<br />
climatic areas since 1895. Many locations set new records for <strong>the</strong> number of days with<br />
temperatures of 100 o F or more, June through August. Statewide, soil moisture was around<br />
50 percent adequate as 2011 began but never exceeded 55 percent for topsoil moisture<br />
until November. Very little surplus existed all year for topsoil or subsoil moisture.<br />
The U.S. Army Corps of Engineer lakes and most rivers in Kansas received less than<br />
normal inflow during 2011, but <strong>the</strong> total reservoir inflows were sufficient to allow <strong>the</strong> lakes to<br />
operate near normal levels.<br />
At least 38 public water suppliers in 22 counties initiated conservation measures due to<br />
drought conditions. These include municipal, rural water districts and a community college.<br />
In 2011 MDS administration occurred on at least eight river systems effecting about 279<br />
water rights. 2011 marked <strong>the</strong> lowest January 1 cattle inventory in <strong>the</strong> U.S since 1958.<br />
Drought contributed to a three percent decrease in inventory by January 2012.<br />
• May 4, 2002–October 1, 2003: Beginning on May 4, 2002, <strong>the</strong> Palmer Drought Severity<br />
Index reached -2.5 in <strong>the</strong> northwest and southwest districts of <strong>the</strong> state and remained below<br />
that value, triggering activation of <strong>the</strong> Governor’s Drought Response Team. At its worst in<br />
2002, <strong>the</strong> PDSI was below -3.0 in six of nine meteorological districts. In 2002, rainfall was<br />
less than <strong>the</strong> Dust Bowl years in some parts of western Kansas. Lakes decreased<br />
significantly in size and ground water levels dropped. Low water in <strong>the</strong> Missouri River<br />
interfered with river barge traffic and necessitated <strong>the</strong> release of water from Milford, Tuttle<br />
Creek, and Perry Lakes.<br />
3.60
This drought caused many counties to impose water use restrictions and burn bans. Grazing<br />
was prohibited on government lands to protect <strong>the</strong> drought-stressed grass, affecting<br />
thousands of cattle. Emergency haying and grazing was allowed by <strong>the</strong> U.S. Department of<br />
Agriculture (USDA) on Conservation Reserve Program lands. All 105 counties were eligible<br />
for federal assistance through <strong>the</strong> U.S. Department of Agriculture (USDA). The drought had<br />
a $1.1 billion impact on crop production.<br />
• 1988–1992: The severity of this drought varied across <strong>the</strong> state. It was most severe in <strong>the</strong><br />
southwestern, central, and nor<strong>the</strong>astern parts of <strong>the</strong> state but minimal in <strong>the</strong> northwestern<br />
and sou<strong>the</strong>astern parts. Surface-water supplies were sufficient to meet demands through<br />
<strong>the</strong> end of water year 1988, but rainfall during this period was less than 50% of <strong>the</strong> longterm<br />
average, so quantities were insufficient to maintain soil moisture or contribute to<br />
ground-water supplies. Estimated drought-related losses to 1988 crops were $1 billion.<br />
Water levels in shallow aquifers declined rapidly and led to <strong>the</strong> abandonment of many<br />
domestic water wells. The drought of 1988 continued into <strong>the</strong> 1990s, but at a reduced level.<br />
• 1974–1982: This appeared to be a series of relatively short droughts at some stream<br />
gauging stations, but longer droughts at o<strong>the</strong>rs (similar to <strong>the</strong> 1962–1972 droughts). The<br />
recurrence interval of this drought was greater than 25 years in <strong>the</strong> north-central and<br />
sou<strong>the</strong>astern parts but was between 10 and 25 years across <strong>the</strong> remaining eastern twothirds<br />
of <strong>the</strong> state. The severity of this drought could not be determined for <strong>the</strong> western third<br />
of <strong>the</strong> state.<br />
• 1962–1972: The duration of this regional drought varied considerably across Kansas. Many<br />
of <strong>the</strong> stream flow records indicated alternating less than average and greater-than-average<br />
flows, while o<strong>the</strong>rs indicated less than average flows for <strong>the</strong> entire period. The recurrence<br />
interval was generally greater than 25 years but was between 10 and 25 years in parts of<br />
<strong>the</strong> northwestern, nor<strong>the</strong>astern, sou<strong>the</strong>rn, and sou<strong>the</strong>astern areas of <strong>the</strong> state.<br />
• 1952–1957: This regional drought had a recurrence interval greater than 25 years<br />
statewide. One exception was in <strong>the</strong> Big Blue River Basin, w<strong>here</strong> <strong>the</strong> recurrence interval<br />
was 10-25 years. Because of its severity and areal extent, this drought is used as <strong>the</strong> base<br />
period for studies of reservoir yields in Kansas. In 1954, 41 counties were declared eligible<br />
for aid under <strong>the</strong> Emergency Feed program. During this period, 175 cities reported water<br />
shortages, most of which restricted water use.<br />
• 1929–1942: This drought, which includes <strong>the</strong> Dust Bowl of <strong>the</strong> 1930s, was regional in scale<br />
and affected many of <strong>the</strong> Midwestern and western states. Never<strong>the</strong>less, it ranks among <strong>the</strong><br />
most significant national events of <strong>the</strong> twentieth century. The recurrence interval was greater<br />
than 25 years throughout Kansas. Drought, wind, and poor agricultural practices combined<br />
to result in enormous soil erosion. Agricultural losses were extreme, and many farms were<br />
abandoned. Effects of <strong>the</strong> drought sent economic and social ripples throughout <strong>the</strong> country,<br />
contributing to <strong>the</strong> economic, physical, and emotional hardships of <strong>the</strong> Great Depression.<br />
3.61
Extent<br />
The severity of a drought in Kansas has been deemed to be limited in nature by <strong>the</strong> planning<br />
committee. Injuries and illness would not result in permanent disability, critical facilities would<br />
not be shut down for more than a week, and 10 – 25% or less of property is severely damaged.<br />
Figure 3.11 shows <strong>the</strong> extent of <strong>the</strong> drought in <strong>the</strong> planning area for <strong>the</strong> period ending February<br />
26, 2013. Region L’s drought is categorized as severe.<br />
Figure 3.11<br />
Figure 3.12 shows <strong>the</strong> amount of precipitation needed to bring <strong>the</strong> PDI to -0.5, with Region L<br />
needing 3 – 9 inches.<br />
3.62
Figure 3.12. Region L Additional Precipitation Needed<br />
Probability of Future Hazard Events<br />
Based on historical data for Kansas, (26 disasters in 11 years), <strong>the</strong> State of Kansas, and by<br />
extension Region L, will experience drought conditions on a yearly basis. This hazard’s CPRI<br />
probability is “Highly Likely” (probable within <strong>the</strong> calendar year). With <strong>the</strong> advent of climate<br />
change, <strong>the</strong> hazard of drought may become a ‘normal’ condition for <strong>the</strong> state.<br />
Impact and Vulnerability<br />
T<strong>here</strong> are 3 phased drought stages (Watch, Warning, and Emergency Stages) that mirror <strong>the</strong><br />
stages used in <strong>the</strong> Kansas 2007 Municipal Water Conservation Plan Guidelines. The following<br />
are all factors monitored to determine <strong>the</strong> drought stage: Palmer Drought Severity Index,<br />
Standardized Precipitation Index, Percent of Normal Precipitation, Soil Moisture Percentile,<br />
Crop Moisture Index, Satellite Vegetative Health Index and <strong>the</strong> 7-Day Median Flow Percentile.<br />
The stages identified consider impacts along with moisture/water resource conditions. Kansas<br />
drought response transitions from primarily local response under a Drought Watch, with<br />
increases in <strong>the</strong> State and Federal roles at <strong>the</strong> Drought Warning and Drought Emergency<br />
stages. Table 3.35 shows <strong>the</strong> drought stage descriptions and impacts as a combination of U.S.<br />
Drought Monitor and <strong>the</strong> Municipal Guidelines.<br />
3.63
Table 3.35 Phased Drought Response Summary<br />
Stage<br />
Drought<br />
Watch<br />
Drought<br />
Warning<br />
Drought<br />
Emergency<br />
U.S. Drought<br />
Monitor<br />
Description<br />
Moderate<br />
Drought<br />
Severe<br />
Drought<br />
Extreme and<br />
Exceptional<br />
Drought<br />
Declared<br />
by Possible Impacts Response Summary<br />
Governor Some damage to crops and<br />
Governor notified by Kansas Water Office,<br />
pastures; high rangeland fire danger, Governor’s Drought Response Team<br />
streams or reservoirs low, serious activated, public notification, outdoor<br />
public water system shortage not burning bans may be imposed; public<br />
imminent, but likelihood of shortages water systems may implement State 1<br />
growing.<br />
Water Watch phase of municipal water<br />
conservation plan, Governor may request<br />
Governor<br />
Governor<br />
Crop damage to crops and pastures;<br />
high rangeland fire danger; streams<br />
or reservoirs low, serious public<br />
water system water shortages not<br />
imminent, but likelihood of shortages<br />
growing.<br />
Widespread major crop and pasture<br />
losses; extreme rangeland fire<br />
danger; stock water shortage;<br />
widespread public water system<br />
water shortages or restrictions;<br />
streamflow targets not met; reservoir<br />
supplies low.<br />
USDA disaster Declaration for drought.<br />
Public water systems may implement<br />
Stage 2 Water Warning phase of<br />
municipal water conservation plan; Hay<br />
and Pasture Exchange activated; urgent<br />
surplus water contracts from state<br />
controlled storage authorized; Governor<br />
may request authorization for haying and<br />
grazing of Conservation Reserve Program<br />
acres; Governor may request USDA<br />
disaster declaration for drought.<br />
Governor may declare outdoor burning<br />
ban upon advice of Adjutant General;<br />
public water systems may implement<br />
Stage 3 Water Emergency phase of<br />
municipal water conservation plans;<br />
emergency surplus water contracts from<br />
state controlled storage authorized;<br />
emergency water withdrawals from<br />
USACE emergency water assistance;<br />
Governor may request Presidential<br />
disaster declaration and/or USDA disaster<br />
declaration for drought.<br />
Source: Kansas Drought Operations Plan, Governors Drought Team, June 2012<br />
Note: Adopted from U.S. Drought Monitor and Kansas 2007 Municipal Water Conservation Plan Guidelines.<br />
One of <strong>the</strong> most costly impacts of drought is <strong>the</strong> damage to <strong>found</strong>ations, parking lots, and o<strong>the</strong>r<br />
asphalt or concrete structures that are damaged as a result of <strong>the</strong> shrinking off soil that occurs<br />
along with drought, followed by <strong>the</strong> rapid swell that can occur when rains do come. Determining<br />
<strong>the</strong> direct and indirect costs associated with droughts is difficult because of <strong>the</strong> broad impacts of<br />
drought and <strong>the</strong> difficulty in establishing when droughts begin and end. As risk assessments<br />
from local mitigation plans become available, <strong>the</strong> estimated risk to individual counties from<br />
drought can be more accurately documented.<br />
Ano<strong>the</strong>r impact due to drought is its ability to severely challenge a public water supplier through<br />
depletion of <strong>the</strong> raw water supply and greatly increased customer water demand. Even if <strong>the</strong><br />
raw water supply remains adequate, problems due to limited treatment capacity or limited<br />
distribution system capacity may be encountered. A 2007 assessment of 800 city or rural water<br />
district drinking water systems by <strong>the</strong> Kansas Water Office <strong>found</strong> 132 to be drought vulnerable.<br />
Also, in <strong>the</strong> drought of 2012, <strong>the</strong>re are 197 communities and rural water districts, some that are<br />
also on <strong>the</strong> 2007 list, that have triggered some sort of water conservation to extend <strong>the</strong>ir supply<br />
(Source: http://www.kwo.org/reports_publications/Drought.htm). These two lists have been<br />
combined in Table 3.36 and create a new list of Drought Vulnerable Public Water Suppliers.<br />
Basic source limitations were <strong>the</strong> most common cause of drought vulnerability, followed by<br />
distribution system limitations.<br />
3.64
Table 3.36. Region L Drought Vulnerable Public Water Suppliers<br />
Public Water<br />
Supplier<br />
County<br />
2007 Limitation Category List* and/or<br />
2012 Conservation Stage** 2007 List<br />
Mitigation Planning Region L<br />
Bonner Springs Wyandotte Water Watch X<br />
Desoto Johnson Water Watch X<br />
Easton Leavenworth Basic Source X<br />
Edgerton Johnson Water Watch X<br />
Gardner Johnson Water Watch X<br />
Johnson RWD 06c Johnson Water Watch X<br />
Johnson RWD 07 Johnson Water Watch X<br />
Leavenworth RWD<br />
06 Leavenworth Unknown X<br />
Leavenworth RWD<br />
07 Leavenworth Contractual X<br />
Leavenworth RWD<br />
10 Leavenworth Water Watch X<br />
Leawood<br />
(WaterOne<br />
customer) Johnson Water Watch X<br />
Ola<strong>the</strong> Johnson Water Watch X<br />
Prairie Village<br />
(WaterOne<br />
customer) Johnson Water Watch X<br />
Spring Hill Johnson Water Watch X<br />
Tonganoxie Leavenworth Contractual X<br />
2012<br />
Conservation<br />
Stage<br />
The statistical analysis below uses two significant factors in determining <strong>the</strong> drought<br />
vulnerability for Region L. One is <strong>the</strong> USDA Risk Management Agency’s annualized insured<br />
crop losses as a result of drought conditions during <strong>the</strong> ten-year period of 2002-2011 and <strong>the</strong><br />
number of drought vulnerable public water suppliers in Kansas from Table 3.25 from above. It<br />
was determined that all counties in Region L have ei<strong>the</strong>r insured crop loss and/or drought<br />
vulnerable public water suppliers thus all counties are rated at least at a medium vulnerability<br />
rating since agriculture is a major economic factor in most of <strong>the</strong> Region L counties and public<br />
water supply is an essential service to all of <strong>the</strong> region.<br />
The rating values of <strong>the</strong> two factors were divided by 50 percent to determine <strong>the</strong> total drought<br />
vulnerability rating. The total drought vulnerability rating put all counties in ei<strong>the</strong>r <strong>the</strong> medium,<br />
medium-high or high category. Table 3.37 provides <strong>the</strong> factors considered and <strong>the</strong> rating values<br />
assigned.<br />
medium-high or high category. Table 3.26 provides <strong>the</strong> factors considered and <strong>the</strong> rating values<br />
assigned.<br />
3.65
Table 3.37. Ranges for Drought Vulnerability Factor Ratings<br />
Factors<br />
Considered Low (1) Low-Medium (2) Medium (3) Medium-High (4) High (5)<br />
Crop Loss Ratio<br />
Rating .599 to 2.817 2.818 to 4.595<br />
4.596 to<br />
6.373 6.374 to 8.151<br />
8.152 to<br />
14<br />
Drought<br />
Vulnerable Public<br />
Water Supplies<br />
Ratio Rating 1 2 3-6 7-9 10-14<br />
Total Drought<br />
Vulnerability<br />
Rating n/a n/a 1 2 to 3 4 to 5<br />
Table 3.38 below shows <strong>the</strong> variance of drought conditions by county in Region L.<br />
Table 3.38. Total Crop Exposure, Annualized Insured Crop Insurance Paid from 2002-2011,<br />
Number of Drought Vulnerable Public Water Suppliers and Vulnerability Rating per<br />
County.<br />
County<br />
Crop Exposure<br />
(2007 Census<br />
of Agriculture)<br />
Annualized Crop<br />
Insurance<br />
Paid/Drought<br />
Damage<br />
Annual Crop<br />
Claims Ratio<br />
Crop Loss<br />
Ratio Rating<br />
Mitigation Planning Region L<br />
Number of<br />
Drought<br />
Vulnerable<br />
Public Water<br />
Suppliers<br />
Drought<br />
Vulnerable<br />
Public Water<br />
Suppliers Rating<br />
Total Rating<br />
(Crops & Water<br />
Suppliers)<br />
Johnson $29,472,000 $488,597 1.658% 1 9 4 5<br />
Medium-<br />
High<br />
Leavenworth $20,983,000 $246,024 1.172% 1 5 3 4<br />
Medium-<br />
High<br />
Wyandotte* $0 $0 0.000% 0 1 1 1 Medium<br />
total $50,455,000 $734,620.70 15<br />
Source: USDA Risk Management Agency<br />
Vulnerability<br />
Rating<br />
It is difficult to determine <strong>the</strong> direct and indirect costs associated with droughts because of <strong>the</strong><br />
broad impacts of drought. This analysis only took into consideration <strong>the</strong> crop loss data and<br />
public water suppliers with drought vulnerability. Thus, <strong>the</strong>re may be more accurate documented<br />
in regional and local mitigation plans and direct costs associated with droughts.<br />
Summary<br />
The vulnerability to drought for <strong>the</strong> planning area is centered on transportation nodes, parking<br />
lots, utility poles and structural integrity. Individual homes are vulnerable to <strong>found</strong>ation cracks<br />
and impairment. Water supply in <strong>the</strong> Region could be affected as <strong>the</strong> Kansas and Missouri<br />
Rivers are main sources of potable water and when <strong>the</strong>ir levels go down, <strong>the</strong> population, crops,<br />
and livestock are affected. Loss estimates are too varied to estimate as <strong>the</strong> loss is dependent<br />
on <strong>the</strong> degree of <strong>the</strong> drought and <strong>the</strong> length of time it is within <strong>the</strong> area.<br />
3.66
Local Mitigation Concerns<br />
• Drought can severely challenge a public water supplier through depletion of <strong>the</strong> raw<br />
water supply and greatly increased customer water demand. Even if <strong>the</strong> raw water<br />
supply remains adequate, problems due to limited treatment capacity or limited<br />
distribution system capacity may be encountered.<br />
• http://www.kwo.org/reports_publications/Drought.htm). These two lists have been<br />
combined in Table 3.39 and create a new list of Drought Vulnerable Public Water<br />
Suppliers for Region L. Basic source limitations were <strong>the</strong> most common cause of<br />
drought vulnerability, followed by distribution system limitations. Table 3.39 shows<br />
<strong>the</strong>se drought vulnerable public water suppliers by county.<br />
Table 3.39 Drought Vulnerabilities of Public Water Suppliers by Region L County<br />
Public Water Supplier County 2007 Limitation Category List* 2012<br />
And/or<br />
Conservation<br />
2012 conservation State ** 2007 List List<br />
Region L<br />
Bonner Springs Wyandotte Water Watch X<br />
Desoto Johnson Water Watch X<br />
Easton Leavenworth Basic Source X<br />
Edgerton Johnson Water Watch X<br />
Gardner Johnson Water Watch X<br />
Johnson RWD 06c Johnson Water Watch X<br />
Johnson RWD 07 Johnson Water Watch X<br />
Leavenworth RWD<br />
06 Leavenworth Unknown X<br />
Leavenworth RWD<br />
07 Leavenworth Contractual X<br />
Leavenworth RWD<br />
10 Leavenworth Water Watch X<br />
Leawood<br />
(WaterOne<br />
customer) Johnson Water Watch X<br />
Ola<strong>the</strong> Johnson Water Watch X<br />
Prairie Village<br />
(WaterOne<br />
customer) Johnson Water Watch X<br />
Spring Hill Johnson Water Watch X<br />
Tonganoxie Leavenworth Contractual X<br />
Source: Kansas Water Office<br />
* Drought Limitation Categories<br />
Basic Source Limitation—The supplier’s primary raw water source is particularly sensitive to drought as evidenced by depleted<br />
streamflow, depleted reservoir inflow and storage, or by declining water levels in wells. Restrictions imposed due to inability to<br />
use a well(s) because water quality problems were considered indicative of a basic source limitation.<br />
Contractual Limitation—The supplier’s sole water source is purchased from ano<strong>the</strong>r system that is drought vulnerable and <strong>the</strong>re<br />
is a drought-cut-off clause in <strong>the</strong>ir water purchase contract. In such situations w<strong>here</strong> <strong>the</strong>re is not a drought cut-off clause, <strong>the</strong><br />
purchaser is considered drought vulnerable under <strong>the</strong> same limitation category as <strong>the</strong> seller.<br />
Distribution System Limitation—The supplier has difficulty or is unable to meet drought-induced customer demand for water<br />
because of inadequate finished water storage capacity, inadequate finished water pumping capacity, inadequate transmission<br />
line sizes, etc.<br />
Minimum Desirable Streamflow—The supplier reported imposing restrictions because of minimum desirable streamflow<br />
administration. Water rights junior to those granted for maintenance of established minimum desirable flows are subject to such<br />
administration.<br />
3.67
Single Well Source—The supplier relies upon a single well as its sole source for raw water. Suppliers with one active well and<br />
one emergency well were considered drought vulnerable because emergency wells are not a dependable long-term water<br />
source. Excessive hours of operation to meet drought-induced customer demand for water will result in <strong>the</strong> increased likelihood<br />
of mechanical breakdown with no alternative water supply source available.<br />
Treatment Capacity Limitation—The supplier has difficulty or is unable to meet drought-induced customer demand for water due<br />
to inadequate raw water treatment capacity.<br />
Water Right Limitation—The supplier reported imposing restrictions because <strong>the</strong> quantity of water <strong>the</strong>y are authorized to divert<br />
under <strong>the</strong>ir water right(s) was insufficient to meet customer demands.<br />
** 2012 Conservation Implementation Stages are Water Watch =1, Water Warning = 2 and Water Emergency =3 as per local<br />
water conservation plans. State level may reflect State Drought Stages but should be tied to local supply conditions. Source:<br />
Kansas Drought Operations Plan, June 2012<br />
• The Missouri River flows to <strong>the</strong> east of Leavenworth and Wyandotte counties, and is a<br />
main navigation route for commercial vessels. With <strong>the</strong> decrease in precipitation, <strong>the</strong><br />
Missouri River water levels could potentially hurt <strong>the</strong> shipping industry as well as power<br />
production for <strong>the</strong> extended Region.<br />
• Agricultural crops and livestock could potentially be affected should <strong>the</strong> drought<br />
continue. Both of <strong>the</strong>se entities require water in order to flourish and should water<br />
levels become restricted <strong>the</strong>y will suffer, ultimately affecting <strong>the</strong> farmers that rely on <strong>the</strong><br />
agricultural industry as <strong>the</strong>ir livelihood.<br />
• Drought comes with a host of o<strong>the</strong>r issues that can affect <strong>the</strong> property and people that<br />
live in <strong>the</strong> Region. With low moisture content wildfires could potentially increase,<br />
threatening crops, livestock, and urban living areas.<br />
Development in Hazard Prone Areas<br />
Drought does not normally cause damage to buildings and critical facilities, however, severe<br />
and exceptional drought over an extended period of time can cause integrity issues to<br />
<strong>found</strong>ations. This in turn can affect new development as construction of new buildings are built<br />
on soil that has been depleted of its moisture content leading to instability when rains do come.<br />
Ano<strong>the</strong>r issue for development is <strong>the</strong> increase of populations within <strong>the</strong> planning area will create<br />
greater demands on <strong>the</strong> public water suppliers.<br />
Johnson County<br />
Table 3.40. Johnson County CPRI for Drought<br />
Hazard Type Probability Magnitude<br />
Warning<br />
Time Duration CPRI<br />
Planning<br />
Significance<br />
Johnson County<br />
Drought 4 2 1 4 2.95 Moderate<br />
3.68
Leavenworth County<br />
Table 3.41. Leavenworth County CPRI: Drought<br />
Hazard Type Probability Magnitude<br />
Warning<br />
Time Duration CPRI<br />
Planning<br />
Significance<br />
Leavenworth County<br />
Drought 4 2 1 4 2.95 Moderate<br />
Wyandotte County<br />
Table 3.42. Wyandotte County CPRI: Drought<br />
Hazard Type Probability Magnitude<br />
Warning<br />
Time Duration CPRI<br />
Planning<br />
Significance<br />
Leavenworth County<br />
Drought 4 2 1 4 2.95 Moderate<br />
Consequence (Impact) Analysis<br />
The information in Table 3.43 provides <strong>the</strong> Consequence Analysis of Potential for Detrimental<br />
Impacts of Hazards done for accreditation with <strong>the</strong> Emergency Management Accreditation<br />
Program (EMAP).<br />
Table 3.43. Consequence Analysis: Drought<br />
Subject Ranking Impacts/Drought<br />
Health and Safety of Persons in <strong>the</strong><br />
Area of <strong>the</strong> Incident<br />
Minimal - Moderate<br />
Drought impact tends to be agricultural, however,<br />
because of <strong>the</strong> lack of precipitation that precipitates<br />
drought, water supply disruptions can occur which<br />
can affect people. Impact is expected to be minimal.<br />
With proper preparedness and protection, impact to<br />
<strong>the</strong> responders is expected to be minimal.<br />
Responders<br />
Minimal<br />
Continuity of Operations Minimal Minimal expectation for utilization of <strong>the</strong> COOP.<br />
Impact to property, facilities, and infrastructure could<br />
be minimal to severe, depending on <strong>the</strong> length and<br />
Property, Facilities, and<br />
intensity of <strong>the</strong> drought. Structural integrity of<br />
Infrastructure<br />
Minimal to Severe buildings, and buckling of roads could occur.<br />
Delivery of Services<br />
Environment<br />
Economic Conditions<br />
Public Confidence in Jurisdiction’s<br />
Governance<br />
Minimal<br />
Minimal to Severe<br />
Minimal to<br />
Moderate<br />
Minimal<br />
Impact on <strong>the</strong> delivery of services should be nonexistent<br />
to minimal, unless transportation nodes are<br />
affected.<br />
The impact to <strong>the</strong> environment could be severe.<br />
Drought can severely affect farming, ranching, wildlife<br />
and plants due to <strong>the</strong> lack of precipitation.<br />
Impacts to <strong>the</strong> economy will be dependent on how<br />
extreme <strong>the</strong> drought is and how long it lasts.<br />
Communities that depend on water recreation could<br />
be tested, as well as agricultural. Minimal to<br />
Moderate.<br />
Confidence could be at issue during periods of<br />
extreme drought if planning is not in place to address<br />
intake needs and loss of agricultural crops.<br />
3.69
3.3.5 Earthquake<br />
Calculated Priority Risk Index<br />
Description<br />
Planning Significance<br />
1.75 Low<br />
Earthquakes are defined as shifts in <strong>the</strong> earth’s crust causing <strong>the</strong> surface to become unstable.<br />
The earth’s crust is made up of gigantic plates, commonly referred to as tectonic plates. These<br />
plates form what is known as <strong>the</strong> lithosp<strong>here</strong>, which varies in thickness from 6.5 miles (beneath<br />
oceans) to 40 miles (beneath mountain ranges), and has an average thickness of 20 miles.<br />
These plates “float over a partly melted layer of crust called <strong>the</strong> as<strong>the</strong>nosp<strong>here</strong>. The plates are<br />
in motion, and areas w<strong>here</strong> one plate joins ano<strong>the</strong>r are referred to as “plate boundaries.” Most<br />
earthquake faults occur along plate boundaries w<strong>here</strong> plates push or pull <strong>the</strong> crust so much that<br />
<strong>the</strong> crust breaks.<br />
Seismic waves are <strong>the</strong> vibrations from earthquakes that travel through <strong>the</strong> Earth; <strong>the</strong>y are<br />
recorded on instruments called seismographs. Seismographs record a zig-zag trace that shows<br />
<strong>the</strong> varying amplitude of ground oscillations beneath <strong>the</strong> instrument. The Richter magnitude<br />
scale was developed in 1935 by Charles F. Richter of <strong>the</strong> California Institute of Technology as a<br />
ma<strong>the</strong>matical device to compare <strong>the</strong> size of earthquakes. The magnitude of an earthquake is<br />
determined from <strong>the</strong> logarithm of <strong>the</strong> amplitude of waves recorded by seismographs.<br />
Adjustments are included for <strong>the</strong> variation in <strong>the</strong> distance between <strong>the</strong> various seismographs<br />
and <strong>the</strong> epicenter of <strong>the</strong> earthquakes. On <strong>the</strong> Richter Scale, magnitude is expressed in whole<br />
numbers and decimal fractions. For example, a magnitude 5.3 might be computed for a<br />
moderate earthquake, and a strong earthquake might be rated as magnitude 6.3. Because of<br />
<strong>the</strong> logarithmic basis of <strong>the</strong> scale, each whole number increase in magnitude represents a<br />
tenfold increase in measured amplitude; as an estimate of energy, each whole number step in<br />
<strong>the</strong> magnitude scale corresponds to <strong>the</strong> release of about 31 times more energy than <strong>the</strong> amount<br />
associated with <strong>the</strong> preceding whole number value.<br />
Earthquakes with magnitude of about 2.0 or less are usually called micro-earthquakes; <strong>the</strong>y are<br />
not commonly felt by people and are generally recorded only on local seismographs. Events<br />
with magnitudes of about 4.5 or greater are strong enough to be recorded by sensitive<br />
seismographs all over <strong>the</strong> world. Great earthquakes, such as <strong>the</strong> 1964 Good Friday earthquake<br />
in Alaska, have magnitudes of 8.0 or higher.<br />
The effect of an earthquake on <strong>the</strong> Earth's surface is called <strong>the</strong> intensity. The intensity scale<br />
consists of a series of certain key responses such as people awakening, movement of furniture,<br />
damage to chimneys, and finally - total destruction. Although numerous intensity scales have<br />
been developed over <strong>the</strong> last several hundred years to evaluate <strong>the</strong> effects of earthquakes, <strong>the</strong><br />
one currently used in <strong>the</strong> United States is <strong>the</strong> Modified Mercalli (MM) Intensity Scale. It was<br />
developed in 1931 by <strong>the</strong> American seismologists Harry Wood and Frank Neumann. This scale,<br />
composed of 12 increasing levels of intensity that range from imperceptible shaking to<br />
3.70
catastrophic destruction, is designated by Roman numerals. It does not have a ma<strong>the</strong>matical<br />
basis; instead it is an arbitrary ranking based on observed effects.<br />
The Modified Mercalli Intensity value assigned to a specific site after an earthquake has a more<br />
meaningful measure of severity to <strong>the</strong> nonscientist than <strong>the</strong> magnitude because intensity refers<br />
to <strong>the</strong> effects actually experienced at that place.<br />
The lower numbers of <strong>the</strong> intensity scale generally deal with <strong>the</strong> manner in which <strong>the</strong><br />
earthquake is felt by people. The higher numbers of <strong>the</strong> scale are based on observed structural<br />
damage. Structural engineers usually contribute information for assigning intensity values of VIII<br />
or above.<br />
The following is an abbreviated description of <strong>the</strong> 12 levels of Modified Mercalli intensity from<br />
<strong>the</strong> U.S. Geological Survey.<br />
I. Not felt except by a very few under especially favorable conditions.<br />
II. Felt only by a few persons at rest, especially on upper floors of<br />
buildings.<br />
III. Felt quite noticeably by persons indoors, especially on upper floors of<br />
buildings. Many people do not recognize it as an earthquake. Standing<br />
motor cars may rock slightly. Vibrations similar to <strong>the</strong> passing of a truck.<br />
Duration estimated.<br />
IV. Felt indoors by many, outdoors by few during <strong>the</strong> day. At night, some<br />
awakened. Dishes, windows, doors disturbed; walls make cracking<br />
sound. Sensation like heavy truck striking building. Standing motor cars<br />
rocked noticeably.<br />
V. Felt by nearly everyone; many awakened. Some dishes, windows<br />
broken. Unstable objects overturned. Pendulum clocks may stop.<br />
VI. Felt by all, many frightened. Some heavy furniture moved; a few<br />
instances of fallen plaster. Damage slight.<br />
VII. Damage negligible in buildings of good design and construction; slight<br />
to moderate in well-built ordinary structures; considerable damage in<br />
poorly built or badly designed structures; some chimneys broken.<br />
VIII. Damage slight in specially designed structures; considerable<br />
damage in ordinary substantial buildings with partial collapse. Damage<br />
great in poorly built structures. Fall of chimneys, factory stacks, columns,<br />
monuments, walls. Heavy furniture overturned.<br />
IX. Damage considerable in specially designed structures; well-designed<br />
frame structures thrown out of plumb. Damage great in substantial<br />
buildings, with partial collapse. Buildings shifted off <strong>found</strong>ations.<br />
3.71
Location<br />
X. Some well-built wooden structures destroyed; most masonry and<br />
frame structures destroyed with <strong>found</strong>ations. Rails bent.<br />
XI. Few, if any (masonry) structures remain standing. Bridges destroyed.<br />
Rails bent greatly.<br />
XII. Damage total. Lines of sight and level are distorted. Objects thrown<br />
into <strong>the</strong> air.<br />
Region L is in an area of relatively low seismic activity. The Region does lie between three<br />
earthquake fault zones, <strong>the</strong> Humboldt Fault and <strong>the</strong> associated Nemaha Ridge, also known as<br />
<strong>the</strong> Nemaha Uplift, in central Kansas and <strong>the</strong> New Madrid Fault in eastern Missouri. All<br />
counties in <strong>the</strong> region carry <strong>the</strong> same low risk of seismic activity.<br />
Figure 3.13 shows <strong>the</strong> probability of an earthquake with a magnitude greater than or equal to<br />
4.75 within 100 years in Region L.<br />
3.72
Figure 3.14. Humboldt Fault Zone<br />
Source: Kansas Geological Survey, Earthquakes in Kansas, www.kgs.ku.edu/Publications/GeoRecord/2001/vol7.3/Page1.html<br />
Previous Occurrences<br />
According to a FEMA report, Kansas ranks 45 among <strong>the</strong> states in <strong>the</strong> amount of damage<br />
caused by earthquakes in an average year. The Kansas City, Missouri, area was ranked 35th<br />
among 35 major metropolitan areas.<br />
The earliest reported earthquake in Kansas, and also <strong>the</strong> strongest, occurred on April 24,1867,<br />
in <strong>the</strong> Humboldt Fault zone near <strong>the</strong> town of Wamego. It had a magnitude of 5.5 and caused<br />
structural damage in Manhattan and minor damage in o<strong>the</strong>r nearby communities. T<strong>here</strong> were<br />
several injuries and some damage as well as a two-foot wave on <strong>the</strong> Kansas River at<br />
Manhattan. The tremor was felt over a 300,000 square mile area in <strong>the</strong> Midwest.<br />
O<strong>the</strong>r Notable Events<br />
• November 5, 2011: A 5.6 magnitude earthquake, centered in Oklahoma, sent waves all <strong>the</strong><br />
way up to KC. It was believed this quake was related to <strong>the</strong> Humboldt fault line.<br />
• July 24, 2001: A 3.0 magnitude earthquake in Butler County rattled computer screens at<br />
City Hall and shook several houses in Augusta. It occurred 24 miles above an area w<strong>here</strong><br />
four stems of <strong>the</strong> main Humboldt Fault line lie. It caused minor damage and injuries and was<br />
felt as far away as Dubuque, Iowa.<br />
• May 13, 1999: A 40-block section of KC was shaken by a 3.0 magnitude earthquake. About<br />
100 people evacuated from Indian Springs Medical Building, which was damaged in <strong>the</strong><br />
earthquake. The epicenter was in Kansas.<br />
• November 9, 1968: A 5.3 magnitude earthquake centered in sou<strong>the</strong>rn Illinois was felt in<br />
eastern Kansas.<br />
3.73
• April 9, 1952: A damaging earthquake centered near El Reno, Oklahoma, affected a total<br />
area of 140,000 square miles, including <strong>the</strong> entire eastern half of Kansas. The magnitude<br />
5.5 shock was felt in Kansas most strongly at Medicine Lodge. KC was also strongly<br />
affected.<br />
• March 18, 1927: An earthquake near White Cloud, in <strong>the</strong> extreme nor<strong>the</strong>astern portion of<br />
<strong>the</strong> state, rocked houses such that people rushed out of <strong>the</strong>m.<br />
• January 7, 1906: A magnitude 4.7 earthquake affected an area of about 10,000 square<br />
miles in Kansas, Missouri, and Nebraska. Chimneys were thrown down and some cracks in<br />
walls were observed at Manhattan. Houses and buildings vibrated at Topeka, w<strong>here</strong> a loud<br />
roaring sound was also heard. A series of small aftershocks were felt in Manhattan.<br />
• October 31, 1895: This earthquake near Charleston, Missouri, affected a million square<br />
miles over 23 states. The strongest effects in Kansas were reported in Topeka.<br />
• November 8, 1875: A moderate earthquake near Valley Falls north of Topeka was felt over<br />
8,000 square miles but did little damage.<br />
Extent<br />
Overall, Region L is in a low seismic activity area. The Nemaha fault would directly affect Riley<br />
and Pottawatomie Counties, and <strong>the</strong> New Madrid Seismic Zone follows <strong>the</strong> Mississippi River<br />
valley and is not expected to cause Region L any significant damage. Missourian’s trying to<br />
escape <strong>the</strong> carnage of <strong>the</strong> New Madrid Fault having a seismic event could inundate <strong>the</strong> Region,<br />
leading to sheltering and feeding issues. The magnitude of an earthquake in <strong>the</strong> planning area<br />
has been determined to be limited. Injuries and illnesses would not result in permanent<br />
disability, and shutdown of critical facilities would not last for more than a week. Approximately<br />
10 – 25% of property could be severely damaged.<br />
Probability of Future Hazard Events<br />
Figure 3.15 below depicts <strong>the</strong> probability that ground motion will reach a certain level during an<br />
earthquake. The data shows peak horizontal ground acceleration (<strong>the</strong> fastest measured change<br />
in speed for a particle at ground level that is moving horizontally because of an earthquake).<br />
The shaking level that has a 10 percent chance of being exceeded over a period of 50 years,<br />
which is more of a worst-case scenario, depicts <strong>the</strong> shaking level that has a 2 percent chance of<br />
being exceeded over a period of 50 years. Typically, significant earthquake damage occurs<br />
when accelerations are greater than 30% of gravity.<br />
3.74
Figure 3.15. Ground Shaking Horizontal Acceleration<br />
Source : U.S. Geological Survey, map generated by National Atlas of <strong>the</strong> United States, www.nationalatlas.gov/<br />
This hazard’s probability on a Regional level is ‘Unlikely’ to occur in <strong>the</strong> next three years.<br />
However, because of <strong>the</strong> dams and levees within Region L, it is imperative that <strong>the</strong> counties that<br />
make up this region are cognizant of <strong>the</strong> earthquake risks posed by <strong>the</strong> faults that reside to <strong>the</strong><br />
east and west of <strong>the</strong>m, and mitigate in order to prevent dam and levee failure.<br />
Impact and Vulnerability<br />
The impact of an earthquake in Region L would be minimal. Damages would result from earth<br />
shaking that is a result of an earthquake not in <strong>the</strong> Region. Displaced households for <strong>the</strong> total<br />
Region would be 407 in <strong>the</strong> case of a worst case event. Building loss would be $727,978 for <strong>the</strong><br />
same worst case event. While Region L does rank in <strong>the</strong> top 10 counties for damages due to<br />
an earthquake during a worst case event, this scenario is based on a 2,500 year span.<br />
While Region L is not in a high shake zone, and <strong>the</strong> counties that make up <strong>the</strong> region are not<br />
alongside of a fault, losses could still potentially be great in terms of damages due to <strong>the</strong><br />
development and population base being higher. So, although earthquake shaking would be<br />
less severe in some populated areas, <strong>the</strong> damages may be greater due to more buildings and<br />
populations in those areas. Particularly if <strong>the</strong> building structures are more than one story.<br />
Table 3.44 provides estimated building losses and displaced households for Region L, as a<br />
result of a 2,500 year probabilistic 6.7 Magnitude earthquake followed by Table 3.45 that shows<br />
Region L as being in <strong>the</strong> top 10 counties in terms of building damage. Table 3.46 shows <strong>the</strong><br />
top 10 counties in terms of displaced households. These tables reflect damages from a worst<br />
case scenario event.<br />
3.75
Table 3.44. Worst-Case 2,500 Year, 6.7 Magnitude Earthquake Total Building Loss and<br />
Displaced Households by County<br />
Total Earthquake Losses<br />
(1000’s)<br />
Displaced<br />
Households<br />
County<br />
Johnson $522,644 282<br />
Leavenworth $52,209 29<br />
Wyandotte $153,125 96<br />
Total $727,978
Table 3.46. Worst-Case 2,500 Year, 6.7 Magnitude Earthquake Top 10<br />
Counties by Displaced Households<br />
Mitigation<br />
Planning<br />
Region County<br />
Displaced<br />
Households<br />
L Johnson 282<br />
G Sedgwick 233<br />
J Shawnee 112<br />
L Wyandotte 96<br />
K Douglas 86<br />
I Riley 68<br />
L Leavenworth 29<br />
H Crawford 24<br />
I Lyon 20<br />
U Geary 20<br />
Source: State Hazard Mitigation Plan 2013<br />
In Table 3.47 data taken from Hazus-MH 2.1 indicates <strong>the</strong> shake zones that could potentially<br />
affect <strong>the</strong> counties within Region L. This analysis is based on a worst case 2500 year, 6.7<br />
magnitude earthquake.<br />
Table 3.47. Worst-Case 2500-Year, 6.7 Magnitude Earthquake Ground Shaking<br />
Potential for Each Kansas County in Region L.<br />
County<br />
Johnson<br />
Leavenworth<br />
Wyandotte<br />
0% to<br />
4.2%<br />
PGA<br />
4.3% to<br />
5.0%<br />
PGA<br />
5.1% to<br />
6.0%<br />
PGA<br />
x<br />
x<br />
x<br />
6.1% to<br />
7.5%<br />
PGA<br />
Subtotal 0 0 3 0 0<br />
Source: State Hazard Mitigation Plan 2013<br />
Summary<br />
7.6% PGA and<br />
Higher<br />
The planning area is at a low risk for seismic activity. It lies between two faults, <strong>the</strong> New<br />
Madrid, and <strong>the</strong> Humboldt Fault, but far enough away that any damages would be due to earth<br />
shaking and not a direct quake. At issue for <strong>the</strong> region would be <strong>the</strong> influx of people from <strong>the</strong><br />
fault zones and <strong>the</strong> subsequent feeding and sheltering of <strong>the</strong>se individuals for an extended<br />
period of time.<br />
Local Mitigation Concerns<br />
• Region L is in a low seismic activity area, however, earth shaking at a low magnitude<br />
can still cause damage to property and people. The counties that make up <strong>the</strong> region<br />
have tall buildings that are prone to <strong>the</strong> effects of shaking. Along with <strong>the</strong> hilly terrain in<br />
<strong>the</strong> region, earth shaking could cause extensive damage.<br />
3.77
• An area of concern for <strong>the</strong> region is <strong>the</strong> influx of individuals that are relocating due to a<br />
seismic event at <strong>the</strong> New Madrid Fault in Missouri. Short term shelter, and long term<br />
residence could strain <strong>the</strong> infrastructure and economy.<br />
• Region L has various dams and levees that could be an issue due to earth or ground<br />
shaking.<br />
Development in Hazard Prone Areas<br />
While Region L is not in a high hazard area for a severe, catastrophic earthquake event, <strong>the</strong><br />
population density and building count ensure that it will be at risk for damaged buildings and<br />
displaced households. With this in mind it could behoove <strong>the</strong> Region to adopt seismic design<br />
standards for any new development, particularly for critical and essential facilities to minimize<br />
any tremor or shaking impact.<br />
Table 3.48. Johnson County CPRI: Earthquake<br />
Hazard Type Probability Magnitude<br />
Warning<br />
Time Duration CPRI<br />
Planning<br />
Significance<br />
Johnson County<br />
Earthquake 1 2 4 1 1.75 Low<br />
Leavenworth County<br />
Table 3.49. Leavenworth County CPRI: Earthquake<br />
Hazard Type Probability Magnitude<br />
Warning<br />
Time Duration CPRI<br />
Planning<br />
Significance<br />
Leavenworth County<br />
Earthquake 1 2 4 1 1.75 Low<br />
Wyandotte County<br />
Table 3.50. Wyandotte County CPRI Earthquake<br />
Hazard Type Probability Magnitude<br />
Warning<br />
Time Duration CPRI<br />
Planning<br />
Significance<br />
Wyandotte County<br />
Earthquake 1 2 4 1 1.75 Low<br />
3.78
Hazard Consequence (Impact) Analysis<br />
The information in Table 3.51 provides <strong>the</strong> Consequence Analysis of Potential for Detrimental<br />
Impacts of Hazards done for accreditation with <strong>the</strong> Emergency Management Accreditation<br />
Program (EMAP).<br />
Table 3.51.<br />
EMAP Consequence Analysis: Earthquake<br />
Subject Ranking Impacts/Earthquake<br />
Health and Safety of Persons in <strong>the</strong><br />
Area of <strong>the</strong> Incident<br />
Minimal<br />
Impact in <strong>the</strong> incident area expected to be<br />
minimal in <strong>the</strong> State of Kansas.<br />
Responders Minimal With proper preparedness and protection,<br />
impact to <strong>the</strong> responders is expected to be<br />
non-existent to minimal.<br />
Continuity of Operations Minimal COOP is not expected to be activated<br />
(minimal).<br />
Property, Facilities, and<br />
Infrastructure<br />
Minimal<br />
Impact to property, facilities, and<br />
infrastructure could be minimal. Facilities,<br />
Infrastructure, and personnel could be<br />
minimally affected.<br />
Delivery of Services Minimal No expectation of impact on services<br />
(minimal).<br />
Environment Minimal No expectation of environmental impact<br />
(minimal).<br />
Economic Conditions Minimal No expectation of economic conditions<br />
being impacted (minimal).<br />
Public Confidence in Jurisdiction’s<br />
Governance<br />
Minimal<br />
No change in confidence in jurisdictions<br />
governance (minimal).<br />
3.79
3.2.7 Expansive Soils<br />
Calculated Priority Risk Index<br />
2.20 Moderate<br />
Description<br />
Planning Significance<br />
A relatively widespread geologic hazard for Kansas, and by extension Region L, is <strong>the</strong> presence<br />
of soils that expand and shrink in relation to <strong>the</strong>ir water content. Expansive soils can cause<br />
physical damage to building <strong>found</strong>ations, roadways, and o<strong>the</strong>r components of <strong>the</strong> infrastructure<br />
when clay soils swell and shrink as a result of changes in moisture content. For Kansas, <strong>the</strong><br />
vulnerability to this hazard most frequently is associated with soils shrinking during periods of<br />
drought.<br />
Thirty-six states have expansive soils within <strong>the</strong>ir jurisdiction. Expansive soils are so extensive<br />
within parts of <strong>the</strong> United States that alteration of <strong>the</strong> highway routes to avoid expansive soils is<br />
virtually impossible. The Midwest is particularly problematic for construction because of <strong>the</strong><br />
varied mixture of clay soils. Each year in <strong>the</strong> United States, expansive soils cause billions of<br />
dollars in damage to buildings, roads, pipelines, and o<strong>the</strong>r structures. This is more damage than<br />
that typically caused by floods, hurricanes, tornadoes, and earthquakes combined. It is<br />
estimated that approximately 10 percent of <strong>the</strong> homes built on expansive soils experience<br />
significant damage. Because <strong>the</strong>re is limited available data on this hazard and no reported<br />
occurrences, <strong>the</strong> previous plan’s assessment remains valid and will be applicable for <strong>the</strong> 2013<br />
update.<br />
Location<br />
Expansive soils are a moderate risk that is largely uniform across <strong>the</strong> Region. Related hazard<br />
events are correlated with periods of drought in eastern Kansas. However, developed and<br />
developing communities in <strong>the</strong> Region in <strong>the</strong> areas of high clay content soils, which commonly<br />
experience fluctuations in <strong>the</strong> water table, are probably <strong>the</strong> most vulnerable to expansive soils.<br />
The distribution of clay soils is an indication of <strong>the</strong> extent of <strong>the</strong> vulnerability to this hazard in <strong>the</strong><br />
Region. Nearly <strong>the</strong> entire Region has clay containing soils with at least a slight potential for<br />
swelling and shrinking that could damage building <strong>found</strong>ations, roadways, and similar<br />
properties.<br />
Per <strong>the</strong> map below, Region L is located in an area w<strong>here</strong> part of <strong>the</strong> soil unit<br />
consists of clay having slight to moderate swelling potential. While more detail is<br />
not available, all jurisdictions within <strong>the</strong> Region are affected.<br />
3.80
Figure 3.16 Swelling Soils Map of Kansas<br />
MAP LEGEND<br />
Red Unit contains abundant clay having high swelling potential<br />
Blue Part of unit (generally less than 50%) consists of clay having high swelling potential<br />
Rust Unit contains abundant clay having slight to moderate swelling potential<br />
Green Part of unit (generally less than 50%) consists of clay having slight to moderate swelling potential<br />
Brown Unit contains little or no swelling clay<br />
Yellow Data insufficient to indicate clay content of unit and/or swelling potential of clay<br />
Source: U.S. Geological Survey publication, http://arcvoid.com/surevoid_web/soil_maps/ks.html<br />
Figure 3.17 depicts <strong>the</strong> general soil content of Leavenworth and Wyandotte Counties in Region<br />
L, which contribute to expansive soils.<br />
3.81
Figure: 3.17. General Soil Content: Leavenworth and Wyandotte Counties<br />
Previous Occurrences<br />
Extent/Impact<br />
3.82
Previous Occurrences<br />
Highways, airport runways, streets, walkways and parking lots with layers of concrete and<br />
asphalt throughout <strong>the</strong> State are damaged every year by <strong>the</strong> effects of expansive soils. The<br />
frequency of damage from expansive soils can be associated with <strong>the</strong> cycles of drought and<br />
heavy rainfall, which reflect changes in moisture content. Building settlements associated with<br />
drought have been noted in Kansas for many years, particularly in buildings located on high<br />
ground, fur<strong>the</strong>r from <strong>the</strong> water table.<br />
The 2011 - present drought has likely been <strong>the</strong> worst for home <strong>found</strong>ations since <strong>the</strong> late 1950s<br />
drought, stated a board member of <strong>the</strong> Basement Health Association, a Dayton, Ohio-based<br />
trade group for basement and <strong>found</strong>ation repair businesses. Homes from <strong>the</strong> Dakotas through<br />
Louisiana were faring <strong>the</strong> worst, but damage to <strong>found</strong>ations from drought has been reported in<br />
40 of <strong>the</strong> contiguous U.S. Experts estimate that drought damage to houses could reach $1<br />
billion or more. Source: U.S. News and World Report, Aug. 31, 2012<br />
Expansive soil events around Kansas City, Missouri are detailed below. No data is available for<br />
events in Region L.<br />
• 1985: Expansive Soil Event - movement in expansive shales caused damage to St.<br />
Teresa’s Academy, <strong>the</strong> 7th Church of Christ, <strong>the</strong> Kansas City Public Library Country Club<br />
Plaza Branch, and <strong>the</strong> University Center at <strong>the</strong> University of Missouri, all in Kansas City,<br />
Missouri.<br />
• 1950: Expansive Soil Event - Many homes and buildings in <strong>the</strong> Kansas City metropolitan<br />
area experienced minor damage as a result of <strong>the</strong> 1950s’ drought. Up to 65 percent of <strong>the</strong><br />
homes were damaged at an estimated cost of $30-$40 million.<br />
• 2012: According to a report on Fox4 KC.com, <strong>the</strong> metro area has seen extensive damage<br />
to <strong>found</strong>ations of homes and o<strong>the</strong>r structures. Down more than 17 inches of rain, as of<br />
December 0f 2012, <strong>found</strong>ation repair companies are reporting that <strong>the</strong>y have not been this<br />
busy in 34 years. The full extent of <strong>the</strong> issue will hit once <strong>the</strong> rains do begin again,<br />
expanding <strong>the</strong> soil that has shrunk and leaking into all <strong>the</strong> cracks brought on by <strong>the</strong> drought.<br />
Extent<br />
While Region L has a lower clay content overall than many counties in Kansas <strong>the</strong>y are still<br />
susceptible to expansive soil damage. The magnitude of expansive soils would be negligible for<br />
<strong>the</strong> planning area. Injuries could be treated with first aid, critical facilities would not be shut<br />
down for more than 24 hours, and less than 10% of property would be severely damaged.<br />
Probability of Future Hazard Events<br />
Based on <strong>the</strong> widespread distribution of soils and dry and wet cycles in Kansas, this hazard’s<br />
CPRI probability (for a damaging swelling soils event) is “Likely” within <strong>the</strong> next three years.<br />
3.83
Impact and Vulnerability<br />
While Region L has lower clay content overall than many counties in Kansas <strong>the</strong>y are still<br />
susceptible to expansive soil damage. A dollar amount for damages is difficult to ascertain or<br />
assign to this particular hazard since very little incident record keeping is done. Highways<br />
probably are most susceptible to damage from soil problems but those are usually resolved by<br />
using improved construction methods.<br />
The impact of expansive soils in <strong>the</strong> planning area is ultimately an area of concern for <strong>the</strong><br />
infrastructure such as roads, bridges, utilities. Any building impacts would be <strong>the</strong> concern of <strong>the</strong><br />
building owner whe<strong>the</strong>r insured or uninsured. Loss of life is not a concern unless <strong>the</strong> event is<br />
catastrophic to <strong>the</strong> point of collapsing bridges or buildings w<strong>here</strong> individuals are in close<br />
proximity. The impact of this hazard could be minimal to moderate, depending on <strong>the</strong> location.<br />
Since this hazard develops gradually, it seldom presents a threat to life. Houses and one-story<br />
commercial buildings are more apt to be damaged by <strong>the</strong> expansion of swelling clays than are<br />
multi-story buildings, which usually are heavy enough to counter swelling pressures.<br />
Summary<br />
Expansive soils is a common hazard in <strong>the</strong> planning area due to <strong>the</strong> clay content of <strong>the</strong> soil and<br />
<strong>the</strong> rise and fall of <strong>the</strong> moisture levels due to heavy rains and drought conditions. While <strong>the</strong><br />
hazard is common it does not severely affect <strong>the</strong> economy o<strong>the</strong>r than fixing damages done to<br />
roads and buildings. Because this damage is hit or miss it is not possible to have a loss<br />
estimate.<br />
Local Mitigation Concerns<br />
• The main issues confronting <strong>the</strong> Region are <strong>the</strong> transportation nodes in and around <strong>the</strong> tristate<br />
area. These traffic ways are heavily travelled and when damaged due to expansive<br />
soils <strong>the</strong>y become a threat to human life.<br />
• The structural integrity of <strong>the</strong> buildings in and around <strong>the</strong> area are tested during periods of<br />
expansive soil, caused by drought and heavy rains, which can create a safety issue.<br />
Reparation can be expensive for public buildings, and for private individuals.<br />
Development in Hazard Prone Areas<br />
The presence of clays with high swelling and shrinking potential are lower in <strong>the</strong> planning area<br />
than <strong>the</strong> rest of <strong>the</strong> state, however it does still exists. Development in this Region is increasing<br />
as <strong>the</strong> population base increases, however, damage from expansive soil to new construction is<br />
often mitigated with modern construction practices.<br />
Soil engineers and engineering geologists test soils for swell potential when designing a<br />
building's <strong>found</strong>ation. Simple observation often can reveal <strong>the</strong> presence of expansive soils and<br />
3.84
can make recommendations for septic systems, grading, earth support, drainage, <strong>found</strong>ation<br />
design, concrete slab on grade construction and site remediation.<br />
Johnson County<br />
Table 3.52. Johnson County CPRI – Expansive Soil<br />
Hazard Type Probability Magnitude<br />
Warning<br />
Time Duration CPRI<br />
Planning<br />
Significance<br />
Johnson County<br />
Expansive Soil 3 1 1 4 2.20 Moderate<br />
Leavenworth County<br />
Table 3.53. Leavenworth County CPRI – Expansive Soils<br />
Hazard Type Probability Magnitude<br />
Warning<br />
Time Duration CPRI<br />
Planning<br />
Significance<br />
Leavenworth County<br />
Expansive Soil 3 1 1 4 2.20 Moderate<br />
Wyandotte County<br />
Table 3.54. Wyandotte County CPRI: Expansive Soil<br />
Hazard Type Probability Magnitude<br />
Warning<br />
Time Duration CPRI<br />
Planning<br />
Significance<br />
Wyandotte County<br />
Expansive Soil 3 1 1 4 2.20 Moderate<br />
Consequence (Impact) Analysis<br />
Even though expansive soils cause enormous amounts of damage to buildings and<br />
infrastructure most people have never heard of <strong>the</strong>m. This is because <strong>the</strong>ir damage is done<br />
slowly and cannot be attributed to a specific event. The damage done by expansive soils is <strong>the</strong>n<br />
attributed to poor construction practices or a misconception that all buildings experience this<br />
type of damage as <strong>the</strong>y age.<br />
The information in Table 3.55 provides <strong>the</strong> Consequence Analysis of Potential for Detrimental<br />
Impacts of Hazards done for accreditation with <strong>the</strong> Emergency Management Accreditation<br />
Program (EMAP).<br />
3.85
Table 3.55. Consequence Analysis: Expansive Soils<br />
Subject Ranking Impacts/Expansive Soils<br />
Health and Safety of Persons in <strong>the</strong><br />
Area of <strong>the</strong> Incident Minimal Minimal impact.<br />
Responders Minimal Minimal impact.<br />
Minimal expectation for utilization of <strong>the</strong><br />
COOP unless facility structures have<br />
Continuity of Operations<br />
Property, Facilities, and<br />
Infrastructure<br />
Delivery of Services<br />
Environment<br />
Economic Conditions<br />
Public Confidence in Jurisdiction’s<br />
Governance<br />
Minimal<br />
Minimal to Moderate<br />
Minimal<br />
Moderate<br />
Minimal to Moderate<br />
Minimal<br />
extensive damage.<br />
Localized impact could be moderate as it<br />
relates to property, facilities, and<br />
infrastructure. Expansive soils could cause<br />
structural integrity to be lost, and<br />
roadways, railways, etc., to buckle.<br />
Delivery of services could be impacted if<br />
roadways, railways, and all o<strong>the</strong>r<br />
infrastructure is impacted (minimal).<br />
Expansive soils could cause moderate<br />
damage to <strong>the</strong> environment, particularly<br />
dams, levees, watersheds, etc.<br />
The impact to <strong>the</strong> economy is with <strong>the</strong><br />
rebuilding of <strong>the</strong> property, facility, and<br />
infrastructure issues that expansive soils<br />
cause. During years of drought and<br />
extreme rain events <strong>the</strong> damage could be<br />
moderate.<br />
Confidence will be dependent on<br />
development trends and mitigation efforts<br />
at reducing <strong>the</strong> effect of expansive soils on<br />
new construction and roadways (minimal).<br />
3.86
3.2.8 Extreme Temperatures<br />
Calculated Priority Risk Index<br />
2.50 Moderate<br />
Description<br />
Planning Significance<br />
Extreme temperature events, both hot and cold, can have severe impacts in Region L on human<br />
health and mortality, natural ecosystems, agriculture, and o<strong>the</strong>r economic sectors.<br />
Heat<br />
According to <strong>the</strong> Centers for Disease Control and Prevention, 3,981 people died in <strong>the</strong> United<br />
States from heat-related deaths during 1999 and 2005. Those at greatest risk for heat-related<br />
illness include older adults and young children. However, even young and healthy individuals<br />
are susceptible if <strong>the</strong>y participate in strenuous physical activities during hot wea<strong>the</strong>r. Also,<br />
during extreme heat events, infrastructure, energy sources in particular, can be stressed, and<br />
long-term extreme heat can stress water sources, particularly if occurring during a period of<br />
drought.<br />
The contiguous United States now has <strong>the</strong> summer of 2012 as its third hottest summer on<br />
record since recordkeeping began in 1895. According to NOAA’s National Climatic Data Center,<br />
<strong>the</strong> average temperature for <strong>the</strong> contiguous United States between June and August was over<br />
74 degrees F, which is more <strong>the</strong> 2 degrees above <strong>the</strong> twentieth-century average. Only <strong>the</strong><br />
summers of 2011 and 1936 have had higher summer temperatures.<br />
According to information provided by FEMA, extreme heat is defined as temperatures that hover<br />
10 degrees or more above <strong>the</strong> average high temperature for <strong>the</strong> region and last for several<br />
weeks. Ambient air temperature is one component of heat conditions, with relative humidity<br />
being <strong>the</strong> o<strong>the</strong>r. The relationship of <strong>the</strong>se factors creates what is known as <strong>the</strong> apparent<br />
temperature. The Heat Index chart shown in Figure 3.18 uses both of <strong>the</strong>se factors to produce a<br />
guide for <strong>the</strong> apparent temperature or relative intensity of heat conditions.<br />
3.87
Figure 3.18. Heat Index (HI) Chart<br />
Source: National Wea<strong>the</strong>r Service (NWS)<br />
Note: Exposure to direct sun can increase Heat Index values by as much as 15°F. The shaded zone above 105°F corresponds to<br />
a HI that may cause increasingly severe heat disorders with continued exposure and/or physical activity.<br />
The National Wea<strong>the</strong>r Service has a system in place to initiate alert procedures (advisories or<br />
warnings) when <strong>the</strong> Heat Index is expected to have a significant impact on public safety. The<br />
expected severity of <strong>the</strong> heat determines whe<strong>the</strong>r advisories or warnings are issued. A common<br />
guideline for issuing excessive heat alerts is when <strong>the</strong> maximum daytime Heat Index is<br />
expected to equal or exceed 105 degrees Fahrenheit (°F) and <strong>the</strong> night time minimum Heat<br />
Index is 80°F or above for two or more consecutive days.<br />
Warm summer days also encourages <strong>the</strong> growth of blue-green algae blooms in Kansas<br />
ecosystems. Blue-green algae are a normal part of <strong>the</strong> environmental when <strong>the</strong>y are present in<br />
low numbers. But in <strong>the</strong> summer heat, <strong>the</strong>se blooms grow very quickly to extreme numbers and<br />
produce chemical compounds which are toxic to warm-blooded creatures (people, pets and<br />
livestock),and some are toxic to o<strong>the</strong>r organisms like fish. The biggest risk to health comes from<br />
coming into contact with or ingesting <strong>the</strong> toxins produced by <strong>the</strong> algae while engaging in what is<br />
called “full body contact” (during swimming, skiing or jet skiing, for example), or from inhaling<br />
spray cast up from <strong>the</strong> water’s surface by recreational activities or by <strong>the</strong> wind. Blue-green algae<br />
can also cause dermatological symptoms with prolonged skin contact with water or wet clo<strong>the</strong>s.<br />
Children and pets are most at risk while engaging in recreation in <strong>the</strong> water because <strong>the</strong>y are<br />
more likely to accidently or intentionally swallow lake water. Pets can become ill after being<br />
exposed to spray, or even from eating dried algae along <strong>the</strong> shore or after licking algae from<br />
3.88
<strong>the</strong>ir fur. No antidote exists for any known algal toxin currently. This makes prevention <strong>the</strong> best<br />
option for protecting human and animal health during a bloom (source: Kansas Department of<br />
Health & Environment, http://www.kdheks.gov/algae-illness/index.htm).<br />
Cold<br />
Extreme cold can cause hypo<strong>the</strong>rmia (an extreme lowering of <strong>the</strong> body’s temperature), frostbite<br />
and death. Infants and <strong>the</strong> elderly are particularly at risk, but anyone can be affected. While<br />
<strong>the</strong>re are no specific data sources recording hypo<strong>the</strong>rmia (cold) death rates, it is estimated that<br />
25,000 older adults die from hypo<strong>the</strong>rmia each year. The National Institute on Aging estimates<br />
that more than 2.5 million Americans are especially vulnerable to hypo<strong>the</strong>rmia, with <strong>the</strong> isolated<br />
elderly being most at risk. About 10 percent of people over <strong>the</strong> age of 65 have some kind of<br />
temperature-regulating defect, and 3-4 percent of all hospital patients over 65 are hypo<strong>the</strong>rmic.<br />
Also at risk are those without shelters, who are stranded, or who live in a home that is poorly<br />
insulated or without heat. O<strong>the</strong>r impacts of extreme cold include asphyxiation (unconsciousness<br />
or death from a lack of oxygen) from toxic fumes from emergency heaters; household fires,<br />
which can be caused by fireplaces and emergency heaters; and frozen/burst water pipes.<br />
Wind can greatly amplify <strong>the</strong> impact of cold ambient air temperatures. Provided by <strong>the</strong> National<br />
Wea<strong>the</strong>r Service, Figure 3.19 below shows <strong>the</strong> relationship of wind speed to apparent<br />
temperature and typical time periods for <strong>the</strong> onset of frostbite. The combination of <strong>the</strong>se<br />
elements affects <strong>the</strong> wind chill factor. The wind chill factor is <strong>the</strong> perceived temperature. As <strong>the</strong><br />
speed of wind increases, <strong>the</strong> skin temperature drops as <strong>the</strong> heat is carried away from <strong>the</strong> body.<br />
As <strong>the</strong> perceived temperature increases, <strong>the</strong> risk of frostbite and hypo<strong>the</strong>rmia increases.<br />
Figure 3.19. Wind Chill Chart<br />
3.89
Location<br />
All of Region L is susceptible to extreme temperatures. The heat risk to humans is generally<br />
uniform across <strong>the</strong> State of Kansas, but is slightly higher in <strong>the</strong> eastern portion that Region L<br />
resides in because of a relatively higher heat index. Extreme cold is a factor throughout <strong>the</strong><br />
Region also, with all jurisdictions susceptible.<br />
Previous Occurrences<br />
For extreme heat, <strong>the</strong> Kansas Department of Health and Environment’s Kansas Environmental<br />
Public Health Tracking Program has kept records of <strong>the</strong> fatalities of Kansas residents since<br />
2000. T<strong>here</strong> have been at least 144 fatalities of Kansas residents since 2000 due to heat. The<br />
year of 2011 had <strong>the</strong> most recorded fatalities with 37.<br />
Recorded temperatures in Kansas have ranged from –40 degrees °F (Lebanon, February 1905)<br />
to 121 degrees °F (Alton, July 1934). Also, <strong>the</strong> average number of days with temperatures over<br />
90 degrees has been recorded from 1981 to 2010 as reflected in Figure 3.20. This map shows<br />
that over 2/3 rd of <strong>the</strong> State had over a month of high temperatures over 90 degrees and <strong>the</strong><br />
southwestern counties that border Oklahoma, average two months of temperatures over 90<br />
degrees. This map does not depict <strong>the</strong> overnight minimum temperature averages. If <strong>the</strong><br />
temperature does not drop overnight, it is more important in a global sense than <strong>the</strong> record<br />
highs. People, mainly those without air conditioning and crops need <strong>the</strong> temperature to drop<br />
during <strong>the</strong> overnight so that <strong>the</strong>y can sustain <strong>the</strong> heat during <strong>the</strong> next day. The following figure<br />
shows <strong>the</strong> average number of days with high temperatures over 90 from 1981 to 2010.<br />
Figure 3.20. Average Number of Days with High Temperatures Over 90, 1981 – 2012<br />
Source: Kansas State Research and Extension, Climatic Maps of Kansas, http://www.ksre.ksu.edu/wdl/ClimaticMaps.htm , date<br />
October 2012.<br />
Region L falls in <strong>the</strong> 0 – 22 days over 90 degree category.<br />
3.90
Notable Extreme Temperature Events for Region L<br />
• Summer 2012: A large high pressure area settled over <strong>the</strong> Central High Plains resulting in<br />
high temperature records being tied or broken in Goodland, Hill City and o<strong>the</strong>r Kansas<br />
towns. In Topeka, <strong>the</strong> year of 2012 was ranked as <strong>the</strong> hottest on record. The average<br />
temperature from June through August was <strong>the</strong> 9 th warmest on record and just a degree<br />
cooler than 2011. High temperatures averaged to be <strong>the</strong> 3 rd warmest on record, trailing <strong>the</strong><br />
Dust Bowl years of 1936 and 1934. Topeka had 24 days w<strong>here</strong> <strong>the</strong> temperature was at least<br />
100 degrees, which ties for <strong>the</strong> 6 th most of any summer. The summer of 2012 was also <strong>the</strong><br />
3 rd hottest summer on record for <strong>the</strong> contiguous U.S. since recordkeeping began in 1895.<br />
Only behind <strong>the</strong> summers of 2011 and 1936 have higher summer temperatures (source:<br />
National Wea<strong>the</strong>r Service, Goodland, KS<br />
http://www.crh.noaa.gov/news/display_cmsarchive.php?wfo=gld and Topeka, KS<br />
http://www.crh.noaa.gov/news/display_cmsarchive.php?wfo=top ).<br />
• June 2009—The Kansas City, Kan. Fire Department responded to a number of heat related<br />
calls. The Fire Department was dispatched to <strong>the</strong> Wyandotte County Courthouse on a case<br />
ofheat exposure and <strong>the</strong> Unified Government's Fleet Center at 50th and State on a case of<br />
possible heat stroke. Officials also determined high temperatures may have been <strong>the</strong> cause<br />
of death for two elderly people in <strong>the</strong> 2500 block of Stewart Avenue (Kansas City Kansan,<br />
June 23, 2009).<br />
• August 1, 2006—Oppressive heat and humidity continued from July...with heat indices in<br />
<strong>the</strong> 105 to 115 degree range through August 2nd.<br />
• July 29, 2006--Oppressive heat and humidity drove heat indices into <strong>the</strong> 105 to 115 degree<br />
range, from July 29th through July 31st.<br />
• July 15, 2006--Oppressive heat and humidity drove afternoon and early evening heat<br />
indices into <strong>the</strong> 105 to 115 degree range, from July 16th through July 20th.<br />
• July 21, 2005--Oppressive heat and humidity was observed across <strong>the</strong> area from July 21st<br />
to July 25th. Afternoon heat indices ranged from 105 to 110 degrees. A 78 year old female<br />
from Bonner Springs in Wyandotte county died from heat related causes on July 23rd.<br />
• August 24, 2003--High temperatures and humidity caused heat indices to reach <strong>the</strong> 105<br />
degree range<br />
• August 17, 2003--High temperatures and humidity caused heat indices to reach <strong>the</strong> 105 to<br />
110 degree range.<br />
• July 26, 2003--Afternoon heat indices ranged from 103 to 106 degrees, from July 26th<br />
through July 27th.<br />
• July 14, 2003--Oppressive heat and humidity over extreme eastern Kansas from July 14th<br />
through July 18th. Heat indices reached 110 degrees<br />
• August 9, 2001--Excessive heat and humidity again was observed over eastern Kansas on<br />
August 9th. Afternoon heat indices ranged from 105 to 110 degrees.<br />
• August 1-5, 2001--Excessive heat and humidity dominated <strong>the</strong> wea<strong>the</strong>r across eastern<br />
Kansas. August 1st through August 5th. Afternoon heat indices ranged from 105 to 113<br />
degrees.<br />
• July 17-24, 2001--Excessive heat with afternoon heat indices 105 to 110<br />
degrees...dominated <strong>the</strong> wea<strong>the</strong>r across eastern Kansas from July 17th to July 24th.<br />
• December 10-31, 2000--Arctic air gripped nor<strong>the</strong>ast Kansas for <strong>the</strong> final 3 weeks of<br />
December. Except for a few hours on <strong>the</strong> 15th and 16th, temperatures remained below<br />
3.91
freezing for <strong>the</strong> entire period. Daily temperatures were 10 to 20 degrees below normal<br />
through <strong>the</strong> period. Average highs were in <strong>the</strong> teens and twenties with average lows in <strong>the</strong><br />
single digits. Ola<strong>the</strong> dropped to 10 below zero on <strong>the</strong> 22nd. Snow cover persisted across <strong>the</strong><br />
area from <strong>the</strong> 13th through <strong>the</strong> end of <strong>the</strong> month. Numerous water pipes and water mains<br />
were broken, especially in <strong>the</strong> Kansas City area.<br />
• October 6-10, 2000--Unusually strong Arctic high pressure built southward into <strong>the</strong> central<br />
Plains in early October, bringing 4 days of record breaking cold to nor<strong>the</strong>ast Kansas. High<br />
temperatures did not break <strong>the</strong> 50 degree mark on October 6th through 8th, and low<br />
temperatures dropped into <strong>the</strong> 20s each day from <strong>the</strong> 7th through <strong>the</strong> 9th. After starting <strong>the</strong><br />
day near freezing on October 10, temperatures finally rebounded into <strong>the</strong> 60s that afternoon.<br />
• August 2000: This August will be remembered as one of <strong>the</strong> hotter Augusts on record for<br />
north-central and nor<strong>the</strong>astern Kansas. The last half of <strong>the</strong> month was especially hot with<br />
nearly all of <strong>the</strong> monthly highest temperatures reached during this time period. At least 14<br />
people were treated for heat-related illnesses.<br />
• July 1999: Excessive heat occurred over north-central and nor<strong>the</strong>astern Kansas throughout<br />
<strong>the</strong> month, but during a two-week period at <strong>the</strong> end of <strong>the</strong> month, temperatures exceeded<br />
100 °F in many areas on many days. Two deaths were attributed to <strong>the</strong> heat.<br />
• February 1996: Record setting to near record setting cold covered nor<strong>the</strong>ast and northcentral<br />
Kansas from <strong>the</strong> 1st through <strong>the</strong> 4th. Daytime highs in some areas failed to reach<br />
zero. These readings were quite extreme and rare for <strong>the</strong> local area w<strong>here</strong> little if any snow<br />
was on <strong>the</strong> ground during <strong>the</strong> coldest time. Low temperatures plunged to between 10 below<br />
and 20 below zero with wind chills of 40 below to 60 below zero. These extreme readings<br />
caused water pipes to burst, water meters to freeze, inoperative vehicles, overworked<br />
heating systems and a host of o<strong>the</strong>r problems associated with prolonged extreme cold. Most<br />
schools, especially rural areas, cancelled classes while many businesses and activities were<br />
curtailed or cancelled.<br />
• September 1995: The earliest freeze on record hit most of north-central and nor<strong>the</strong>ast<br />
Kansas causing widespread and heavy damage to immature crops. Damage likely<br />
exceeded $25 million.<br />
Extent<br />
The magnitude of extreme temperatures in <strong>the</strong> Planning area is limited. Injuries and illnesses<br />
do not normally result in permanent disability and complete shutdown of critical facilities for<br />
more than one week. Property is not expected to be affected.<br />
According <strong>the</strong> National Climatic Data Center, out of <strong>the</strong> past 12 years (2000 – 2012), Region L<br />
experienced <strong>the</strong> following extreme temperatures:<br />
Johnson County: 3 events of excessive heat were reported; one in 2007 and two in 2012. 2<br />
events of extreme cold were reported, both of <strong>the</strong>m in 2000.<br />
Leavenworth County: 3 events of excessive heat were reported; one in 2007 and two in 2012.<br />
2 events of extreme cold were reported; both in <strong>the</strong> year 2000.<br />
Wyandotte County: 3 events of excessive heat were reported; one in 2007, and two in 2012. 2<br />
events of extreme cold were reported, both in 2000.<br />
3.92
Probability of Future Occurrences<br />
This hazards CPRI probability is ‘Likely’ within a 3 year time period, and could very well get<br />
worse. The EPA has projected that with climate changes in <strong>the</strong> plain states, temperatures will<br />
continue to increase and affect all of Kansas to include Region L. A repercussion of this is that<br />
people will tend to stay in air conditioned environments to stay cool, or heated environments to<br />
stay warm, thus outdoor recreational activities will decline. Ano<strong>the</strong>r concern is as people move<br />
to urban areas, older residents in rural areas may be particularly susceptible to <strong>the</strong> extreme<br />
temperatures as <strong>the</strong>y are isolated from younger family members to assist <strong>the</strong>m in times of need.<br />
Region L is particularly vulnerable due to <strong>the</strong> heat indices that it experiences during <strong>the</strong> warmer<br />
wea<strong>the</strong>r.<br />
Impact and Vulnerability<br />
Specific groups of <strong>the</strong> population such as people aged 65 and older, infants and children,<br />
people with chronic medical conditions, low income, outdoor workers and athletes are more at<br />
risk because of <strong>the</strong> heightened vulnerability of this segment of <strong>the</strong> population. Two specific<br />
segments have been looked at closely which are <strong>the</strong> people aged 65 and older and children<br />
under <strong>the</strong> age of 5 that may be more at risk. The greatest population of under age 5 resides in<br />
<strong>the</strong> counties of Johnson, Sedgwick and Wyandotte in Kansas. According to <strong>the</strong> Kansas<br />
Department of Health and Environment, from 2000 to 2011, Region L experience 21 fatalities<br />
with extreme heat as <strong>the</strong> underlying cause of death. Seventeen of those decedents were male.<br />
The youngest was 11 months old, and <strong>the</strong> oldest was 95 years old. The average age of <strong>the</strong><br />
decedents were 50.8 years old. The year with <strong>the</strong> highest number of deaths was 2011 which<br />
had 5.<br />
From 2000 – 2011, in Wyandotte, Johnson, and Leavenworth counties, <strong>the</strong>re were 12 deaths<br />
with exposure to natural cold as <strong>the</strong> underlying cause. Eight of those decedents were female.<br />
The youngest was 23 years old and <strong>the</strong> oldest was 90 years old. The average age of <strong>the</strong><br />
decedents was 66.17 years old. The year with <strong>the</strong> highest number of deaths was 2010 with<br />
four.<br />
Extreme cold often accompanies a winter storm or is left in its wake. Prolonged exposure to <strong>the</strong><br />
cold can cause frostbite or hypo<strong>the</strong>rmia and become life-threatening. Infants and elderly people<br />
are most susceptible. Freezing temperatures can cause severe damage to crops and o<strong>the</strong>r<br />
critical vegetation. Pipes may freeze and burst in homes or businesses that are poorly insulated<br />
or without heat. Structure fires occur more frequently in <strong>the</strong> winter due to lack of proper safety<br />
precautions and present a greater danger because water supplies may freeze, and impede<br />
firefighting efforts. People die of hypo<strong>the</strong>rmia from prolonged exposure to <strong>the</strong> cold. Indigent and<br />
elderly people are most vulnerable to winter storms and account for <strong>the</strong> largest percentage of<br />
hypo<strong>the</strong>rmia victims largely due to improperly or unheated homes. The leading cause of death<br />
during winter storms is from automobile or o<strong>the</strong>r transportation accidents.<br />
According to <strong>the</strong> USDA Risk Management Agency’s insured crop losses as a result of heat and<br />
hot wind conditions and freeze and frost conditions during <strong>the</strong> ten-year period of 2002 – 2011,<br />
3.93
Region L has experienced an average loss of $207,324.70 in crop losses. Table 3.56 shows<br />
<strong>the</strong> total insured crop insurance paid per county from 2002-2011 for Region L.<br />
Table 3.56. Total Insured Crop Insurance Paid from 2002 – 2011 for Region L<br />
County Total Insured Crop Insurance Paid for Annualized Insured<br />
Extreme Temperature Damages<br />
Crop Insurance Paid<br />
For Extreme<br />
Temperature Damages<br />
Mitigation Planning Region I<br />
Johnson $1,410,575 $141,058<br />
Leavenworth $474,195 $47,420<br />
Wyandotte $0 $0<br />
Subtotal $1,884,770 $188,477<br />
Source: USDA Risk Management Agency<br />
This hazard can become more serious when combined with a utility/infrastructure failure or<br />
winter storm hazard. Sometimes this hazard contributes to <strong>the</strong> infrastructure failure, such as<br />
overloading of <strong>the</strong> power grid during hot summer months. Severe temperatures could impact <strong>the</strong><br />
agriculture industry statewide.<br />
Historically <strong>the</strong> highest temperatures in Region L occur in June, July, August, and September of<br />
every summer. T<strong>here</strong>fore, <strong>the</strong> majority of direct and indirect exposure to excessive heat that<br />
has caused fatalities also occurs during <strong>the</strong>se months.<br />
T<strong>here</strong> is greater elderly population risk in <strong>the</strong> urban counties of Johnson, Sedgwick and<br />
Shawnee, but overall <strong>the</strong> State of Kansas has a higher than average elderly population. The two<br />
ages <strong>the</strong> most vulnerable to temperature extremes are individuals 65 years and over, and<br />
individuals under 5 years of age. The following table reflects <strong>the</strong> percentages of <strong>the</strong>se two age<br />
groups by jurisdiction within <strong>the</strong> Region. Townships were not included due to <strong>the</strong> sampling error<br />
size which was not deemed a true reflection of <strong>the</strong> data required. The following table shows <strong>the</strong><br />
combined vulnerability for <strong>the</strong> participating jurisdictions within <strong>the</strong> region according to <strong>the</strong><br />
Census Bureau:.<br />
Table 3.57. Region L Vulnerable Population to Extreme Temperatures<br />
Jurisdiction 65 Years and Over<br />
(%)<br />
Less than 5 years<br />
(%)<br />
Total Vulnerable<br />
Population<br />
(%)<br />
Johnson County<br />
Desoto 9 6.6 15.6<br />
Edgerton 5.2 7.6 12.8<br />
Fairway 16.7 7.3 24.0<br />
Gardner 5.3 11.5 16.8<br />
Lake Quivira 24.7 2.2 26.9<br />
Leawood 15.3 5.5 20.8<br />
Lenexa 10.3 7.1 17.4<br />
Merriam 13.9 6.4 20.3<br />
Mission 13.4 5.6 19.0<br />
Mission Hills 16.5 3.1 19.6<br />
Mission Woods 24.2 9.6 33.8<br />
Ola<strong>the</strong> 7.2 8.9 16.1<br />
Overland Park 12.3 6.4 18.7<br />
Prairie Village 17.9 6.2 24.1<br />
3.94
Roeland 11.1 7.0 18.1<br />
Leavenworth County<br />
Leavenworth,<br />
10 8.1 18.1<br />
City of<br />
Lansing 8.3 5.4 13.7<br />
Tonganoxie 11.8 8.8 20.6<br />
Basehor 11.7 6.2 17.9<br />
Linwood 12.3 7.2 19.5<br />
Easton 22.3 6.4 28.7<br />
Wyandotte County<br />
Bonner Springs 11.8 7.0 18.8<br />
Edwardsville 13.9 8.0 21.9<br />
Lake Quivira (pt) 0 0 0<br />
Kansas City, Ks 10.5 8.8 19.3<br />
Source: U.S. Census Bureau<br />
As a comparison, <strong>the</strong> Census Bureau reflects <strong>the</strong> State of Kansas as follows:<br />
Under 5 years: 7.1% 65 years and older: 13.1%<br />
Summary<br />
Region L is vulnerable to extreme temperatures of hot and cold, specifically <strong>the</strong> population over<br />
<strong>the</strong> age of 65 and under 5 years of age. Johnson, Wyandotte, and Leavenworth Counties<br />
counter attack <strong>the</strong>se temperature extremes by providing warming and cooling shelters for<br />
individuals in need. Crop damage is susceptible to extreme temperatures which cause a loss of<br />
revenue that reverberates throughout <strong>the</strong> economy. In a ten year period from 2002 – 2011, <strong>the</strong><br />
total crop insurance paid was $1,884,770.<br />
Local Mitigation Concerns<br />
• Extreme temperatures affect <strong>the</strong> population of <strong>the</strong> whole Region, with <strong>the</strong> under 5 and<br />
over 65 age groups being <strong>the</strong> most susceptible. However, all ages can succumb to<br />
extreme temperatures. Protecting <strong>the</strong> vulnerable populations is a priority with various<br />
programs in place to ensure <strong>the</strong>y are not overlooked or forgotten. Leavenworth County<br />
opens warming and cooling centers at <strong>the</strong> Community Center and relies on <strong>the</strong> Red<br />
Cross to assist in locating o<strong>the</strong>r centers when <strong>the</strong> need arises.<br />
• Ano<strong>the</strong>r mitigation concern with extreme heat is wildfires. When <strong>the</strong> region has periods<br />
of drought, coupled with extreme heat, <strong>the</strong> incidence of wildfires can increase as <strong>the</strong><br />
fauna, grass, and crops dry out <strong>the</strong>y become a tinder box that is more susceptible to<br />
igniting<br />
Development in Hazard Prone Areas<br />
Extreme heat and cold affect people and livestock more than property. This hazard is not<br />
expected to cause concern in developing trends within <strong>the</strong> Region.<br />
3.95
Johnson County<br />
Table 3.58. Johnson County CPRI: Extreme Temperatures<br />
Hazard Type Probability Magnitude<br />
Warning<br />
Time Duration CPRI<br />
Planning<br />
Significance<br />
Johnson County<br />
Extreme Temperatures 3 2 1 4 2.50 Moderate<br />
Leavenworth County<br />
Table 3.59. Leavenworth County CPRI: Extreme Temperatures<br />
Hazard Type Probability Magnitude<br />
Warning<br />
Time Duration CPRI<br />
Planning<br />
Significance<br />
Leavenworth County<br />
Extreme Temperatures 3 2 1 3 2.40 Moderate<br />
Wyandotte County<br />
Table 3.60. Wyandotte County CPRI: Extreme Temperatures<br />
Hazard Type Probability Magnitude<br />
Warning<br />
Time Duration CPRI<br />
Planning<br />
Significance<br />
Wyandotte County<br />
Extreme Temperatures 3 2 1 3 2.40 Moderate<br />
Consequence (Impact) Analysis<br />
Extremes of heat and cold environmental conditions can be detrimental to <strong>the</strong> health and<br />
comfort as human bodies attempt to maintain a core temperature of about 98.6 degrees F.<br />
Extreme heat is <strong>the</strong> number one wea<strong>the</strong>r-related killer in <strong>the</strong> U.S. resulting in hundreds of<br />
fatalities each year. In fact, on average, extreme heat claims more lives each year than floods,<br />
lightning, tornadoes and hurricanes combined.<br />
The hazard of extreme heat is when <strong>the</strong> body heats too quickly to cool itself safely, or when too<br />
much fluid or salt is lost through dehydration or sweating, body temperature rises and heatrelated<br />
illness may develop.<br />
The severity of heat disorders tends to increase with age. Conditions that cause heat cramps in<br />
a 17-year-old may result in heat exhaustion in someone 40 years old and in heat stroke in a<br />
person over 60.<br />
Table 3.61 provides <strong>the</strong> Consequence Analysis of Potential for Detrimental Impacts of Hazards<br />
for EMAP purposes.<br />
3.96
Table 3.61. Consequence Analysis: Extreme Temperatures<br />
Subject Ranking Impacts/Extreme Temperatures<br />
Health and Safety of Persons in <strong>the</strong><br />
Area of <strong>the</strong> Incident<br />
Minimal - Severe<br />
Depending on <strong>the</strong> duration of <strong>the</strong> event,<br />
Impact in <strong>the</strong> incidence area is expected<br />
to be severe for unprepared and<br />
unprotected persons. Impact will be<br />
minimal to moderate for prepared and<br />
protected persons.<br />
Responders<br />
Minimal to Severe<br />
Impact could be severe if proper<br />
precautions are not taken, i.e. hydration in<br />
heat, clothing in extreme cold. With<br />
proper preparedness and protection <strong>the</strong><br />
impact would be minimal.<br />
Minimal expectation for utilization of <strong>the</strong><br />
Continuity of Operations<br />
Property, Facilities, and<br />
Infrastructure<br />
Delivery of Services<br />
Environment<br />
Economic Conditions<br />
Public Confidence in Jurisdiction’s<br />
Governance<br />
Minimal<br />
Minimal to Sever<br />
Minimal<br />
Severe<br />
Minimal to Severe<br />
Minimal to Moderate<br />
COOP.<br />
Impact to infrastructure could be minimal<br />
to severe depending on <strong>the</strong> temperature<br />
extremes.<br />
Impact on <strong>the</strong> delivery of services should<br />
be non-existent to minimal.<br />
The impact to <strong>the</strong> environment could be<br />
severe. Extreme heat and extreme cold<br />
have <strong>the</strong> potential to seriously damage<br />
wildlife and plants, trees, crops, etc.<br />
Impacts to <strong>the</strong> economy will be dependent<br />
on how extreme <strong>the</strong> temperatures get, but<br />
only in <strong>the</strong> sense of whe<strong>the</strong>r people will<br />
venture out to spend money. Utility bills<br />
could shoot up causing more financial<br />
hardship and could put a strain on<br />
infrastructure and crops (minimal to<br />
severe).<br />
Confidence will be dependent on how well<br />
utilities hold up as <strong>the</strong>y are stretched to<br />
provide heat and cool air, depending on<br />
<strong>the</strong> extreme. Planning and response<br />
could be challenged (minimal to<br />
moderate).<br />
3.97
3.2.9 Flood<br />
Calculated Priority Risk Index<br />
Description<br />
Planning Significance<br />
3.55 High<br />
The two types of flooding that affect Region L are flash flooding and riverine flooding, which will<br />
be <strong>the</strong> focus of this section.<br />
Flash Flooding<br />
A flash flood is an event that occurs with little or no warning w<strong>here</strong> water levels rise at an<br />
extremely fast rate. Flash flooding results from intense rainfall over a brief period, and can be<br />
associated with rapid snowmelt, ice jam release, frozen ground, saturated soil or impermeable<br />
surfaces<br />
Flash Flood is caused by excess water usually from a storm. Flash floods occur whenever<br />
water enters into an area faster than it can be absorbed or drained. With no place to go, <strong>the</strong><br />
water will find <strong>the</strong> lowest elevations–areas that are often not in a floodplain. This type of<br />
flooding, often referred to as sheet flooding, is becoming increasingly prevalent as development<br />
outstrips <strong>the</strong> ability of <strong>the</strong> drainage infrastructure to properly carry and disperse <strong>the</strong> water flow.<br />
Flash flooding is an extremely dangerous form of flooding which can reach full peak in only a<br />
few minutes and allows little or no time for protective measures to be taken by those in its path.<br />
Flash flood waters move at very fast speeds and can move boulders, tear out trees, scour<br />
channels, destroy buildings, and obliterate bridges. Flash flooding often results in higher loss of<br />
life, both human and animal, than slower developing river and stream flooding.<br />
In certain areas, aging storm sewer systems are not designed to carry <strong>the</strong> capacity currently<br />
needed to handle <strong>the</strong> increased storm runoff. Typically, <strong>the</strong> result is water backing into<br />
basements, which damages mechanical systems and can create serious public health and<br />
safety concerns. This combined with rainfall trends and rainfall extremes all demonstrate <strong>the</strong><br />
high probability, yet generally unpredictable nature of flash flooding in <strong>the</strong> planning area.<br />
Flash floods are unpredictable, however, <strong>the</strong>re are factors that can point to <strong>the</strong> likelihood of<br />
flash floods occurring. Wea<strong>the</strong>r surveillance radar is being used to improve monitoring<br />
capabilities of intense rainfall. This, along with knowledge of <strong>the</strong> watershed characteristics,<br />
modeling techniques, monitoring, and advanced warning systems increases <strong>the</strong> warning time<br />
for flash floods.<br />
Flash flooding occurs in those locations of <strong>the</strong> planning area that are low-lying and/or do not<br />
have adequate drainage to carry away <strong>the</strong> amount of water that falls during intense rainfall<br />
events. Precipitation in <strong>the</strong> planning area, between 1971 and 2000, averaged 37.14 inches to<br />
42.30 inches. The very tip of <strong>the</strong> Nor<strong>the</strong>astern portion of Johnson County, and <strong>the</strong> eastern 1/3<br />
of Wyandotte County averaged 42 – 47 inches. Figure 3.21 shows <strong>the</strong> planning area as having<br />
greater precipitation amounts <strong>the</strong>n <strong>the</strong> majority of <strong>the</strong> state.<br />
3.98
Figure 3.21 Annual Precipitation Norms, 1971 – 2000.<br />
Riverine Flooding<br />
Riverine flooding is defined as <strong>the</strong> overflow of rivers, streams, drains, and lakes due to<br />
excessive rainfall, rapid snowmelt or ice melt. The areas adjacent to rivers and stream banks<br />
that carry excess floodwater during rapid runoff are called floodplains. A floodplain is defined as<br />
<strong>the</strong> lowland and relatively flat area adjoining a river or stream. The terms “special flood hazard<br />
area” and “100-year flood” refer to <strong>the</strong> area in <strong>the</strong> floodplain that is subject to a one percent or<br />
greater chance of flooding in any given year. Floodplains are a larger entity called a basin,<br />
which is defined as all <strong>the</strong> land drained by a river and its branches.<br />
Location<br />
All of Region L is susceptible to flash flooding and riverine flooding. The surface waters of <strong>the</strong><br />
planning area flow through 2 water basins: The Kansas Lower Republican and <strong>the</strong> Marais des<br />
Cygnes as shown in Figure 3.22 shows <strong>the</strong> Marais des Cygnes and Figure 3.23 shows <strong>the</strong><br />
Kansas Lower Republican.<br />
3.99
Figure 3.22. Marais des Cygnes Basin<br />
3.100
Figure 3.23. Kansas-Lower Republican Basin<br />
Previous Occurrences<br />
Major floods impacted Kansas in 1844, 1903, 1935, 1951, 1965, 1973, 1976, 1981, 1986, 1993,<br />
1998, 2001, 2007, 2009, and most recently in 2011. Region L has been included in 16 of <strong>the</strong><br />
past 34 Presidential Disaster Declarations that included flooding. Table 3.62 lists Disaster<br />
Declarations for flooding which included <strong>the</strong> counties that make up Region L. Summary tables of<br />
flood events in each county and excerpts of narratives describing some of those events follow.<br />
3.101
Table 3.62. Disaster Declarations for Flooding that Have Included Region L<br />
Declaration Declaration<br />
Number Date*<br />
Presidential Declarations<br />
4035 09/23/2011<br />
(6/1-<br />
8/1/2011)<br />
1699 5/6/2007<br />
(5/4/2007)<br />
1615 11/21/2005<br />
(10/1-<br />
2/2005)<br />
1579 2/8/2005<br />
(1/4-6/2005)<br />
1562 09/30/2004<br />
(8/27-<br />
30/2004)<br />
1535 8/3/2004<br />
(6/12-<br />
7/25/2004)<br />
1462 5/6/2003<br />
(5/4-<br />
30/2003)<br />
1258 11/5/1998<br />
(10/30-<br />
11/15/1998)<br />
Disaster<br />
Description<br />
Counties Involved<br />
Disaster Cost<br />
Flooding Atchison, Doniphan, Leavenworth and Wyandotte $7,462,881<br />
Severe<br />
Storms,<br />
Tornadoes,<br />
and<br />
Flooding<br />
Severe<br />
Storms and<br />
Flooding<br />
Severe<br />
Winter<br />
Storm,<br />
Heavy<br />
Rains, and<br />
Flooding<br />
Severe<br />
Storms,<br />
Flooding,<br />
and<br />
Tornadoes<br />
Severe<br />
Storms,<br />
Flooding,<br />
and<br />
Tornadoes<br />
Severe<br />
Storms,<br />
Tornadoes,<br />
and<br />
Flooding<br />
Severe<br />
Storms and<br />
Flooding<br />
Barton, Brown, Chase, Cherokee, Clay, Cloud,<br />
Comanche, Cowley, Dickinson, Doniphan, Douglas,<br />
Edwards, Ellsworth, Harper, Harvey, Jackson,<br />
Kingman, Kiowa, Leavenworth, Lincoln, Lyon,<br />
Marshall, McPherson, Morris, Nemaha, Osage,<br />
Osborne, Ottawa, Pawnee, Phillips, Pottawatomie,<br />
Pratt, Reno, Rice, Riley, Saline, Shawnee, Smith,<br />
Stafford, Sumner, Wabaunsee, Washington<br />
Atchison, Jackson, Jefferson, Leavenworth,<br />
Shawnee<br />
$117,565,269<br />
$10,286,064<br />
Anderson, Atchison, Barber, Brown, Butler, Chase, $106,873,672<br />
Chautauqua, Clark, Coffey, Comanche, Cowley,<br />
Crawford, Douglas, Elk, Franklin, Greenwood,<br />
Harper, Harvey, Jackson, Jefferson, Kingman,<br />
Kiowa, Leavenworth, Lyon, Marion, McPherson,<br />
Morris, Osage, Pratt, Reno, Rice, Sedgwick,<br />
Shawnee, Sumner, Wabaunsee, Woodson,<br />
Wyandotte<br />
Douglas, Wyandotte $2,103,376<br />
Barton, Butler, Cherokee, Decatur, Ellis, Geary,<br />
Graham, Jewell, Labette, Lyon, Marion, Mitchell,<br />
Morris, Ness, Osborne, Pawnee, Phillips, Rooks,<br />
Rush, Russell, Shawnee, Sheridan, Smith, Thomas,<br />
Trego, Wabaunsee, Wallace, Woodson, Wyandotte<br />
Allen, Anderson, Cherokee, Crawford, Douglas,<br />
Haskell, Labette, Leavenworth, Meade, Miami,<br />
Neosho, Osage, Seward, Woodson, Wyandotte<br />
Butler, Chase, Coffey, Cowley, Douglas, Franklin,<br />
Greenwood, Harper, Harvey, Johnson, Leavenworth,<br />
Lyon, Marion, Neosho, Saline, Sedgwick, Sumner,<br />
Wilson, Woodson, Wyandotte<br />
$12,845,892<br />
$988,056<br />
1254 10/14/1998<br />
(10/1-<br />
10/8/1998)<br />
Severe<br />
Storms,<br />
Flooding,<br />
and<br />
Tornadoes<br />
Bourbon, Cherokee, Douglas, Franklin, Jackson,<br />
Jefferson, Johnson, Leavenworth, Linn, Seward,<br />
Wabaunsee, Wyandotte<br />
1000 7/22/1993<br />
(6/28-<br />
10/5/1993)<br />
Flooding,<br />
Severe<br />
Storms<br />
Atchison, Barton, Brown, Chase, Cherokee, Clay,<br />
Cloud, Crawford, Dickinson, Doniphan, Douglas,<br />
Edwards, Ellis, Ellsworth, Geary, Graham, Harvey,<br />
Hodgeman, Jackson, Jefferson, Jewell, Johnson,<br />
Lane, Leavenworth, Lincoln, Lyon, Marion, Marshall,<br />
McPherson, Mitchell, Morris, Nemaha, Ness, Osage,<br />
Osborne, Ottawa, Pawnee, Pottawatomie, Reno,<br />
Republic, Rice, Riley, Rooks, Rush, Russell, Saline,<br />
Sedgwick, Shawnee, Sheridan, Smith, Stafford,<br />
$99,790,368<br />
3.102
663 6/28/1982 Severe<br />
Storms,<br />
Flooding<br />
539 9/20/1977 Severe<br />
Storms,<br />
Flooding<br />
403 9/28/1973 Severe<br />
Storms,<br />
Tornadoes,<br />
Flooding<br />
Sumner, Thomas, Trego, Wabaunsee, Washington,<br />
Wyandotte<br />
Jackson, Shawnee $804,048<br />
Atchison, Brown, Doniphan, Jackson, Jefferson,<br />
Johnson, Leavenworth, Nemaha, Shawnee,<br />
Wyandotte<br />
Atchison, Barber, Barton, Brown, Butler, Chase,<br />
Clay, Cloud, Coffey, Comanche, Cowley, Dickinson,<br />
Doniphan, Douglas, Edwards, Ellsworth, Franklin,<br />
Geary, Greenwood, Harper, Harvey, Jackson,<br />
Jefferson, Kingman, Kiowa, Leavenworth, Lincoln,<br />
Linn, Lyon, Marion, Marshall, McPherson, Miami,<br />
Morris, Nemaha, Osage, Ottawa, Pawnee,<br />
Pottawatomie, Pratt, Reno, Republic, Rice, Riley,<br />
Saline, Sedgwick, Shawnee, Stafford, Sumner,<br />
Wabaunsee, Washington, Woodson, Wyandotte<br />
$4,041,566<br />
$4,296,913<br />
378 5/2/1973 Severe<br />
Storms,<br />
Flooding<br />
267 7/15/1969 Tornadoes,<br />
Severe<br />
Storms,<br />
Flooding<br />
229 7/18/1967 Tornadoes,<br />
Severe<br />
Storms,<br />
Flooding<br />
Atchison, Barber, Barton, Bourbon, Brown, Butler,<br />
Chautauqua, Cherokee, Clark, Coffey, Crawford,<br />
Dickinson, Doniphan, Douglas, Edwards, Ellsworth,<br />
Ford, Franklin, Gray, Greenwood, Harper, Harvey,<br />
Haskell, Hodgeman, Jackson, Jefferson, Kingman,<br />
Kiowa, Labette, Leavenworth, Lincoln, Linn, Lyon,<br />
Marion, Marshall, McPherson, Meade, Miami,<br />
Montgomery , Morris, Nemaha, Ness, Osage,<br />
Osborne, Ottawa, Pawnee, Pottawatomie, Pratt,<br />
Reno, Republic, Rice, Rush, Russell, Saline,<br />
Sedgwick, Seward, Shawnee, Stafford, Stevens,<br />
Sumner, Wabaunsee, Washington, Woodson,<br />
Wyandotte<br />
Allen, Anderson, Bourbon, Crawford, Dickinson,<br />
Douglas, Ellsworth, Franklin, Johnson, Leavenworth,<br />
Linn, Lyon, McPherson, Miami, Morris, Neosho,<br />
Osage, Saline, Woodson, Wyandotte<br />
Anderson, Atchison, Chase, Cloud, Coffey,<br />
Crawford, Doniphan, Douglas, Finney, Franklin,<br />
Harper, Jackson, Jefferson, Kingman, Leavenworth,<br />
Linn, Lyon, Marion, Miami, Mitchell, Nemaha, Ness,<br />
Osage, Pottawatomie, Republic, Washington,<br />
Wabaunsee<br />
Emergency Declarations<br />
3324 6/25/2011 Flooding Atchison, Doniphan, Leavenworth and Wyandotte n/a<br />
$1,954,624<br />
$733,524<br />
$847,439<br />
Table 3.63. NCDC Flood Events for Johnson County, KS for <strong>the</strong> period from 1/1/2000 to<br />
12/31/2012<br />
Location Date Event Deaths Injuries Property<br />
Damages<br />
Johnson Co 03/04/2004 Flood 0 0 0.00K 0.00K<br />
Johnson Co 05/19/2004 Flood 0 0 0.00K 0.00K<br />
Johnson Co 07/24/2004 Flood 0 0 0.00K 0.00K<br />
Johnson Co 08/27/2004 Flood 0 0 0.00K 0.00K<br />
Johnson Co 06/04/2005 Flood 0 0 0.00K 0.00K<br />
Merriam 06/03/2008 Flood 0 0 0.00K 0.00K<br />
Crop<br />
Damages<br />
3.103
Merriam 06/03/2008 Flood 0 0 0.00K 0.00K<br />
Merriam 06/03/2008 Flood 0 0 0.00K 0.00K<br />
Totals: 8 0 0 0.00K 0.00K<br />
Source: http://www.ncdc.noaa.gov/stormevents/choosedates.jsp?statefips=20%2CKANSAS<br />
Table 3.64. NCDC Flash Flood Events for Johnson County, KS for <strong>the</strong> period from<br />
1/1/2000 to 12/31/2012<br />
Location Date Event Deaths Injuries Property<br />
Damages<br />
OVERLAND PARK 06/20/2000 Flash Flood 0 0 0.00K 0.00K<br />
OLATHE 06/01/2001 Flash Flood 0 0 5.00K 0.00K<br />
LEAWOOD 06/01/2001 Flash Flood 0 0 0.00K 0.00K<br />
OVERLAND PARK 06/05/2001 Flash Flood 0 0 0.00K 0.00K<br />
STILWELL 05/11/2002 Flash Flood 0 0 0.00K 0.00K<br />
OVERLAND PARK 06/22/2003 Flash Flood 0 0 0.00K 0.00K<br />
OVERLAND PARK 08/31/2003 Flash Flood 1 0 0.00K 0.00K<br />
OVERLAND PARK 03/04/2004 Flash Flood 0 0 0.00K 0.00K<br />
OLATHE 05/19/2004 Flash Flood 0 0 0.00K 0.00K<br />
DE SOTO 07/06/2004 Flash Flood 0 0 0.00K 0.00K<br />
GARDNER 07/16/2004 Flash Flood 0 0 0.00K 0.00K<br />
STANLEY 08/23/2004 Flash Flood 0 0 0.00K 0.00K<br />
STANLEY 08/24/2004 Flash Flood 0 0 0.00K 0.00K<br />
MISSION 08/27/2004 Flash Flood 0 0 500.00K 0.00K<br />
MISSION 08/27/2004 Flash Flood 0 0 0.00K 0.00K<br />
SHAWNEE 08/28/2004 Flash Flood 0 0 0.00K 0.00K<br />
GARDNER 06/04/2005 Flash Flood 0 0 0.00K 0.00K<br />
OVERLAND PARK 08/13/2005 Flash Flood 0 0 0.00K 0.00K<br />
GARDNER 08/19/2005 Flash Flood 0 0 0.00K 0.00K<br />
LENEXA 08/19/2005 Flash Flood 0 0 0.00K 0.00K<br />
MISSION 08/20/2005 Flash Flood 0 0 0.00K 0.00K<br />
GARDNER 07/11/2006 Flash Flood 0 0 0.00K 0.00K<br />
GARDNER 07/11/2006 Flash Flood 0 0 0.00K 0.00K<br />
SPRING HILL 07/11/2006 Flash Flood 0 0 0.00K 0.00K<br />
GARDNER 08/27/2006 Flash Flood 0 0 0.00K 0.00K<br />
SPRING HILL 08/27/2006 Flash Flood 0 0 0.00K 0.00K<br />
PRAIRIE VLG 08/27/2006 Flash Flood 0 0 0.00K 0.00K<br />
LENEXA 02/28/2007 Flash Flood 0 0 0.00K 0.00K<br />
MISSION 02/28/2007 Flash Flood 0 0 0.00K 0.00K<br />
MISSION 03/01/2007 Flash Flood 0 0 0.00K 0.00K<br />
LENEXA 03/01/2007 Flash Flood 0 0 0.00K 0.00K<br />
MISSION HILLS 04/25/2007 Flash Flood 0 0 0.00K 0.00K<br />
OVERLAND PARK 05/06/2007 Flash Flood 0 0 0.00K 0.00K<br />
STANLEY 06/29/2007 Flash Flood 0 0 0.00K 0.00K<br />
OVERLAND PARK 06/29/2007 Flash Flood 0 0 0.00K 0.00K<br />
GARDNER 06/30/2007 Flash Flood 0 0 0.00K 0.00K<br />
LENEXA 07/09/2007 Flash Flood 0 0 0.00K 0.00K<br />
OVERLAND PARK 07/09/2007 Flash Flood 0 0 0.00K 0.00K<br />
OVERLAND PARK 07/09/2007 Flash Flood 0 0 0.00K 0.00K<br />
EDGERTON 06/02/2008 Flash Flood 0 0 0.00K 0.00K<br />
Crop<br />
Damages<br />
3.104
WESTWOOD 06/03/2008 Flash Flood 0 0 0.00K 0.00K<br />
OLATHE 06/03/2008 Flash Flood 0 0 0.00K 0.00K<br />
LEAWOOD 07/30/2008 Flash Flood 0 0 0.00K 0.00K<br />
FAIRWAY 06/24/2009 Flash Flood 0 0 0.00K 0.00K<br />
WESTWOOD 08/17/2009 Flash Flood 0 0 0.00K 0.00K<br />
LENEXA 06/08/2010 Flash Flood 0 0 0.00K 0.00K<br />
STANLEY 06/08/2010 Flash Flood 0 0 0.00K 0.00K<br />
LEAWOOD 06/08/2010 Flash Flood 0 0 0.00K 0.00K<br />
LEAWOOD 06/12/2010 Flash Flood 0 0 0.00K 0.00K<br />
MORSE 06/14/2010 Flash Flood 0 0 0.00K 0.00K<br />
STILWELL HILLSIDE 06/16/2010 Flash Flood 0 0 0.00K 0.00K<br />
AR<br />
STILWELL MISSION 07/20/2010 Flash Flood 0 0 0.00K 0.00K<br />
ARP<br />
GARDNER ARPT 07/20/2010 Flash Flood 0 0 0.00K 0.00K<br />
OLATHE 05/06/2012 Flash Flood 0 0 0.00K 0.00K<br />
Totals: 54 1 0 505.00K 0.00K<br />
Source: http://www.ncdc.noaa.gov/stormevents/choosedates.jsp?statefips=20%2CKANSAS<br />
Table 3.65. NCDC Flood Events for Leavenworth County, KS for <strong>the</strong> period from 1/1/2000<br />
to 12/31/2012<br />
Location Date Event Deaths Injuries<br />
Property<br />
Damages<br />
Crop<br />
Damages<br />
LEAVENWORTH Co. 6/24/2000 Flood 0 0 0.00K 0.00K<br />
LEAVENWORTH Co. 3/15/2001 Flood 0 0 0.00K 0.00K<br />
LEAVENWORTH Co. 5/06/2001 Flood 0 0 0.00K 0.00K<br />
LEAVENWORTH Co. 6/19/2001 Flood 0 0 2.010M 0.00K<br />
LEAVENWORTH Co. 7/12/2001 Flood 0 0 0.00K 0.00K<br />
LEAVENWORTH Co. 7/19/2001 Flood 0 0 0.00K 0.00K<br />
LEAVENWORTH Co. 7/19/2001 Flood 0 0 0.00K 0.00K<br />
LEAVENWORTH Co. 9/17/2001 Flood 0 0 0.00K 0.00K<br />
LEAVENWORTH Co. 5/11/2002 Flood 0 0 0.00K 0.00K<br />
LEAVENWORTH Co. 5/19/2004 Flood 0 0 0.00K 0.00K<br />
LEAVENWORTH Co. 2/13/2005 Flood 0 0 0.00K 0.00K<br />
LEAVENWORTH Co. 5/13/2005 Flood 0 0 0.00K 0.00K<br />
LEAVENWORTH Co. 6/04/2005 Flood 0 0 0.00K 0.00K<br />
LEAVENWORTH Co. 6/06/2005 Flood 0 0 0.00K 0.00K<br />
LEAVENWORTH Co. 6/11/2005 Flood 0 0 0.00K 0.00K<br />
LEAVENWORTH Co. 10/02/2005 Flood 0 0 2.800M 300.00K<br />
EASTON 4/30/2006 Flood 0 0 0.00K 0.00K<br />
LOWEMONT 5/07/2007 Flood 0 0 750.00K 100.00K<br />
TONGANOXIE 5/07/2007 Flood 0 0 0.00K 0.00K<br />
3.105
EASTON 10/18/2007 Flood 0 0 0.00K 0.00K<br />
EASTON 12/11/2007 Flood 0 0 0.00K 0.00K<br />
EASTON 3/03/2008 Flood 0 0 0.00K 0.00K<br />
LENAPE 6/13/2010 Flood 0 0 0.00K 0.00K<br />
Totals: 23 0 0 5.560M 400.00K<br />
Source: http://www.ncdc.noaa.gov/stormevents/choosedates.jsp?statefips=20%2CKANSAS<br />
Table 3.66. NCDC Flash Flood Events for Leavenworth County, KS for <strong>the</strong> period from<br />
1/1/2000 to 12/31/2012<br />
Location Date Event Deaths Injuries<br />
Property<br />
Damages<br />
Crop<br />
Damages<br />
Tonganoxie 06/01/2001 Flash Flood 0 0 0.00K 0.00K<br />
Leavenworth 6/1/2001 Flash Flood 0 0 0.00K 0.00K<br />
Leavenworth 6/1/2001 Flash Flood 0 0 0.00K 0.00K<br />
Easton 6/19/2001 Flash Flood 0 0 0.00K 0.00K<br />
Easton 6/20/2001 Flash Flood 0 0 0.00K 0.00K<br />
Tonganoxie 6/12/2003 Flash Flood 0 0 0.00K 0.00K<br />
Tonganoxie 6/12/2003 Flash Flood 0 0 0.00K 0.00K<br />
Leavenworth 3/04/2004 Flash Flood 0 0 0.00K 0.00K<br />
Tonganoxie 7/06/2004 Flash Flood 0 0 0.00K 0.00K<br />
Tonganoxie 08/27/2004 Flash Flood 0 0 0.00K 0.00K<br />
Tonganoxie 08/27/2004 Flash Flood 0 0 0.00K 0.00K<br />
Leavenworth 4/11/2005 Flash Flood 0 0 0.00K 0.00K<br />
Leavenworth 5/11/2005 Flash Flood 0 0 0.00K 0.00K<br />
Tonganoxie 6/04/2005 Flash Flood 0 0 0.00K 0.00K<br />
Leavenworth 6/04/2005 Flash Flood 0 0 0.00K 0.00K<br />
Leavenworth 6/08/2005 Flash Flood 0 0 0.00K 0.00K<br />
Jarbalo 06/12/2005 Flash Flood 0 0 0.00K 0.00K<br />
Basehor 6/30/2005 Flash Flood 0 0 0.00K 0.00K<br />
Lansing 6/30/2005 Flash Flood 0 0 0.00K 0.00K<br />
Basehor 8/19/2005 Flash Flood 0 0 0.00K 0.00K<br />
Easton 10/02/2005 Flash Flood 0 0 1.200M 0.00K<br />
Leavenworth 10/02/2005 Flash Flood 0 0 1.000M 0.00K<br />
Lenape 6/07/2007 Flash Flood 0 0 2.00K 0.00K<br />
Tonganoxie 6/02/2008 Flash Flood 0 0 0.00K 0.00K<br />
Linwood 6/03/2008 Flash Flood 0 0 0.00K 0.00K<br />
3.106
Loring 6/05/2008 Flash Flood 0 0 0.00K 0.00K<br />
Leavenworth 7/02/2008 Flash Flood 0 0 0.00K 0.00K<br />
Leavenworth 7/02/2008 Flash Flood 0 0 0.00K 0.00K<br />
Lansing 7/02/2008 Flash Flood 0 0 0.00K 0.00K<br />
Lansing 9/12/2008 Flash Flood 0 0 0.00K 0.00K<br />
Easton 9/13/2008 Flash Flood 0 0 0.00K 0.00K<br />
Tonganoxie 4/25/2009 Flash Flood 0 0 0.00K 0.00K<br />
Lansing 4/26/2009 Flash Flood 0 0 0.00K 0.00K<br />
Reno 4/26/2009 Flash Flood 0 0 0.00K 0.00K<br />
Reno 5/15/2009 Flash Flood 0 0 0.00K 0.00K<br />
Leavenworth 8/17/2009 Flash Flood 0 0 0.00K 0.00K<br />
Lansing 8/17/2009 Flash Flood 0 0 0.00K 0.00K<br />
Leavenworth 8/17/2009 Flash Flood 0 0 0.00K 0.00K<br />
Fairmount 7/11/2010 Flash Flood 0 0 0.50K 0.00K<br />
Leavenworth 6.16.2919 Flash Flood 0 0 0.00K 0.00K<br />
Lansing 7/16/2010 Flash Flood 0 0 0.00K 0.00K<br />
Leavenworth 7.20/2010 Flash Flood 0 0 0.00K 0.00K<br />
Leavenworth 7/20/2010 Flash Flood 0 0 0.00K 0.00K<br />
Totals: 43 0 0 2.202M 0.00K<br />
Source: NCDC. http://www.ncdc.noaa.gov/stormevents/choosedates.jsp?statefips=20%2CKANSAS<br />
Table 3.67. NCDC Flood Events for Wyandotte County, KS for <strong>the</strong> period from 1/1/2000 to<br />
12/31/2012<br />
Location Date Event Deaths Injuries Property<br />
Damages<br />
Crop<br />
Damages<br />
Wyandotte Co. 5/03/2001 Flood 0 0 0.00K 0.00K<br />
Wyandotte Co. 6/20/2001 Flood 0 0 0.00K 0.00K<br />
Wyandotte Co. 5/19/2004 Flood 0 0 0.00K 0.00K<br />
Wyandotte Co. 8/27/2004 Flood 0 0 0.00K 0.00K<br />
Kansas City 5/07/2007 Flood 0 0 0.00K 0.00K<br />
Kansas Ctiy 5/08/2007 Flood 0 0 0.00K 0.00K<br />
Totals: 6 0 0 0.00K 0.00K<br />
Source: NCDC. http://www.ncdc.noaa.gov/stormevents/choosedates.jsp?statefips=20%2CKANSAS<br />
3.107
Table 3.68. NCDC Flash Flood Events for Wyandotte County, KS for <strong>the</strong> period from<br />
1/1/2000 to 12/31/2012<br />
Location Date Event Deaths Injuries Property<br />
Damages<br />
Crop<br />
Damages<br />
Kansas City 4/03/2001 Flash Flood 0 0 0.00K 0.00K<br />
Kansas City 4/14/2001 Flash Flood 0 0 0.00K 0.00K<br />
Kansas City 6/05/2001 Flash Flood 0 0 0.00K 0.00K<br />
Kansas City 5/19/2004 Flash Flood 0 0 0.00K 0.00K<br />
Kansas City 5/19/2004 Flash Flood 0 0 0.00K 0.00K<br />
Kansas City 7/06/2004 Flash Flood 0 0 0.00K 0.00K<br />
Bonner Spgs 8/27/2004 Flash Flood 0 0 1.000M 0.00K<br />
Kansas City 8/27/2004 Flash Flood 0 0 500.00K 0.00K<br />
Kansas City 8/27/2004 Flash Flood 0 0 0.00K 0.00K<br />
Kansas City 8/28/2004 Flash Flood 0 0 0.00K 0.00K<br />
Kansas City 5/12/2005 Flash Flood 0 0 0.00K 0.00K<br />
Kansas City 8/27/2006 Flash Flood 0 0 0.00K 0.00K<br />
Kansas City 5/06/2007 Flash Flood 0 0 0.00K 0.00K<br />
Bonner Spgs 6/07/2007 Flash Flood 0 0 0.00K 0.00K<br />
Sunflower 10/17/2007 Flash Flood 0 0 0.00K 0.00K<br />
Kansas City 7/02/2008 Flash Flood 0 0 0.00K 0.00K<br />
Kansas City 7/02/2008 Flash Flood 0 0 30.00K 0.00K<br />
Turner 7/27/2009 Flash Flood 0 0 00.0K 00.0K<br />
Pomeroy 7/27/2009 Flash Flood 0 0 5.00K 0.00K<br />
Muncie 8/17/2009 Flash Flood 0 0 0.00K 0.00K<br />
Turner 7/11/2010 Flash Flood 0 0 0.00K 0.00K<br />
Totals: 21 0 0 1.530M 0.00K<br />
Source: NCDC. http://www.ncdc.noaa.gov/stormevents/choosedates.jsp?statefips=20%2CKANSAS<br />
Selected Event Narratives<br />
FEMA-4035-DR: Flooding—September 23, 2011<br />
Four counties in Nor<strong>the</strong>ast Kansas were declared for flooding that occurred from June 1 to<br />
August 1, 2011 along <strong>the</strong> Missouri River. These Counties included Atchison, Doniphan,<br />
Leavenworth, and Wyandotte. Damages as a result of this event were estimated to be nearly<br />
$1,211,416.62 and primarily involved damages to roads and bridges.<br />
Record snowfall in <strong>the</strong> Rocky Mountains of Montana and Wyoming along with near record<br />
spring rainfall in central and eastern Montana triggered severe flooding within <strong>the</strong> Upper<br />
Missouri River Basin. According to <strong>the</strong> National Wea<strong>the</strong>r Service, in <strong>the</strong> second half of <strong>the</strong><br />
month of May 2011, almost a year’s worth of rain fell over <strong>the</strong> upper Missouri River Basin. This<br />
extremely heavy rainfall, in conjunction with an estimated 212 percent of normal snowpack in<br />
<strong>the</strong> Rocky Mountains, contributed to this flooding event.<br />
All six major dams along <strong>the</strong> Missouri River released record amounts of water to prevent<br />
overflow and devastating consequences to towns and cities along <strong>the</strong> river from Montana to<br />
Missouri.<br />
3.108
The Corps of Engineers reported that every non-federal levee from Rulo to Wolcott, Kansas in<br />
Wyandotte County on both sides of <strong>the</strong> river were ei<strong>the</strong>r overtopped or breached. Included in<br />
<strong>the</strong> over toppings was Kansas Department of Corrections land below <strong>the</strong> Lansing Correctional<br />
Facility in Leavenworth County. The federal levee at Fort Leavenworth by Sherman Army<br />
Airfield was also breached. Water reached <strong>the</strong> previously evacuated hangars.<br />
Figure 3.24. Missouri River Flooding 2011 –<br />
Leavenworth County<br />
Figure 3.25. Missouri River Flooding 2011 showing Gauge at 29 ft.<br />
O<strong>the</strong>r Notable Flood Events<br />
• June 2001: Storms dumped 5½ inches of rain on Easton in Leavenworth County. Stranger<br />
Creek overflowed and tore through houses, mobile homes, and fields and closed <strong>the</strong><br />
Kansas Turnpike. Officials estimated 75 to 100 households in <strong>the</strong> town of about 360<br />
residents were flooded. Twenty-six homes were destroyed, 21 received major damage, and<br />
25 o<strong>the</strong>rs had minor damage.<br />
• March 2004: Heavy rains caused flooding on area streams and creeks. Indian Creek at<br />
Overland Park crested at 12.69 feet or 0.69 feet above flood stage. The Blue River at<br />
Stanley crested at 19.44 feet. 3.44 feet above flood stage.<br />
• May 2004: Stranger Creek at Easton crested at 18.45 feet, or 1.45 feet above flood stage.<br />
The Blue River near Stanley crested at 20.12 feet, or 4.12 feet above flood stage.<br />
• May 2007: A slow moving cold front combined with an upper level storm system, produced<br />
widespread flash flooding and large hail across <strong>the</strong> area from late on May 5th through May<br />
6th 2007. The Kansas River at <strong>the</strong> 23rd Street Bridge crested at 40.96 feet, or 7.96 feet<br />
above flood stage in Wyandotte County.<br />
• June 2008: Severe thunderstorms erupted across <strong>the</strong> area on June 3, 2008. T<strong>here</strong> were<br />
reports of large hail and very heavy rains with flash flooding. An underpass was reported<br />
full of standing water, and several roads were washed out 3 miles west of Linwood. The<br />
planning area reported flooding in various jurisdictions.<br />
3.109
• June 2010: A frontal boundary continued to meander around <strong>the</strong> region. Thunderstorms<br />
with very heavy rains, caused several reports of flash flooding across <strong>the</strong> area, in <strong>the</strong> late<br />
evening and early morning hours of, June 13th and 14th, 2010. Up to four inches of water<br />
was reported over 174th Street and Hemphill Road and up to two feet of water was reported<br />
on area roads in Johnson County.<br />
Extent<br />
The reported flooding events according to <strong>the</strong> NCDC database for <strong>the</strong> three counties that make<br />
up Region L are as follows:<br />
• Within <strong>the</strong> last twelve years, Johnson County has experienced 8 floods and 54 flash<br />
floods. During <strong>the</strong> flood events, various rivers and creeks within Johnson County have<br />
crested at 0.22 to 4.12 feet above <strong>the</strong>ir respective flood stages. The following are <strong>the</strong><br />
documented events for <strong>the</strong>se crest:<br />
o<br />
o<br />
05/19/2004 Stranger Creek at Easton crested at 18.45 feet, or 1.45 feet above<br />
flood stage. The Blue River near Stanley crested at 20.12 feet, or 4.12 feet above<br />
flood stage.<br />
07/24/2004 Indian Creek in Overland Park crested at 12.22 feet, or 0.22 feet<br />
above flood stage.<br />
• Between 2000 and 2012, Leavenworth County experienced 23 floods and 43 flash<br />
floods. The rivers and creeks within Leavenworth County crested during <strong>the</strong>se flood<br />
events at .25 feet to 10.80 feet above <strong>the</strong> flood stage. Following are <strong>the</strong> events that<br />
detail <strong>the</strong>se flood stages.<br />
o<br />
o<br />
02/14/2005 - The Stranger Creek near Easton crested at 17.25 feet, or 0.25 feet<br />
above flood stage.<br />
05/9/2007 - The Stranger Creek at Easton had its highest crest ever on May<br />
7,2007. It crested at 27.80 feet, or 10.80 feet above flood stage. Several homes<br />
and businesses suffered damage.<br />
• Wyandotte County experienced 6 floods and 21 flash flood events between <strong>the</strong> years<br />
2000 and 2012. During <strong>the</strong> flood events, various rivers and creeks crested at .19 feet to<br />
7.96 feet above flood stage. Following are <strong>the</strong> documented events for <strong>the</strong>se crest:<br />
o<br />
o<br />
05/19/2004 - Turkey Creek at Southwest Blvd in Kansas City, Kansas crested at<br />
61.19 feet, or 0.19 of a foot above flood stage.<br />
05/07/2007 to 05/11/2007 - A slow moving cold front combined with an upper<br />
level storm system, produced widespread flash flooding and large hail across <strong>the</strong><br />
area from late on May 5th through May 6th 2007. The Kansas River at <strong>the</strong> 23rd<br />
Street Bridge crested at 40.96 feet, or 7.96 feet above flood stage.<br />
3.110
Probability of Future Hazard Events<br />
The planning area has been in 16 declared Presidential Disaster that includes flooding during<br />
<strong>the</strong> years 1969 – 2011. They have had a total of 158 incidences of flooding in <strong>the</strong> past 12 years,<br />
2000 – 2012. This hazard has been deemed to be “Highly Likely” by <strong>the</strong> planning committee.<br />
The following details <strong>the</strong> probability for each county in Region L:<br />
Table 3.69. Probability for Region L<br />
County<br />
# of Flood<br />
Events<br />
Probability<br />
(%) of Flood in<br />
a given Year<br />
# of Flash Flood<br />
Events<br />
Johnson 8 66.6% 54 100%<br />
Leavenworth 23 100% 43 100%<br />
Wyandotte 6 50% 21 100%<br />
Impact and Vulnerability<br />
The vulnerability to flooding for Region L was determined using several sources:<br />
• NCDC Storm Events Database<br />
• USDA Risk Management Agency Crop Loss Statistics<br />
• HAZUS MH 2.1 100-year Flood Scenario<br />
• NCDC Storm Events Database<br />
Probability (%)<br />
of a Flash<br />
Flood in a<br />
Given Year<br />
The NCDC Storm Events Database was <strong>the</strong> primary source of data to complete <strong>the</strong> vulnerability<br />
analysis of flash flood in <strong>the</strong> State; while <strong>the</strong> HAZUS MH 2.1 analysis was utilized to describe<br />
vulnerability to riverine flooding.<br />
Flash flooding is not considered to be a “geographic” hazard. Due to <strong>the</strong> large number of<br />
variables that occur in rainfall amounts and intensity, it is not possible to predict all specific<br />
locations that are vulnerable to flash flooding. However, it is known that certain low-lying areas<br />
with poor drainage are more vulnerable than areas higher in elevation with good drainage.<br />
Additionally, historical statistics of areas that have been prone to flash flooding in <strong>the</strong> past can<br />
be utilized to determine potential vulnerability to future flash flooding.<br />
The NCDC Storm Events Database is currently undergoing a revision. The online availability of<br />
historical events is limited to data from 10/1/2000 to 7/31/2012. Over 12 years of data is<br />
available in <strong>the</strong> online version, and flash flooding generally occurs annually in prone areas, <strong>the</strong><br />
planning committee decided to use this more current data to analyze flash flooding events in<br />
Region L. For <strong>the</strong> period 2000 to 2012 <strong>the</strong>re were 37 riverine flood events and 121 flash flood<br />
events. Historic riverine and flash flood events and damages are included in <strong>the</strong> table below.<br />
Note that all damages are not represented and impossible to obtain.<br />
3.111
Table 3.70. Summary of Reported Flood Events in <strong>the</strong> Planning Area, 2000 - 2012<br />
County<br />
# of Flood<br />
Events<br />
Johnson 62<br />
Leavenworth 67<br />
Wyandotte 29<br />
Total 158<br />
Deaths Injuries Property<br />
Damage<br />
1 0 $505,000<br />
0 0 $7,762,000<br />
0 0 $1,530,000<br />
1 0 $9,797,000<br />
USDA Risk Management Agency Crop Insurance Payments<br />
Table 3.71 provides total crop insurance payments and annualized crop insurance payments for<br />
flood damage in Region L over <strong>the</strong> 10-year period from 2002 to 2011. The USDA does not<br />
differentiate damages from riverine flooding and flash flooding. These losses include combined<br />
losses for both types of flooding. The crop exposure value from <strong>the</strong> 2007 Census of Agriculture<br />
is provided to provide <strong>the</strong> basis for an annualized ratio of insurance payments to total value.<br />
Please note that this data only applies to insured crops. According to <strong>the</strong> 2011 Kansas Crop<br />
Insurance Profile Report issued by <strong>the</strong> USDA Risk Management Agency 82 percent of Kansas’<br />
row crops were insured in 2011. The crop exposure values have not been adjusted in <strong>the</strong> table<br />
below:<br />
Table 3.71. Flood-Related Crop Insurance Payments Analysis (2002-2011)<br />
Crop Exposure<br />
Value (2007<br />
Census of<br />
Agriculture)<br />
Flood-Related<br />
Crop Insurance<br />
payments 2002-<br />
2011<br />
Annualized Crop<br />
Insurance<br />
payments<br />
Annualized<br />
Flood-<br />
Related<br />
Crop<br />
Insurance<br />
Payment<br />
Ratio<br />
County<br />
Mitigation Planning Region L<br />
Johnson $29,472,000 $1,070,834 $107,083 0.36%<br />
Leavenworth $20,983,000 $3,290,635 $329,064 1.57%<br />
Wyandotte Not Reported $0 $0 Not Reported<br />
Total $50,455,000 $4,361,469 $436,147<br />
Source: USDA Risk Management Agency; 2007 USDA Census of Agriculture; Note: Crop Exposure for Elk, Wichita &<br />
Wyandotte Counties was not published to avoid disclosure of individual operations.<br />
HAZUS MH 2.1 100-year Food Scenario<br />
The results of <strong>the</strong> HAZUS analysis were utilized to estimate potential losses for riverine flooding.<br />
The intent of this analysis was to enable <strong>the</strong> planning area to estimate w<strong>here</strong> flood losses could<br />
occur and <strong>the</strong> degree of severity using a consistent methodology. The HAZUS model helps<br />
quantify risk along known flood-hazard corridors as well as lesser streams and rivers that have<br />
a drainage area of 10 square miles or more.<br />
3.112
The HAZUS-MH analysis provides <strong>the</strong> number of buildings impacted, estimates of <strong>the</strong> building<br />
repair costs, as well as <strong>the</strong> associated loss of building contents and business inventory. This<br />
analysis is based on riverine flooding. Building damage can also cause additional losses to a<br />
community as a whole by restricting a building’s ability to function properly. Income loss data<br />
accounts for losses such as business interruption and rental income losses as well as <strong>the</strong><br />
resources associated with damage repair and job and housing losses. These losses are<br />
calculated by HAZUS-MH using a methodology based on <strong>the</strong> building damage estimates.<br />
Among o<strong>the</strong>r factors, flood damage is related to <strong>the</strong> depth of flooding. HAZUS-MH takes into<br />
account flood depth when modeling damage (based on FEMA’s depth-damage functions). The<br />
HAZUS-MH reports capture damage by occupancy class (in terms of square footage impacted)<br />
by damage percent classes. Occupancy classes in HAZUS-MH include agriculture,<br />
commercial, education, government, industrial, religion, and residential. Damage percent<br />
classes are grouped by 10 percent increments 1-10 percent, 11-20 percent, etc., up to 50<br />
percent. Buildings that sustain more than 50 percent damage are considered to be<br />
“substantially” damaged.<br />
The displaced population is based on <strong>the</strong> inundation area. Individuals and households will be<br />
displaced from <strong>the</strong>ir homes even when <strong>the</strong> home has suffered little or no damage ei<strong>the</strong>r<br />
because <strong>the</strong>y were evacuated or <strong>the</strong>re was no physical access to <strong>the</strong> property because of<br />
flooded roadways. Displaced people using shelters will most likely be individuals with lower<br />
incomes and those who do not have family or friends within <strong>the</strong> immediate area. HAZUS-MH<br />
does not model flood casualties.<br />
According to <strong>the</strong> HAZUS MH2 2.1 one percent annual chance flood scenario results, <strong>the</strong>re are<br />
3,523 buildings in <strong>the</strong> one percent annual chance floodplain. Additionally, <strong>the</strong> planning area<br />
population vulnerable to displacement from <strong>the</strong> one percent annual chance flood scenario is<br />
15,972. Table 3.72 provides <strong>the</strong> HAZUS results for <strong>the</strong> number of vulnerable buildings and<br />
population vulnerable to displacement for Region L.<br />
Table 3.72. Vulnerable Buildings and Population, HAZUS One Percent Annual Chance<br />
Flood Scenario<br />
Vulnerable<br />
Buildings<br />
Population Vulnerable to<br />
Displacement<br />
County<br />
Mitigation Planning Region L<br />
Johnson 1,896 8,853<br />
Leavenworth 97 1,541<br />
Wyandotte 1,530 5,578<br />
Total 3,523 15,972<br />
Source: State Hazard Mitigation Plan, 2013<br />
Table 3.73 that follows provides total direct building loss and income loss for each county in <strong>the</strong><br />
region. Table 3.74 provides <strong>the</strong> HAZUS results for vulnerable populations and <strong>the</strong> population<br />
estimated to seek short term shelter as well as <strong>the</strong> numbers of damaged and substantially<br />
damaged buildings for each county.<br />
3.113
Table 3.73. HAZUS MH 2.1 Flood Scenario Direct Building and Income Losses<br />
County<br />
Structural<br />
Damage<br />
Contents Damage Inventory Loss Total Direct Loss<br />
Mitigation Planning Region L<br />
Total Income<br />
Loss<br />
Total Direct and<br />
Income Loss<br />
Johnson $382,539,000 $428,080,000 $18,715,000 $829,334,000 $2,824,000 $832,158,000 0.59%<br />
Leavenworth $19,997,000 $19,661,000 $480,000 $40,138,000 $198,000 $40,336,000 0.25%<br />
Wyandotte $215,582,000 $366,298,000 $28,175,000 $610,055,000 $2,386,000 $612,441,000 1.79%<br />
Total $618,118,000 $814,039,000 $47,370,000 $1,479,527,000 $5,408,000 $1,484,935,000<br />
Source: State Hazard Mitigation Plan, HAZUSMH 2.1<br />
Structure<br />
and<br />
Contents<br />
Loss Ratio<br />
Table 3.74. HAZUS MH 2.1 Flood Scenario Displaced Population and Number of Damaged/Substantially Damaged Buildings<br />
County<br />
Population Vulnerable to<br />
Displacement (# of<br />
persons)<br />
Short Term Shelter Needs<br />
(# of persons)<br />
Damaged<br />
Buildings<br />
Substantially Damaged<br />
Buildings<br />
Vulnerable<br />
Buildings<br />
Mitigation Planning Region L<br />
Johnson 8,853 7,594 1,896 1,475 696<br />
Leavenworth 1,541 702 97 21 0<br />
Wyandotte 5,578 4,848 1,530 1,273 648<br />
Total 15,972 13,144 3,523 1,344<br />
Source: State Hazard Mitigation Plan, HAZUSMH 2.1<br />
3.114
NFIP Participation and Repetitive Flood Losses Information on NFIP participation and flood loss<br />
claims were obtained from FEMA’s Policy and Claim Statistics for Flood Insurance. This source<br />
provides losses from 1978 to August 2012. As of October 2012, Region L had a total of 1,571<br />
insurance policies in force.<br />
T<strong>here</strong> are several limitations to this data, including:<br />
• Only losses to participating NFIP communities are represented,<br />
• Communities joined <strong>the</strong> NFIP at various times since 1978,<br />
• The number of flood insurance policies in effect may not include all structures at risk to<br />
flooding, and<br />
• Some of <strong>the</strong> historical loss areas have been mitigated with property buyouts.<br />
• Some properties are under-insured. The flood insurance purchase requirement is for flood<br />
insurance in <strong>the</strong> amount of federally-backed mortgages, not <strong>the</strong> entire value of <strong>the</strong> structure.<br />
Additionally, contents coverage is not required.<br />
Table 3.75. NFIP Status for Region L Jurisdictions<br />
Community CID Curr Eff Map Date<br />
Johnson County<br />
Desoto, City of 200161 08/03/09<br />
Edgerton, City of 200162 08/03/09<br />
Fairway, City of 205185 08/03/09<br />
Gardner, City of 200164 08/03/09<br />
Johnson County 200159 08/03/09<br />
Lake Quivira, City of 200166 Suspended<br />
Leawood, City of 200167 08/03/09<br />
Lenexa, City of 200168 08/03/09<br />
Merriam, City of 200169 08/03/09<br />
Mission Hills, City of 200171 08/03/09<br />
Ola<strong>the</strong>, City of 200173 08/03/09<br />
Overland Park, City of 200174 08/03/09<br />
Prairie Village, City of 200175 08/03/09<br />
Roeland Park, City of 200176 08/03/09<br />
Shawnee, City of 200177 08/03/09<br />
Spring Hill, City of 200178 08/03/09<br />
Westwood, City of 200179 NFSHA<br />
Westwood Hills, City of 200180 NFSHA<br />
Leavenworth County<br />
Basehor, City of 200187 08/18/09<br />
Easton, City of 200188 08/18/09<br />
Lansing, City of 200189 08/18/09<br />
Leavenworth County 200186 08/18/09<br />
Leavenworth, City of 200190 08/18/09<br />
Linwood, City of 200191 08/18/09<br />
Tonganoxie, City of 200192 08/18/09<br />
3.115
Wyandotte County<br />
Bonner Springs, City of 200361 09/02/11<br />
Edwardsville, City of 200362 09/02/11<br />
Kansas City, City of 200363 09/02/11<br />
Wyandotte County 200562 09/02/11<br />
The NFIP Policy and Loss statistics show a pattern of historical flood losses for <strong>the</strong> counties of<br />
Johnson, Leavenworth, and Wyandotte. The greatest losses have been in Wyandotte and<br />
Johnson Counties. Table 3.76 provides summary data on NFIP policies and losses<br />
Table 3.76. Summary of Policies, Insurance, and Closed Losses for Region L<br />
Number of<br />
County<br />
Policies in<br />
Force Insurance in Force<br />
Total Payments<br />
(1978 – 8/2012)<br />
Johnson 1,005 $250,485,700 $8,651,619<br />
Leavenworth 264 $53,334,200 $2,647,895<br />
Wyandotte 302 $83,151,500 $9,955,138<br />
Subtotal 1,571 $386,971,400 $21,254,652<br />
Source: FEMA, http://bsa.nfipstat.fema.gov/reports/1040.htm#20<br />
Table 3.77 show a breakdown of claims for local jurisdictions.<br />
Table 3.77. Claims for Local Jurisdictions in Region L<br />
Johnson County<br />
Jurisdiction Total Losses Total Payments<br />
Desoto 1 .00<br />
Edgerton 2 3142.55<br />
Fairway 100 1,349,913.69<br />
Johnson County 37 358,147.50<br />
Leawood 80 1,034,552.28<br />
Lenexa 17 53,342.46<br />
Merriam 96 1,675,284.70<br />
Mission Hills 56 1.336.277.00<br />
Mission 69 332,542.10<br />
Ola<strong>the</strong> 23 71,187.75<br />
Overland Park 288 1,286,883.32<br />
Prairie Village 111 552,074.57<br />
Roeland park 40 145,364.37<br />
Shawnee 61 429,871.38<br />
Westwood Hills 2 5,973.27<br />
Westwood 6 17,061.95<br />
3.116
Leavenworth County<br />
Jurisdiction Total Losses Total Payments<br />
Basehor 1 6,925.42<br />
Easton 111 1,491,916.68<br />
Lansing 5 17,523.34<br />
County 29 324,118.50<br />
Leavenworth 59 734,527.01<br />
Linwood 1 .00<br />
Tonganoxie 8 72,883.55<br />
Wyandotte County<br />
Jurisdiction Total Losses Total Payments<br />
Bonner Springs 61 570,858.48<br />
Edwardsville 11 153,716.43<br />
Kansas City 321 9,198,294.47<br />
County 6 32,268.64<br />
Source: FEMA, http://bsa.nfipstat.fema.gov/reports/1040.htm#20<br />
Repetitive Loss Properties<br />
A high priority in <strong>the</strong> planning area is <strong>the</strong> reduction in <strong>the</strong> number of repetitive loss structures.<br />
These structures strain <strong>the</strong> National Flood Insurance Fund on a national basis by increasing <strong>the</strong><br />
NFIP’s annual losses and <strong>the</strong> need for borrowing. More importantly, <strong>the</strong>y drain resources<br />
needed to prepare for catastrophic events. The NFIP defines a repetitive loss property as “any<br />
insurable building for which two or more claims of more than $1,000 were paid by <strong>the</strong> NFIP<br />
within any rolling 10-year period, since 1978. At least two of <strong>the</strong> claims must be more than 10<br />
days apart.”<br />
History of Repetitive Loss<br />
Table 3.78 shows <strong>the</strong> number and location (by county and community) of repetitive loss and<br />
severe repetitive loss properties in <strong>the</strong> planning area. Johnson County has <strong>the</strong> most repetitive<br />
loss properties in <strong>the</strong> State of Kansas with 93.<br />
Table 3.78. Kansas Repetitive Loss Properties (In Order by Number of Properties)<br />
Community<br />
# Rep Loss<br />
Properties<br />
# Mitigated Non-Mitigated<br />
Properties<br />
Johnson County<br />
93 27 66<br />
Severe Repetitive<br />
Loss Residential<br />
Properties<br />
Johnson<br />
County Total<br />
Fairway 12 6 6 1<br />
Johnson Co. 3 0 3<br />
Leawood 6 1 5<br />
Lenexa 3 2 1<br />
3.117
Merriam 16 9 7<br />
Mission Hills 8 0 8 2<br />
Mission 6 3 3<br />
Ola<strong>the</strong> 1 1 0<br />
Overland Park 22 5 17<br />
Prairie Village 13 0 13<br />
Roeland Park 1 0 1<br />
Westwood 1 0 1<br />
Shawnee 4 3 1<br />
Wyandotte County<br />
Wyandotte<br />
46 8 41<br />
County Total<br />
Edwardsville 2 0 2<br />
Kansas City 36 5 31<br />
Bonnie<br />
Springs<br />
8 0 8<br />
Leavenworth County<br />
Leavenworth<br />
25 14 10<br />
County Total<br />
Easton 16 12 4<br />
Leavenworth<br />
3 2 1<br />
Co.<br />
Leavenworth<br />
5 0 5<br />
City of<br />
Tonganoxie 1 1 0<br />
Source: KS State Hazard Mitigation Program<br />
Severe Repetitive Loss<br />
The Flood Insurance Reform Act of 2004 identified ano<strong>the</strong>r category of repetitive loss,<br />
categorized as Severe Repetitive Loss (SRL). SRL properties are defined it as “a single family<br />
property (consisting of one-to-four residences) that is covered under flood insurance by <strong>the</strong><br />
NFIP and has incurred flood-related damage for which four or more separate claims payments<br />
have been paid under flood insurance coverage with <strong>the</strong> amount of each claim payment<br />
exceeding $5,000 and with cumulative amounts of such claims payments exceeding $20,000; or<br />
for which at least two separate claims payments have been made with <strong>the</strong> cumulative amount of<br />
such claims exceeding <strong>the</strong> reported value of <strong>the</strong> property. As of October 1, 2012, <strong>the</strong>re are 3<br />
validated insured residential properties in <strong>the</strong> planning area that meet <strong>the</strong> qualifications of SRL<br />
and <strong>the</strong> requirements to be considered for possible mitigation activities under FEMA’s SRL<br />
criteria. Table 3.79 provides additional information on losses associated with <strong>the</strong>se 3<br />
properties.<br />
Table 3.79. Verified Residential Insured Severe Repetitive Loss Properties<br />
Name Community Name Total Paid Losses<br />
SRL<br />
Status<br />
Mitigation Planning Region L<br />
Johnson Fairway, City Of $74,824 5 V<br />
3.118
Name Community Name Total Paid Losses<br />
Johnson Mission Hills, City Of $307,482 4 V<br />
Johnson Mission Hills, City Of $343,821 4 V<br />
Source: Flood Insurance Administration as of Oct 2, 2012. V – validated.<br />
History of Severe Repetitive Loss<br />
SRL<br />
Status<br />
In addition to <strong>the</strong> verified residential, insured properties above, <strong>the</strong> NFIP tracks o<strong>the</strong>r categories<br />
of properties, including unverified properties, commercial properties, previously mitigated<br />
properties, and currently uninsured properties that meet <strong>the</strong> loss criteria.<br />
The following table shows <strong>the</strong> communities with <strong>the</strong> repetitive loss properties.<br />
Table 3.80. Kansas Severe Repetitive Loss Claims<br />
Mitigation Planning Region L<br />
Johnson Fairway, City Of $74,824 5 V*<br />
Johnson Johnson County $125,677 5 VU<br />
Johnson Merriam, City Of $171,306 8 VU<br />
Johnson Mission Hills, City Of $307,482 4 V*<br />
Johnson Mission Hills, City Of $343,821 4 V*<br />
Johnson Roeland Park, City Of $97,503 15 VU<br />
Johnson Shawnee, City Of $177,471 5 PN<br />
Leavenworth Easton, City Of $77,843 2 MV<br />
Wyandotte Kansas City, City Of $121,269 4 VNU<br />
Wyandotte Kansas City, City Of $98,585 4 PNU<br />
Wyandotte Kansas City, City Of $514,926 8 VN<br />
Wyandotte Kansas City, City Of $147,317 4 VNU<br />
Wyandotte Kansas City, City Of $599,430 10 PNU<br />
Wyandotte Kansas City, City Of $1,288,116 8 PN<br />
Wyandotte Kansas City, City Of $324,730 16 PN<br />
Wyandotte Kansas City, City Of $829,891 7 PN<br />
Wyandotte Kansas City, City Of $213,479 5 VNU<br />
Wyandotte Kansas City, City Of $44,288 7 VU<br />
Total $5,557,959 121<br />
Source: Flood Insurance Administration (current as of October 2, 2012): MV-Mitigated Validated, MVU-Mitigated Validated<br />
Uninsured, V- Validated, VU-Validated Uninsured, VN-Validated Non Residential, VNU-Validated Nonresidential Uninsured, P-<br />
Pending, PU-Pending Uninsured, PN-Pending Non Residential PNU- Pending Nonresidential Uninsured<br />
Mitigation of Severe Repetitive Loss<br />
Of <strong>the</strong> 18 SRL properties in <strong>the</strong> planning area, only one has been mitigated The property<br />
located in Easton, Leavenworth County, was mitigated through ICC (Increased Cost of<br />
Compliance).<br />
3.119
Mitigation of Repetitive Loss Properties<br />
Region L has flooding as a known hazard, and has adopted <strong>the</strong> State of Kansas policy of<br />
mitigating repetitive loss properties as a priority use of mitigation funds. Of <strong>the</strong> 164 properties<br />
that meet <strong>the</strong> definition of repetitive loss in <strong>the</strong> planning area, 49 have been mitigated, leaving<br />
just 117 unmitigated repetitive loss properties. A summary is provided below of <strong>the</strong> mitigation<br />
methods utilized for <strong>the</strong> 49 mitigated properties.<br />
• The majority of <strong>the</strong> properties that received mitigation funds were a part of <strong>the</strong><br />
acquisition/demolition program<br />
• Merriam, in Johnson County, provided <strong>the</strong>ir own funds to mitigate for repetitive<br />
properties through acquisition/demolition.<br />
Community Rating System<br />
For communities that participate in <strong>the</strong> NFIP, any development in <strong>the</strong> floodplain should be built<br />
according to its corresponding floodplain management ordinance. According to <strong>the</strong> State’s<br />
minimum standards, <strong>the</strong> first floor elevations of residential property must be a minimum of one<br />
foot above <strong>the</strong> base flood elevation. For non-residential properties, <strong>the</strong> standard is to ei<strong>the</strong>r<br />
elevate or flood proof to one foot above <strong>the</strong> base flood elevation. Additionally, <strong>the</strong> communities<br />
listed in Table 3.81 are part of <strong>the</strong> NFIPs Community Rating System (CRS) and are taking steps<br />
above and beyond <strong>the</strong> minimum requirements to qualify for reductions in flood insurance<br />
premiums. Additionally, <strong>the</strong> floodplain management practices for CRS communities are<br />
<strong>review</strong>ed on a periodic cycle, typically every five years.<br />
Table 3.81. Kansas Communities in <strong>the</strong> NFIP’s Community Rating System (CRS)<br />
Mitigation<br />
Planning<br />
Region Community County<br />
CRS<br />
Entry<br />
Date<br />
Current<br />
class<br />
% Discount<br />
for SFHA<br />
L Lansing, City of Leavenworth 5/1/2011 8 10 5<br />
L Kansas City Wyandotte 5/1/2013 7 20 10<br />
L Lenexa, City of Johnson 10/1/2011 8 10 5<br />
L Ola<strong>the</strong>, City of Johnson 10/1/1993 8 10 5<br />
L Overland Park, City of Johnson 10/1/2009 8 10 5<br />
L Shawnee, City of Johnson 10/1/1991 8 10 5<br />
Source: State Hazard Mitigation Plan 2013<br />
% Discount for<br />
Non-SFHA<br />
T<strong>here</strong> are many different ways to earn CRS points in order to move up <strong>the</strong> coveted levels and<br />
reduce NFIP payment amounts. Following are a few of <strong>the</strong>m: organize to prepare <strong>the</strong> plan;<br />
involve <strong>the</strong> Public; coordinate; assess <strong>the</strong> hazard; assess <strong>the</strong> problem; set goals; <strong>review</strong><br />
possible activities; draft an action plan; adopt <strong>the</strong> plan; implement, evaluate, and revise. For a<br />
complete picture of how credits can be earned through <strong>the</strong>se steps, <strong>the</strong> CRS Coordinator’s<br />
Manual gives detailed instructions.<br />
3.120
Summary<br />
The vulnerability of Region L to flooding is high. Health and safety impacts of flooding can be<br />
devastating and can lead to <strong>the</strong> loss of life to floods. During <strong>the</strong> last 50 years fatalities have<br />
declined, yet economic losses (e.g., property, crop, and infrastructure) have risen (USGS 2006).<br />
This increase in losses can be attributed in part to encroachment of urban and agricultural<br />
development onto floodplains, which increases <strong>the</strong> potential for flood damage. Environmental<br />
and cultural resources are also susceptible to flooding. Prolonged flood conditions, such as<br />
experienced in 1993, 2007, and 2011 can kill wildlife, contaminate recreational areas, remove<br />
vegetation, saturate <strong>the</strong> ground for months and stress infrastructure such as roads.<br />
Public health concerns that may result from flooding include <strong>the</strong> following:<br />
• Drowning while driving. Almost half of <strong>the</strong> fatalities in 2010 during flood conditions were<br />
a result of drowning while attempting to drive through floodwaters. Only 18 inches of<br />
water is needed to lift a vehicle at which point <strong>the</strong> vehicle becomes buoyant and easily<br />
pushed by <strong>the</strong> flood waters.<br />
• Contaminated drinking water due to waterborne diseases. Flooding can overwhelm<br />
drinking water infrastructure and wells, which reduces or prevents water purification. ½<br />
of waterborne disease outbreaks in <strong>the</strong> U.S. occur in <strong>the</strong> aftermath of heavy rain.<br />
• Sewage back-up in plumbing – flooding can cause sewage lines and septic tanks to<br />
overflow, resulting in sewage backing up into people’s residences or o<strong>the</strong>r structures.<br />
Raw sewage is a health hazard that contains bacteria, viruses, and o<strong>the</strong>r disease<br />
causing germs. Gastrointestinal illnesses, skin infections, and rashes are a few of <strong>the</strong><br />
common health concerns when sewage backs up into residences and o<strong>the</strong>r structures.<br />
• Mold is ano<strong>the</strong>r concern in <strong>the</strong> aftermath of flooding. Water intrusion anyw<strong>here</strong> in a<br />
structure can cause toxic mold to grow in ceilings, walls, and insulation. Breathing in<br />
mold can lead to symptoms that include sinus infection, congestion, coughing, breathing<br />
problems, skin and eye irritation. When individuals are immunocompromised, or have<br />
established lung issues such as asthma or COPD, mold can exacerbate <strong>the</strong> condition.<br />
• Vector Control after a flood is critical in controlling waterborne pests such as mosquitoes<br />
which can cause arboviral diseases in humans. These pests flourish in wet and warm<br />
conditions.<br />
Maintaining <strong>the</strong> floodplain in as natural a state as possible is key to mitigating for floods. The<br />
benefits of <strong>the</strong> floodplain are numerous. Natural floodplains provide many benefits for humans<br />
and natural systems. Each benefit contributes factors such as <strong>the</strong>y naturally store and convey<br />
floodwaters, maintain water quality, recharge groundwater and naturally regulate flows into<br />
rivers and lakes. They support large and diverse populations of plants and animals, and provide<br />
historical, scientific, recreational, and economical benefits to communities. Wyandotte County<br />
Lake is a great example in Region L of a floodplain that contributes natural habitat for plants and<br />
animals as well as recreational use for <strong>the</strong> community. This is a country lake located at <strong>the</strong><br />
3.121
northwest edge of Kansas City, Kansas. The 1,500 acres are positioned in a setting of hillside<br />
oak-hickory woodlands and lakeside sycamores. The 456 acre lake with marina was<br />
constructed in <strong>the</strong> 1930’s by <strong>the</strong> Works Progress Administration.<br />
Local Mitigation Concerns<br />
• Flooding concerns for <strong>the</strong> planning area are not solely affected by <strong>the</strong> wea<strong>the</strong>r in<br />
Kansas. As seen during <strong>the</strong> 2011 Missouri River Floods, events up stream can have<br />
significant impacts on downstream communities. Montana had an unprecedented<br />
snowfall and precipitation amount during <strong>the</strong> winter of 2010-2011, which caused flooding<br />
in Region L. Levee breaches and over topping occurred frequently during this event,<br />
affecting Leavenworth and Wyandotte Counties.<br />
• Flooding is a hazard that can also contribute to soil erosion, landslides and land<br />
subsidence. The impacts to transportation nodes, bridges, and industry along <strong>the</strong> rivers<br />
are also at risk during flooding events, which can affect lives and property.<br />
• Flooding concerns along Stranger Creek running North to South through <strong>the</strong> central part<br />
of Leavenworth county which affects <strong>the</strong> cities of Eason and Linwood. Economic<br />
development in this area is hampered due to flooding concerns.<br />
• Significant flood and erosion issues are present along Indian Creek in Ola<strong>the</strong>.<br />
• An issue in Johnson County is <strong>the</strong> upstream development impact on downstream<br />
flooding. Historically, development does not account for downstream impact which<br />
creates flooding issues w<strong>here</strong> before <strong>the</strong>re were none.<br />
• Flooding can contribute to contaminated waters, especially standing water that can<br />
cause public health concerns of infectious disease and bacterial illness. Cleanup of<br />
<strong>the</strong>se waters will require diligence also so that <strong>the</strong> responders are not infected.<br />
• Flooding issues on <strong>the</strong> Kansas River, in and around <strong>the</strong> DeSoto Bottoms can<br />
contaminate water wells that feed <strong>the</strong> Ola<strong>the</strong> Water production Center.<br />
Development in <strong>the</strong> Hazard Area<br />
Region L is <strong>the</strong> mostly densely populated area in Kansas, and is also <strong>the</strong> fastest growing. With<br />
that growth comes <strong>the</strong> need for more housing, businesses, health facilities, etc. Floodplain<br />
management practices must continue to be a priority to ensure that development is not<br />
occurring in areas at risk to flooding. All of <strong>the</strong> counties in Region L participate in <strong>the</strong> NFIP, so<br />
any development in <strong>the</strong> floodplain should be built according to its corresponding floodplain<br />
management ordinance. Additionally, <strong>the</strong> jurisdictions that participate in <strong>the</strong> NFIP and <strong>the</strong><br />
Community Rating System (CRS) periodically <strong>review</strong> <strong>the</strong>ir floodplain management programs.<br />
The Department of Agriculture, Division of Water Resources also conducts Community<br />
3.122
Assistance Contacts (CAC) which offer assistance to <strong>the</strong> participating communities and assess<br />
<strong>the</strong> floodplain program. Community Assistance Visits (CAV), which is similar to full audits, are<br />
also conducted by <strong>the</strong> Division of Water Resources in order to ensure communities are in<br />
compliance with <strong>the</strong> floodplain management program.<br />
Table 3.82. Johnson County CPRI: Flood<br />
Hazard Type Probability Magnitude<br />
Warning<br />
Time Duration CPRI<br />
Planning<br />
Significance<br />
Johnson County<br />
Flood 4 3 3 4 3.55 High<br />
Table 3.83. Leavenworth County CPRI: Flood<br />
Hazard Type Probability Magnitude<br />
Warning<br />
Time Duration CPRI<br />
Planning<br />
Significance<br />
Leavenworth County<br />
Flood 4 3 3 4 3.55 High<br />
Table 3.84. Wyandotte County CPRI: Flood<br />
Hazard Type Probability Magnitude<br />
Warning<br />
Time Duration CPRI<br />
Planning<br />
Significance<br />
Wyandotte County<br />
Flood 4 3 3 4 3.55 High<br />
3.123
Figure 3.26. Planning Region L Hazus One Percent Annual Chance Floodplains<br />
3.124
Figure 3.27, 3.28, and 3.29 show <strong>the</strong> DFIRM maps for Johnson, Leavenworth, and Wyandotte<br />
counties.<br />
Figure 3.27. Johnson County DFIRM<br />
Note:<br />
0 .2 % = up to <strong>the</strong> 500 year flood<br />
A = Area subject to inundation by a 100-year flood.<br />
AE = Areas subject to inundation by a 100-year flood as determined by detailed<br />
methods. Base Flood elevations are shown within <strong>the</strong>se zones.<br />
3.125
Figure 3.28. Leavenworth County DFIRM<br />
Note:<br />
0 .2 % = up to <strong>the</strong> 500 year flood<br />
A = Area subject to inundation by a 100-year flood.<br />
AE = Areas subject to inundation by a 100-year flood as determined by detailed<br />
methods. Base Flood elevations are shown within <strong>the</strong>se zones.<br />
3.126
Figure 3.29. Wyandotte County DFIRM<br />
Note:<br />
0 .2 % = up to <strong>the</strong> 500 year flood<br />
A = Area subject to inundation by a 100-year flood.<br />
AE = Areas subject to inundation by a 100-year flood as determined by detailed<br />
methods. Base Flood elevations are shown within <strong>the</strong>se zones.<br />
The following maps depict <strong>the</strong> special flood hazard areas for jurisdictions within <strong>the</strong> planning<br />
area.<br />
3.127
Johnson County<br />
Figure 3.30. DeSoto<br />
3.128
Figure 3.31. City of Merriam<br />
3.129
Figure 3.32. Cities of Mission, Mission Hills and Merriam<br />
3.130
Figure 3.33. Mission Woods<br />
3.131
Figure 3.34. City of Ola<strong>the</strong><br />
3.132
Figure 3.35. City of Overland Park<br />
3.133
Figure 3.36. City of Prairie Village<br />
3.134
Figure 3.37. City of Shawnee<br />
3.135
Figure 3.38. City of Westwood and Westwood Hills<br />
3.136
Figure 3.39. USD230<br />
3.137
Figure 3.40. USD231<br />
3.138
Figure 3.41. USD229<br />
3.139
Figure 3.42. Johnson County Community College<br />
3.140
Figure 3.43. University of Kansas, Edwards Campus<br />
3.141
Figure 3.44. University of Kansas Medical Center<br />
3.142
Leavenworth County:<br />
Figure 3.45. City of Basehor<br />
3.143
Figure 3.46. City of Easton<br />
3.144
Figure 3.47. City of Lansing<br />
3.145
Figure 3.48. City of Leavenworth<br />
3.146
Figure 3.49. City of Tonganoxie<br />
3.147
Figure 3.50. USD207 & USD453<br />
3.148
Figure 3.51. University of Saint Mary<br />
3.149
Figure 3.52. USD458<br />
3.150
Figure 3.53. USD449<br />
3.151
Figure 3.54. USD469<br />
3.152
Figure 3.55. USD453<br />
3.153
Figure 3.56. USD464<br />
3.154
Figure 3.57. University of Saint Mary<br />
3.155
Wyandotte County<br />
Figure 3.58. City of Kansas City, KS<br />
3.156
Figure 3.59. USD202<br />
3.157
Figure 3.60. USD203<br />
3.158
Figure 3.61. USD204<br />
3.159
Figure 3.62. USD500<br />
3.160
Figure 3.63. Kansas City Kansas Community College<br />
3.161
Figure 3.64. Kansas State School for <strong>the</strong> Blind<br />
3.162
Figure 3.65 RL Properties – Wyandotte County<br />
3.163
Consequence (Impact) Analysis<br />
The information in Table 3.85 provides <strong>the</strong> Consequence Analysis of Potential for Detrimental<br />
Impacts of Hazards done for accreditation with <strong>the</strong> Emergency Management Accreditation<br />
Program (EMAP).<br />
Table 3.85. EMAP Consequence Analysis: Flood<br />
Subject Ranking Impacts/Flood<br />
Health and Safety of Persons in <strong>the</strong><br />
Area of <strong>the</strong> Incident<br />
Severe<br />
Impact of <strong>the</strong> immediate area could be severe<br />
depending on <strong>the</strong> level of flood waters.<br />
Individuals fur<strong>the</strong>r away from <strong>the</strong> incident area are<br />
at a lower risk of being affected. Casualties are<br />
dependent on warning time.<br />
Responders Minimal Impact to responders is expected to be minimal<br />
unless responders live within <strong>the</strong> affected area.<br />
Continuity of Operations Minimal to Severe Temporary relocation may be necessary if<br />
inundation affects government facilities (minimal to<br />
severe).<br />
Property, Facilities, and<br />
Infrastructure<br />
Severe<br />
Localized impact could be severe in <strong>the</strong><br />
inundation area of <strong>the</strong> incident to facilities and<br />
infrastructure. The fur<strong>the</strong>r away from <strong>the</strong> incident<br />
area <strong>the</strong> damage lessens to minimal to moderate.<br />
Delivery of Services Minimal to Severe Delivery of services could be affected if <strong>the</strong>re is<br />
any disruption to <strong>the</strong> roads and/or utilities due to<br />
<strong>the</strong> flood waters (minimal to severe).<br />
Environment Severe Impact will be severe for <strong>the</strong> immediate impacted<br />
area. Impact will lessen as distance increases<br />
from <strong>the</strong> immediate incident area.<br />
Economic Conditions Minimal to Severe Impacts to <strong>the</strong> economy will greatly depend on <strong>the</strong><br />
area flooded, depth of water, and <strong>the</strong> amount of<br />
time it takes for <strong>the</strong> water to recede (minimal to<br />
severe).<br />
Public Confidence in Jurisdiction’s<br />
Governance<br />
Minimal to Severe<br />
Depending on <strong>the</strong> perception of whe<strong>the</strong>r <strong>the</strong> flood<br />
could have been prevented, warning time, and <strong>the</strong><br />
time it takes for response and recovery will greatly<br />
impact <strong>the</strong> public’s confidence (minimal to severe).<br />
3.164
3.2.10 Hailstorm<br />
Calculated Priority Risk Index<br />
2.50 Moderate<br />
Description<br />
Planning Significance<br />
Hail is precipitation that is formed when updrafts in thunderstorms carry raindrops upward into<br />
extremely cold areas of <strong>the</strong> atmosp<strong>here</strong> causing <strong>the</strong>m to freeze. The raindrops form into small<br />
frozen droplets and <strong>the</strong>n continue to grow as <strong>the</strong>y come into contact with super-cooled water<br />
which will freeze on contact with <strong>the</strong> frozen rain droplet. This frozen rain droplet can continue to<br />
grow and form hail. As long as <strong>the</strong> updraft forces can support or suspend <strong>the</strong> weight of <strong>the</strong><br />
hailstone, hail can continue to grow. When <strong>the</strong> updraft can no longer support <strong>the</strong> hailstone, it<br />
will fall down to <strong>the</strong> earth. For example, a ¼” diameter or pea sized hail requires updrafts of 24<br />
mph, while a 2 ¾” diameter or baseball sized hail requires an updraft of 81 mph.<br />
Hailstorms can cause damage to property, crops and <strong>the</strong> environment and kill and injure<br />
livestock. Because of <strong>the</strong> agricultural footprint in <strong>the</strong> planning area, crop damage and livestock<br />
losses due to hail are of concern. Even relatively small hail can shred plants to ribbons in a<br />
matter of minutes. Vehicles, roofs of buildings and homes, and landscaping are o<strong>the</strong>r concerns<br />
most commonly damaged by hail. Hail has been known to cause injury to humans, occasionally<br />
fatal injury.<br />
Based on information provided by <strong>the</strong> Tornado and Storm Research Organization, Table 3.86<br />
below describes typical damage impacts of <strong>the</strong> various sizes of hail.<br />
Table 3.86. Tornado and Storm Research Organization Hailstorm Intensity Scale<br />
Intensity<br />
Category<br />
Diameter<br />
(mm)<br />
Diameter<br />
(inches) Size Description Typical Damage Impacts<br />
Hard Hail 5-9 0.2-0.4 Pea No damage<br />
Potentially<br />
Damaging 10-15 0.4-0.6 Mothball Slight general damage to plants, crops<br />
Significant 16-20 0.6-0.8 Marble, grape Significant damage to fruit, crops, vegetation<br />
Severe 21-30 0.8-1.2 Walnut<br />
Severe damage to fruit and crops, damage to<br />
glass and plastic structures, paint and wood<br />
scored<br />
Pigeon's egg > Widespread glass damage, vehicle bodywork<br />
Severe 31-40 1.2-1.6<br />
Destructive 41-50 1.6-2.0<br />
squash ball<br />
Golf ball > Pullet's<br />
egg<br />
Destructive 51-60 2.0-2.4 Hen's egg<br />
Tennis ball ><br />
Destructive 61-75 2.4-3.0 cricket ball<br />
Large orange ><br />
Destructive 76-90 3.0-3.5 Soft ball<br />
Super<br />
Hailstorms 91-100 3.6-3.9 Grapefruit<br />
Super<br />
Hailstorms >100 4.0+ Melon<br />
damage<br />
Wholesale destruction of glass, damage to tiled<br />
roofs, significant risk of injuries<br />
Bodywork of grounded aircraft dented, brick<br />
walls pitted<br />
Severe roof damage, risk of serious injuries<br />
Severe damage to aircraft bodywork<br />
Extensive structural damage. Risk of severe or<br />
even fatal injuries to persons caught in <strong>the</strong> open<br />
Extensive structural damage. Risk of severe or<br />
even fatal injuries to persons caught in <strong>the</strong> open<br />
3.165
Location<br />
Hail can happen anyw<strong>here</strong> within Region L. The planning area consists of agricultural and<br />
urban landscapes, each being vulnerable in <strong>the</strong>ir own way. The agricultural areas of <strong>the</strong><br />
planning area are vulnerable in terms of crops and livestock, directly affecting farmer’s<br />
economic outlook. The urban areas are vulnerable in terms of people, infrastructure, and<br />
buildings.<br />
Between <strong>the</strong> years 2000 and 2012, <strong>the</strong> hail events in Region L have been considerable. The<br />
following table shows <strong>the</strong> events by county for <strong>the</strong> period 2000-2012.<br />
Table 3.87. Hail Events by County in Region L<br />
County Event (#)<br />
Johnson 247<br />
Leavenworth 188<br />
Wyandotte 63<br />
Total 498<br />
Source: National Climatic Database<br />
Previous Occurrences<br />
Due to <strong>the</strong> large number of hail events in <strong>the</strong> planning area since <strong>the</strong> last plan updates, <strong>the</strong><br />
following occurrences are a sample taken from <strong>the</strong> past few years that reflect <strong>the</strong> extent of hail<br />
occurrences in Region L.<br />
• Jun 2009 - Severe thunderstorms produced several reports of large hail. This was<br />
during <strong>the</strong> evening hours of June 9, 2009, as a cold front pushed through <strong>the</strong> area.<br />
Several cities in <strong>the</strong> planning area reported up to 1.75 inch in diameter hail.<br />
• April 2010 - Severe thunderstorms brought large hail and damaging winds to <strong>the</strong> area,<br />
during <strong>the</strong> morning hours of April 30, 2010 in Leavenworth and Wyandotte Counties.<br />
Hail was reported at some locations as 1.50 inches in diameter.<br />
• Sep 2010 - A warm and unstable airmass was located over <strong>the</strong> region, during <strong>the</strong><br />
afternoon and evening hours of September 18, 2010. A cold front moved sou<strong>the</strong>ast<br />
across <strong>the</strong> Leavenworth area in <strong>the</strong> afternoon and evening hours. T<strong>here</strong> were numerous<br />
reports of hail up to 1.75 inches in diameter.<br />
• Aug 2011 - The storms formed along a boundary of very warm temperatures in <strong>the</strong><br />
Sou<strong>the</strong>rn Plains, and cooler temperatures in <strong>the</strong> Mid-Missouri River valley. A developing<br />
cluster of storms over east central Kansas rapidly transitioned into a wind producing<br />
MCS, as it approached and crossed <strong>the</strong> Kansas City metro. However, ahead of this<br />
complex, a very strong storm dropped south out of Nebraska, and produced extreme hail<br />
up to <strong>the</strong> size of 4.5 inches in <strong>the</strong> cities of Easton and Leavenworth. This storm however<br />
decreased in intensity as it entered Kansas City, setting <strong>the</strong> stage for <strong>the</strong> strong wind<br />
producing MCS in east central Kansas to become <strong>the</strong> main threat. Measured wind<br />
3.166
Extent<br />
speeds between 60 and 80 mph, raced through extreme eastern Kansas, causing<br />
additional tree and power line damage leading to power outages.<br />
• May 2012 - A cold front moved sou<strong>the</strong>ast across <strong>the</strong> area, during <strong>the</strong> afternoon through<br />
evening hours, of May 6, 2012. The front produced scattered thunderstorms, with a|few<br />
becoming severe. T<strong>here</strong> were numerous reports in Johnson County of hail up to 1 inch,<br />
along with two reported tornadoes.<br />
• Aug 2012 - A cold front brought severe thunderstorms to portions of extreme eastern<br />
Kansas, during <strong>the</strong> late afternoon and evening hours of August 8, 2012. Hail was<br />
reported as up to 1 inch in diameter<br />
Hail is a common occurrence across <strong>the</strong> planning area, specifically in <strong>the</strong> spring and summer<br />
months. The severity of <strong>the</strong> incidence is tied to <strong>the</strong> size of <strong>the</strong> hail, and <strong>the</strong> location of <strong>the</strong><br />
event. The planning committee has determined that <strong>the</strong> magnitude of this hazard is negligible.<br />
Injuries and/or injuries could be treated with first aid, and less than 10% of property would be<br />
severely damaged.<br />
Probability of Future Events<br />
According to <strong>the</strong> National Climatic Data Center Storm Events, <strong>the</strong>re were 498 hail events in <strong>the</strong><br />
planning area between <strong>the</strong> years 2000 and 2012 (12 years). Based on this information, <strong>the</strong><br />
probability of at least one hail event in any given year in Region L is “Highly Likely”.<br />
Impact and Vulnerability<br />
Severe thunderstorms and associated hail events will continue to cause damage to anything<br />
and everything exposed to <strong>the</strong> wea<strong>the</strong>r elements. To determine potential financial loss<br />
estimates to hail in Region L, <strong>the</strong> available historical loss data was annualized. In <strong>the</strong> case of<br />
frequently occurring wea<strong>the</strong>r-related hazards such as hail, annualized historical loss data is<br />
considered to be <strong>the</strong> best resource for determining future potential losses. The planning team<br />
obtained loss data for <strong>the</strong> National Climatic Data Center (NCDC) storm events (2006 – 2012)<br />
and <strong>the</strong> USDA Risk Management Agency insured crop loss payments (2002 – 2011) since<br />
agriculture plays such as important role in <strong>the</strong> various sectors of Region Ls economy.<br />
According to this data, in <strong>the</strong> past 12 years <strong>the</strong>re have been 498 hail events in <strong>the</strong> Region, with<br />
an average of 41.5 events per year. Because this data was based on each county’s data, one<br />
hail event could be included three times; one for each county. Loss estimates are difficult to<br />
provide because so much of it is private insurance and not available for this plan. However,<br />
Region L saw annualized property damages between 2006 and 2012 at $265,357, and crop<br />
insurance paid for <strong>the</strong> same time period at $6,633 for <strong>the</strong> planning area.<br />
All 3 counties in <strong>the</strong> planning area are vulnerable to hailstorms. The statistical analysis method<br />
was used to refine and assess <strong>the</strong> relative vulnerability of each of <strong>the</strong>se counties to hail. Ratings<br />
were assigned to pertinent factors that were examined at <strong>the</strong> county level. These factors are:<br />
social vulnerability index, prior events, prior annualized property damage, building exposure<br />
3.167
valuation, population density, crop exposure and annualized insured crop loss. Then a rating<br />
value of 1-10 was assigned to <strong>the</strong> data obtained for each factor and <strong>the</strong>n weighted equally and<br />
factored toge<strong>the</strong>r to obtain overall vulnerability scores for comparison and to determine <strong>the</strong> most<br />
vulnerable counties.<br />
The following are <strong>the</strong> data sources for <strong>the</strong> rating factors: Social Vulnerability Index for <strong>the</strong><br />
counties from <strong>the</strong> Hazards and Vulnerability Research Institute at <strong>the</strong> University of South<br />
Carolina, National Climatic Data Center (NCDC) storm events (2006 – 2012), U.S. Census<br />
Bureau (2010), USDA’s Census of Agriculture (2007) and USDA Risk Management Agency<br />
(2002 – 2011). Please note that <strong>the</strong> data on crop losses only applies to insured crops.<br />
According to <strong>the</strong> 2011 Kansas Crop Insurance Profile Report issued by <strong>the</strong> USDA Risk<br />
Management Agency 82 percent of Kansas’ row crops were insured in 2011.<br />
It was determined that since hail is a common occurrence in <strong>the</strong> region, that using historical<br />
events and property damages from 2006 forward provides adequate events to describe <strong>the</strong> hail<br />
hazard in Kansas.<br />
Table 3.88 provides <strong>the</strong> data obtained for each of <strong>the</strong> factors by county. Table 3.89 that follows<br />
provides <strong>the</strong> ranges that were used to determine <strong>the</strong> resulting ratings.<br />
3.168
Table 3.88. Vulnerability of Kansas Counties Factor Amounts for Hail<br />
County<br />
So VI Rating (1-5)<br />
Prior Events 2006<br />
– 2012<br />
Property<br />
Damages<br />
Annualized<br />
Property<br />
Damages<br />
Total Building<br />
Exposure ($1000)<br />
Population<br />
Denstiy<br />
Crop Exposure<br />
(2007 Census of<br />
Agriculture)<br />
Crop Insurance<br />
Paid for Hail<br />
Annualized Crop<br />
Insurance paid<br />
Johnson 1 132 $1,020,000 $145,714 $43,871,468 1,149.60 $29,472,000 $28,592 $2,859<br />
Leavenworth 1 107 $362,000 $51,714 $4,877,783 164.7 $20,983,000 $37,737 $3,774<br />
Wyandotte 3 29 $475,500 $67,929 $12,066,666 1,039.00 $0 $0 $0<br />
Total 268 $1,857,500 $265,357 $60,815,917 $50,455,000 $66,329 $6,633<br />
Note: The Census of Agriculture did not publish crop exposure inWyandotte County to avoid disclosure of individual operations. The following are <strong>the</strong> 1 – 10 ranges for <strong>the</strong> hail<br />
vulnerability factor ratings. The Social Vulnerability Index is in a range of 1- 5. To give Social Vulnerability Index <strong>the</strong> same weight as <strong>the</strong> o<strong>the</strong>r factors, <strong>the</strong> numbers were multiplied<br />
by two.<br />
3.169
Table 3.89. Ranges for Hail Vulnerability Factor Ratings<br />
Ratings<br />
Social<br />
Vulnerability<br />
NCDC Prior<br />
Events<br />
Annualized<br />
Property<br />
Damage<br />
Building<br />
Exposure<br />
Valuation<br />
1 18 - 55 0 - $10,000<br />
$117,421 -<br />
$4,492,825<br />
1.6 -<br />
116.3 0 - $18,548,500 0 - $100,000<br />
2 1 56 - 90<br />
$10,001 -<br />
$50,000<br />
$4,492,826 -<br />
$8,868,229<br />
116.4 -<br />
231.1<br />
$18,548,501 -<br />
$32,126,000<br />
$100,001 -<br />
$300,000<br />
3 91 - 125<br />
$50,001 -<br />
$100,000<br />
$8,868,230 -<br />
$13,243,634<br />
231.2 -<br />
345.9<br />
$32,126,001 -<br />
$45,703,500<br />
$300,000 -<br />
$500,000<br />
4 2 126 - 160<br />
$100,001 -<br />
$300,000<br />
$13,243,635 -<br />
$17,619,039<br />
346 -<br />
460.7<br />
$45,703,501 -<br />
$59,281,000<br />
$500,001 -<br />
$700,000<br />
5 161 - 195<br />
$300,001 -<br />
$500,000<br />
$17,619,040 -<br />
$21,994,444<br />
460.8 -<br />
575.5<br />
$59,281,001 -<br />
$72,858,500<br />
$700,001 -<br />
$900,000<br />
6 3 196 - 230<br />
$500,001 -<br />
$700,000<br />
$21,994,445 -<br />
$26,369,848<br />
575.6 -<br />
690.3<br />
$72,858,501 -<br />
$86,436,000<br />
$900,001 -<br />
$1,100,000<br />
7 231 - 265<br />
$700,001 -<br />
$900,000<br />
$26,369,849 -<br />
$30,745,253<br />
690.4 -<br />
805.1<br />
$86,436,001 -<br />
$100,013,500<br />
$1,100,001 -<br />
$1,300,000<br />
8 4 266 - 300<br />
$900,001 -<br />
$1,100,000<br />
$30,745,254 -<br />
$35,120,658<br />
805.2 -<br />
919.9<br />
$100,031,501 -<br />
$113,591,000<br />
$1,300,001 -<br />
$1,700,000<br />
9 301 - 335<br />
$1,000,001 -<br />
$4,000,000<br />
$35,120,659 -<br />
$39,496,062<br />
920-<br />
1,034.7<br />
$113,591,001 -<br />
$127,168,500<br />
$1,700,001 -<br />
$2,100,000<br />
10 5 336 - 370<br />
$4,000,000 -<br />
$32,012,357<br />
$39,496,063 -<br />
$43,871,468<br />
1,034.8 -<br />
1,149.6<br />
$127,168,501 -<br />
$140,746,000<br />
$2,100,000 -<br />
$2,300,000<br />
Source: State Hazard Mitigation Plan. * Population density is <strong>the</strong> number of people per square mile.<br />
Population<br />
Density *<br />
Crop Exposure<br />
Annualized<br />
Crop Loss<br />
Table 3.90 provides <strong>the</strong> calculated ranges applied to determine <strong>the</strong> Low, Medium-Low, Medium,<br />
Medium-High and High vulnerable counties and Table 3.91 provides <strong>the</strong> seven rating values<br />
assigned that were considered in determining overall vulnerability to hail.<br />
Table 3.90. Ranges for Overall Hail Vulnerability<br />
Ranges Low Medium-Low Medium Medium-High High<br />
9 - 14 15 - 21 22 - 28 29 – 35 36 - 41<br />
Source: State Hazard Mitigation Plan<br />
3.170
Table 3.91. Vulnerability of Kansas Counties to Hail<br />
County<br />
SoVi Rating<br />
NCDC Prior<br />
Event Rating<br />
Annualized<br />
Property Damage<br />
Rating<br />
Bldg Exposure<br />
Valuation Rating<br />
Population<br />
Density Rating<br />
Mitigation Planning Region L<br />
Crop Exposure<br />
Rating<br />
Annualized Crop<br />
Loss Rating<br />
Overall<br />
Vulnerability<br />
Rating<br />
Johnson 2 4 4 10 10 2 1 33 Medium-High<br />
Leavenworth 2 3 3 2 2 2 1 15 Medium-Low<br />
Wyandotte 6 1 3 3 10 1 1 25 Medium<br />
Source: State Hazard Mitigation Plan 2013<br />
Hail Vulnerability<br />
Johnson County ranks 5 th in <strong>the</strong> State of Kansas for vulnerability to Hail. Leavenworth and<br />
Wyandotte did not make <strong>the</strong> top 10, however this does not negate <strong>the</strong> risk of this hazard that<br />
<strong>the</strong>y face as a normal occurrence.<br />
Severe thunderstorms and <strong>the</strong> associated hail events will continue to cause damage to anything<br />
and everything exposed to <strong>the</strong> wea<strong>the</strong>r elements, including people, crops, livestock, and<br />
structures.<br />
Summary<br />
The entire planning area is susceptible to hail, to include agricultural land, livestock, people, and<br />
property. Mitigating for hail is difficult because <strong>the</strong>re is no way to predict with 100% accuracy<br />
on when or w<strong>here</strong> it will happen.<br />
Local Mitigation Concerns<br />
• According to <strong>the</strong> Census of Agriculture, <strong>the</strong> planning area has 327,163 acres that is<br />
used for agricultural purposes. It is this agricultural footprint that has <strong>the</strong> potential to<br />
have an economic impact from hail damages sustained during a hail event. All <strong>the</strong><br />
counties within <strong>the</strong> Region are susceptible to this hazard, which is difficult to mitigate<br />
for when large areas of land are affected.<br />
• Region L has <strong>the</strong> highest incidence of growth in <strong>the</strong> state of Kansas. While buildings<br />
and people are relatively safe from hail events, <strong>the</strong> potential is <strong>the</strong>re for injuries or<br />
death related to this hazard, normally dependent on w<strong>here</strong> an individual is when an<br />
event occurs and <strong>the</strong> intensity of <strong>the</strong> event itself. Driving <strong>the</strong> transportation nodes, or<br />
playing golf can be dangerous pastimes if an individual is caught unaware during an<br />
event with 4.5 inch diameter hail, as seen on <strong>the</strong> previous occurrence of August<br />
2011 . Infrastructure and buildings can also see damage with large hail.<br />
Development in Hazard Prone Areas<br />
The increased level of new development is not as significant to hail damage as <strong>the</strong> agricultural<br />
losses. The economic result due to hail damage can reverberate throughout <strong>the</strong> local<br />
3.171
communities. Counties in <strong>the</strong> planning area that have <strong>the</strong> most farmland acreage will bear a<br />
larger loss than <strong>the</strong> counties that are mainly industrialized and business leaning. In <strong>the</strong> more<br />
urbanized counties such as Johnson and Wyandotte <strong>the</strong> impact is no less severe, just different.<br />
Nurseries, residential landscaping, and inner city landscaping improvements can take a heavy<br />
toll due to hail.<br />
Johnson County<br />
Table 3.92. Johnson County CPRI: Hail<br />
Hazard Type Probability Magnitude<br />
Warning<br />
Time Duration CPRI<br />
Planning<br />
Significance<br />
Johnson County<br />
Hail 4 1 2 1 2.50 Moderate<br />
Leavenworth County<br />
Table 3.93. Leavenworth County CPRI: Hail<br />
Hazard Type Probability Magnitude<br />
Warning<br />
Time Duration CPRI<br />
Planning<br />
Significance<br />
Leavenworth County<br />
Hail 4 1 2 1 2.50 Moderate<br />
Wyandotte County<br />
Table 3.94. Wyandotte County CPRI: Hail<br />
Hazard Type Probability Magnitude<br />
Warning<br />
Time Duration CPRI<br />
Planning<br />
Significance<br />
Wyandotte County<br />
Hail 4 1 2 1 2.50 Moderate<br />
Consequence (Impact) Analysis<br />
The information in Table 3.95 provides <strong>the</strong> Consequence Analysis of Potential for Detrimental<br />
Impacts of Hazards done for accreditation with <strong>the</strong> Emergency Management Accreditation<br />
Program (EMAP).<br />
3.172
Table 3.95. Consequence Analysis, Hail<br />
Subject Ranking Impacts/Hailstorm<br />
Health and Safety of<br />
Persons in <strong>the</strong> Area<br />
of <strong>the</strong> Incident<br />
Responders<br />
Continuity of<br />
Operations<br />
Property, Facilities,<br />
and Infrastructure<br />
Delivery of Services<br />
Environment<br />
Economic Conditions<br />
Public Confidence in<br />
Jurisdiction’s<br />
Governance<br />
Severe<br />
Minimal<br />
Minimal to<br />
Moderate<br />
Minimal to<br />
Severe<br />
Minimal to<br />
Severe<br />
Severe<br />
Minimal to<br />
Severe<br />
Minimal to<br />
Moderate<br />
Impact of <strong>the</strong> immediate area could be severe for<br />
affected areas and moderate to light for o<strong>the</strong>r less<br />
affected areas depending on whe<strong>the</strong>r individuals are<br />
caught outside during <strong>the</strong> event and size of hail.<br />
Impact to responders is expected to be non-existent to<br />
minimal.<br />
Temporary relocation may be necessary if government<br />
facilities experience damage (minimal to moderate).<br />
Localized impact could be severe to facilities and<br />
infrastructure in <strong>the</strong> incident area. Utility lines, roads,<br />
residential and business properties will be most affected.<br />
Delivery of services could be affected if <strong>the</strong>re is any<br />
disruption to <strong>the</strong> roads and/or utilities due to damages<br />
sustained (minimal to severe).<br />
Impact could be severe for <strong>the</strong> immediate impacted<br />
area, depending on <strong>the</strong> size of <strong>the</strong> event. Impact will<br />
lessen as distance increases from <strong>the</strong> immediate<br />
incident area.<br />
Local economy and finances may be adversely affected,<br />
depending on damages sustained (minimal to severe).<br />
Response and recovery will be in question if not timely<br />
and effective. Warning systems in place and <strong>the</strong><br />
timeliness of those warnings could be questioned<br />
(minimal to moderate).<br />
3.173
3.2.11. Hazardous Materials<br />
Calculated Priority Risk Index Planning Significance<br />
2.90 Moderate<br />
Description<br />
Hazardous <strong>material</strong>s and waste are a concern for Region L because a sudden accidental or<br />
intentional release (see Section 3.3.17 Terrorism/Agri-terrorism) of such <strong>material</strong>s can be<br />
dangerous to human health and safety, to property, and to <strong>the</strong> quality of <strong>the</strong> environment. Such<br />
releases may come from both fixed sources, such as a manufacturing or storage facility, or from<br />
a transportation source, such as a truck or pipeline. Accidental releases may be due to<br />
equipment failure, human error, or a natural or manmade hazard event.<br />
Generally, with a fixed facility, <strong>the</strong> hazards are pre-identified, and <strong>the</strong> facility is required by law<br />
to prepare a risk management plan and provide a copy to <strong>the</strong> local emergency planning<br />
committee (LEPC) and local fire departments.<br />
Agricultural facilities throughout <strong>the</strong> planning area are likely to have dangerous <strong>material</strong>s<br />
present that could pose a threat to surrounding populations in <strong>the</strong> event of an emergency or<br />
disaster. Facilities that store or use chemicals considered unusually dangerous to human safety<br />
are required by Section 112R of <strong>the</strong> Clear Air Act Amendments to assess <strong>the</strong> potential impacts<br />
of an accidental release of <strong>the</strong> chemical at <strong>the</strong>ir facility and to prepare risk management plans<br />
(RMP). Of particular interest to <strong>the</strong> Region and all of Kansas is that ammonia is one of <strong>the</strong><br />
covered hazardous <strong>material</strong>s. Numerous Kansas ammonia storage and distribution facilities<br />
have filed an RMP with <strong>the</strong> U.S. Environmental Protection Agency (EPA). A database with<br />
information about Kansas facilities that have RMPs is available through <strong>the</strong> EPA at<br />
www.rtknet.org/rmp/KS.php .<br />
Kansas has more subsurface hydrocarbon storage caverns than any o<strong>the</strong>r State (see Figure<br />
3.65 Total Subsurface Void Space by County).<br />
3.174
Figure 3.65. Total Subsurface Void Space by County (in acres) from<br />
Mining/Exploration/Storage.<br />
Source http://www.engg.ksu.edu/CHSR/outreach/tosnac/sites/docs/04.pdf and Kansas SHMP<br />
Location<br />
The primary agency responsible for hazardous <strong>material</strong>s within <strong>the</strong> State of Kansas is <strong>the</strong><br />
Kansas Department of Health and Environment, Division of Environment<br />
http://www.kdheks.gov/environment/index.html . The Kansas Response Plan, Emergency<br />
Support Function #10 – Oil and Hazardous Materials is ano<strong>the</strong>r resource for response<br />
information. (The Kansas Response Plan is not added as an appendix to this mitigation plan for<br />
security reasons.)<br />
Hazardous <strong>material</strong>s pose a threat to communities in all areas of <strong>the</strong> Region. Localities w<strong>here</strong><br />
hazardous <strong>material</strong>s are fabricated processed and stored as well as those w<strong>here</strong> hazardous<br />
waste is treated, stored and disposed of are most at risk for hazardous <strong>material</strong>s incidents.<br />
Additionally, localities along transportation corridors that carry <strong>the</strong>se <strong>material</strong>s to <strong>the</strong>ir final<br />
destinations are at risk.<br />
The planning committee considers <strong>the</strong> risk level from hazardous <strong>material</strong>s accidents to be<br />
moderate due to expanded development and industrialization of <strong>the</strong> Kansas City Metropolitan<br />
3.175
area. Generally, it is <strong>the</strong> developed areas or environmental resources in <strong>the</strong> immediate vicinity<br />
of facilities or transportation routes that would be at risk.<br />
Fixed Facility Locations<br />
In 2011, <strong>the</strong>re were 373 facilities housing hazardous chemicals in <strong>the</strong> planning area, identified<br />
by <strong>the</strong> Community Right to Know Act. The breakdown by counties can be seen in Table 3.96.<br />
Table 3.96. Number of Facilities Housing Hazardous Chemicals by County, 2011.<br />
County<br />
Number of Facilities<br />
Johnson 205<br />
Leavenworth 29<br />
Wyandotte 139<br />
Total 373<br />
Source: State Hazard Mitigation Plan<br />
Table 3.97 shows <strong>the</strong> U.S. Environmental Protection Agency Superfund sites in Region L. A<br />
Superfund site is an uncontrolled or abandoned place w<strong>here</strong> hazardous waste is located, which<br />
may affect local ecosystems and/or people. Two sites are currently on <strong>the</strong> Superfund National<br />
Priority list for <strong>the</strong> planning area. The proposed date and final date are <strong>the</strong> National Priority<br />
Listing history information.<br />
Table 3.97. Superfund National Priorities List Sites in Kansas<br />
National Priority<br />
City County Proposed Date Final Date<br />
Chemical Li t Sit Ola<strong>the</strong> Johnson 1/18/1994 5/31/1994<br />
C Doepke Disposal<br />
Johnson 12/30/1982 9/8/1993<br />
( Source: ) U.S. Environmental Protection Agency, http://www.epa.gov/region7/cleanup/index.htm<br />
Pipelines<br />
According to <strong>the</strong> U.S. Department of Transportation, Pipeline & Hazardous Materials Safety<br />
Administration’s Pipeline Safety Stakeholder Communications, Region L’s gas transmission line<br />
and hazardous liquid line mileage are seen in Table 3.98. All mileages are for 2010 and are<br />
approximate as some data sources may not have contained a complete record of pipeline<br />
mileage.<br />
3.176
Table 3.98. Gas Transmission Line and Hazardous Liquid Line Mileage by Mitigation<br />
Planning Region and County.<br />
County Gas Miles Liquid Miles Percent of Total<br />
Mitigation Planning Region L<br />
Johnson 232 120 1.40%<br />
Leavenworth 106 134 0.90%<br />
Wyandotte 66 155 0.80%<br />
Subtotal 404 409<br />
Source: U.S. Department of Transportation, Pipeline & Hazardous Materials Safety Administration<br />
http://primis.phmsa.dot.gov/comm/reports/safety/KS_detail1.html?nocache=3112#_OuterPanel_tab_6<br />
Figure 3.66 shows <strong>the</strong> locations of <strong>the</strong> Region’s gas and petroleum lines. Figure 3.67 reflects<br />
<strong>the</strong> transportation Routes in <strong>the</strong> Region.<br />
3.177
Figure 3.66 Region L’s Gas Transmission and Petroleum Lines<br />
3.178
Figure 3.67 Region L’s Transportation Routes<br />
3.179
Previous Occurrences<br />
When viewed statewide, hazardous <strong>material</strong>s accidents are frequent events. Annualized<br />
statistics from <strong>the</strong> Kansas Division of Emergency Management, Technological Hazards Section<br />
in Table 3.99 indicates <strong>the</strong> number of statewide incidents at <strong>the</strong> primary locations of fixed<br />
facility, motor carrier, pipeline and rail during <strong>the</strong> 10-year period of 2003-2012. The largest<br />
number of incidents occurred at fixed facilities during this timeframe.<br />
The spiller is responsible to report to all <strong>the</strong> appropriate agencies depending on <strong>the</strong> <strong>material</strong> and<br />
volume spilled. To satisfy <strong>the</strong> requirement of Kansas Regulation K.A.R. 28-48 all spills that<br />
impact <strong>the</strong> soils or waters must be reported to <strong>the</strong> KDHE or in <strong>the</strong> case that it originates from an<br />
oil or gas production leases, be reported to <strong>the</strong> Kansas Corporation Commission.<br />
If <strong>the</strong> release is not contained, or threatens <strong>the</strong> health or safety of <strong>the</strong> local population, <strong>the</strong> Local<br />
Emergency Planning Committee (LEPC) within <strong>the</strong> county of <strong>the</strong> release, must be notified first<br />
by dialing 911. Hazardous <strong>material</strong>s spills and air releases that meet federal reportable<br />
quantities and oil and petroleum spills over 110 gallons must also be reported to KDEM<br />
Table 3.99. Primary Locations of Hazardous Materials Incidents, 2003-2012<br />
Year<br />
Fixed<br />
Facility<br />
Motor<br />
Carrier Pipeline Rail<br />
2003 323 69 61 2<br />
2004 597 35 47 6<br />
2005 399 29 26 10<br />
2006 248 31 24 11<br />
2007 267 21 26 6<br />
2008 200 47 21 5<br />
2009 242 56 22 19<br />
2010 217 64 20 18<br />
2011 173 31 29 12<br />
2012 165 38 20 19<br />
Total 2,831 421 296 108<br />
10-year<br />
average 283.1 42.1 29.6 10.8<br />
Source: Kansas Division of Emergency Management, Technological Hazards Section<br />
Table 3.100 shows that <strong>the</strong> major cause of hazardous <strong>material</strong> incidents in Kansas was<br />
equipment failure for incidents from 2003-2012.<br />
3.180
Table 3.100. Causes of Hazardous Materials Incidents in Kansas, 2003-2012<br />
Year Explosion Fire Spill<br />
Equipment<br />
Failure<br />
Operator<br />
Error Natural Dumping O<strong>the</strong>r<br />
2003 6 14 194 191 29 6 2 51<br />
2004 5 10 58 355 31 2 1 315<br />
2005 1 5 49 181 21 2 6 0<br />
2006 0 3 46 214 18 1 3 89<br />
2007 1 6 41 238 13 3 0 94<br />
2008 3 7 59 168 27 9 1 110<br />
2009 1 7 142 207 25 14 4 112<br />
2010 2 7 234 120 20 2 2 105<br />
2011 1 6 154 91 10 3 2 21<br />
2012 1 8 153 69 23 1 3 94<br />
Total 21 73 1130 1834 217 43 24 991<br />
10-year<br />
Average 2.1 7.3 113 183.4 21.7 4.3 2.4 99.1<br />
Source: Kansas Division of Emergency Management, Technological Hazards SectionManaging <strong>the</strong> Risk: 2011 Kansas Commission<br />
on Emergency Planning and Response Annual Report, shows <strong>the</strong> number of hazardous <strong>material</strong> releases reported to all three<br />
Kansas agencies of Kansas Division of Emergency Management (KDEM), <strong>the</strong> Kansas Department of Health and Environment<br />
(KDHE) and <strong>the</strong> Kansas Corporation Commission (KCC). The 2011 Annual Report can be viewed at<br />
http://www.kansastag.gov/advhtml_doc_upload/2011%20managing%20<strong>the</strong>%20risk.pdf<br />
U.S. Department of Transportation’s Pipeline & Hazardous Materials Safety<br />
Administration<br />
Reports from <strong>the</strong> U.S. Department of Transportation’s Pipeline & Hazardous Materials Safety<br />
Administration’s provides detail and incident history for <strong>the</strong> pipeline systems in <strong>the</strong> State of<br />
Kansas between 2001 and 2012. Significant incidents are those incidents reported by pipeline<br />
operators with any of <strong>the</strong> following conditions met: 1) fatality or injury requiring in-patient<br />
hospitalization; 2) $50,000 or more in total costs, measured in 1984 dollars; 3) highly volatile<br />
liquid releases of five barrels or more or o<strong>the</strong>r liquid releases of 50 barrels or more; 4) liquid<br />
releases resulting in an unintentional fire or explosion. According to <strong>the</strong>se reports, <strong>the</strong>re were<br />
147 pipeline incidents that caused four fatalities, 24 injuries and $69.5 million in damages over<br />
<strong>the</strong> 12 year period (2001-2012). Table 3.101 gives <strong>the</strong> incident details by county for <strong>the</strong> Region<br />
3.181
Table 3.101. Details of Kansas Pipeline Incidents by Mitigation Planning Region and<br />
County, 2001-2012<br />
Total Natural<br />
Gas<br />
Transmission<br />
Incidents<br />
Total Natural<br />
Gas Distribution<br />
Incidents<br />
Total Hazardous<br />
Liquid Incidents<br />
Total Fatalities<br />
County<br />
Mitigation Planning Region L<br />
Johnson 3 1 1 0 0 $1,897,704 258 196<br />
Leavenworth 1 0 0 0 1 $80,160 0 0<br />
Wyandotte 2 0 7 1 3 $14,724,798 6,800 5,089<br />
Total 6 1 8 1 4 $16,702,662 7,058 5,285<br />
Source: U.S. Department of Transportation, Pipeline & Hazardous Materials Safety Administration,<br />
http://primis.phmsa.dot.gov/comm/reports/safety/IncDetSt_st_KS_flt_sig.html?nocache=999#_all<br />
Notes: The costs shown are in 2011 dollars. For years 2002 and later, property damage is estimated as <strong>the</strong> sum of all public and<br />
private costs reported in <strong>the</strong> 30-day incident report. For years prior to 2002, accident report forms did not include a breakdown of<br />
public and private costs so property damage for <strong>the</strong>se years is reported total property damage field in <strong>the</strong> report.<br />
Total Injuries<br />
Total Damage<br />
Gross Barrels<br />
Lost<br />
Total Barrels<br />
Recovered<br />
Notable Hazardous Materials Incidents<br />
• 15 Feb 2010 a fuel tanker spill near <strong>the</strong> 18 th expressway & Kansas in Kansas City,<br />
Kansas. 800 gallong of gasoline flowed into <strong>the</strong> storm sewer in Wyandotte County.<br />
• 16 Feb 2010 an oil lease spill of 4000 gallons of crude oil in a rural area threatening<br />
waterways in Leavenworth County.<br />
• 15 Jul 2012 a fuel tanker truck wrecked in a ditch near I-435 and State Line, Overland<br />
Park. 2000 gallons of diesel fuel spilled causing road closures.<br />
Table 3.101a. Total Hazardous Spill Incidents in Region L from 2010 – 2013.<br />
County 2010 2011 2012<br />
2013 (Jan –<br />
Mar)<br />
Johnson 45 57 56 7<br />
Leavenworth 11 5 8 0<br />
Wyandotte 51 35 52 15<br />
Total 107 97 116 22<br />
Source: Kansas Division of Emergency Management, Tech Hazards<br />
Extent<br />
The extent of a Hazardous Material incident would depend greatly on <strong>the</strong> type of Hazardous<br />
Material, <strong>the</strong> location, and <strong>the</strong> amount of <strong>material</strong> that is released. Due to <strong>the</strong> variables of this<br />
hazard, <strong>the</strong> planning committee has determined that this hazard would have a<br />
magnitude/severity of negligible. The event would not result in injuries or illness that could not<br />
be treated by first aid, and less than 10% of property would be affected.<br />
3.182
Probability<br />
The release of hazardous <strong>material</strong>s, whe<strong>the</strong>r through accidental spills, human error, or o<strong>the</strong>r<br />
etiology is not in and of itself uncommon in <strong>the</strong> planning area. Minor occurrences happen fairly<br />
frequently. Precautions, laws, regulations, and checklist are all utilized to avoid this hazard,<br />
however <strong>the</strong>y continue to happen. During <strong>the</strong> last three full years, 2010 – 2012, <strong>the</strong>re were 320<br />
hazardous spill incidents in <strong>the</strong> planning area. This results in a 100% chance of this hazard<br />
occurring in any given year. The planning committee has assigned this hazard a probability of<br />
“Highly Likely.”<br />
Impact and Vulnerability<br />
Table 3.102 lists <strong>the</strong> number of hazardous <strong>material</strong>s incidents, injuries, fatalities and people<br />
evacuated from <strong>the</strong> public and facilities by county in <strong>the</strong> Region over <strong>the</strong> 10-year period of 2003-<br />
2012. T<strong>here</strong> were a total of 361 incidents reported to KDEM<br />
Table 3.102. Reported Number of Hazardous Materials incidents, Injuries, Fatalities and<br />
People Evacuated by County, 2003-2012<br />
Incident County Incidents Injuries Fatalities People Evacuated<br />
Mitigation Planning Region L<br />
Johnson 96 4 0 81<br />
Leavenworth 50 49 3 152<br />
Wyandotte 215 6 0 87<br />
Total 361 59 3 320<br />
Source: Kansas Division of Emergency Management, Technological Hazards Section<br />
***THE FOLLOWING HYPOTHETICAL SCENARIO IS FOR INSTRUCTIONAL AND<br />
ILUSTRATIVE PURPOSES ONLY****<br />
The impact of this type of disaster will likely be localized to <strong>the</strong> immediate area surrounding <strong>the</strong><br />
incident. The initial concern will be for people and <strong>the</strong>n <strong>the</strong> environment. If contamination<br />
occurs, <strong>the</strong> spiller is responsible for <strong>the</strong> cleanup actions and will work close with local<br />
responders, KDHE, KCC, KDEM, and EPA to ensure that cleanup is done safely and in<br />
accordance with federal and state laws.<br />
As mentioned, it is difficult to determine <strong>the</strong> potential losses to existing development because of<br />
<strong>the</strong> variable nature of a hazardous <strong>material</strong>s spill. For example, a spill of a toxic airborne<br />
chemical in a populated area could have great potential for loss of life and by contrast, <strong>the</strong> spill<br />
of a very small amount of a chemical in a rural agricultural area would be much less costly and<br />
possible limited to remediation of soil.<br />
For discussion purposes, <strong>the</strong> <strong>material</strong>s needed for a spill at a fixed facility at an easily<br />
remediated area are listed below in Table 3.103. The costs for <strong>the</strong> cleanup are estimated from<br />
<strong>the</strong> current State of Kansas Unified HazMat Response Program statewide contract # 35167.<br />
3.183
Table 3.103 Potential Cost Estimate for HAZ-MAT Spill Remediation<br />
Classification Rates Per Hour/Unit Number of Hours/Units Total Cost<br />
Project Manager $90.00 24 $2,160<br />
Health & Safety Supervisor $86.00 24 $2,064<br />
Environmental Tech $50.00 12 $600<br />
Foreman $55.00 24 $1,320<br />
Equipment Operator $56.50 24 $1,356<br />
Laborer $45.00 24 $1,080<br />
Truck, 4 wheel drive $680/wk 1 $680<br />
Backhoe, Case 416B $320.00/day 2 $640<br />
Forklift, 3 ton all terrain $160.00/day 2 $320<br />
Skimmer $250.00/day 2 $500<br />
Pump, 4” $80.00/day 3 $240<br />
Drums, chemical, 17H or 17E $90.00 25 $2,250<br />
Drums, 95 gallon $295.00 25 $7,375<br />
Vermiculite per bag $15.00 6 $90<br />
Acid Suits $70.00/each 6 $420<br />
Gloves $4.00/pair 30 $120<br />
Total $21,215<br />
Source: State of Kansas Unified HazMat Response Program statewide contract # 35167.<br />
According to <strong>the</strong> Kansas Division of Emergency Management, Technological Hazards Section<br />
<strong>the</strong>re are 7 facilities subject to <strong>the</strong> Risk Management Plan requirements in <strong>the</strong> planning area as<br />
of December 2012. The top ranked facilities for Region L are listed in Table 3.104 and are<br />
ranked based on population affected according to <strong>the</strong> Risk Management Plan’s Worst Case<br />
Scenario. It is interesting to note that statewide, Wyandottoe has <strong>the</strong> 2 nd most worst case<br />
scenario facilities, following Sedgwick County who is first with 7. Information concerning <strong>the</strong>se<br />
facilities is limited in this plan because of security and liability issues.<br />
Table 3.104. Top Ranked Worst Case Scenario Facilities in Kansas, 2012<br />
Mitigation Planning<br />
Region County Type of Facility<br />
L Wyandotte Chemical Production and Processing<br />
L Wyandotte Specialty Gas<br />
L Wyandotte Water Treatment<br />
L Wyandotte Refrigerated Warehouse<br />
L Johnson Refrigerated Warehouse & Distribution<br />
L Johnson Food Manufacturing<br />
L Leavenworth Water Treatment<br />
Source: State Hazard Mitigation Plan<br />
Special populations are particularly vulnerable because of <strong>the</strong> in<strong>here</strong>nt potential difficulties<br />
involved in <strong>the</strong> evacuation should <strong>the</strong> necessity arise. Table 3.105 shows <strong>the</strong> number of special<br />
population facilities in each county that is located within ½ mile of a chemical facility.<br />
3.184
Table 3.105. Number of Special Population Facilities Within ½ Mile of a Chemical Facility<br />
County<br />
Health<br />
Facilities Colleges<br />
Educational<br />
Facilities<br />
Aging<br />
Facilities Child Care<br />
Correctional<br />
Institutions<br />
Mitigation Planning Region L<br />
Johnson 4 14 53 37 340 5<br />
Leavenworth 1 1 12 2 31 2<br />
Wyandotte 2 2 33 3 102 5<br />
Total 7 17 98 42 473 12<br />
Source: State Hazard Mitigation Plan<br />
Summary<br />
Region L is vulnerable to a Hazardous Material Incident due to its large industrial base in<br />
Kansas City area of Wyandotte County, its farmland footprint in Leavenworth County, and <strong>the</strong><br />
major transportation nodes that run through <strong>the</strong> planning area. Pipelines, railroads, highways,<br />
chemical plants and use of those chemicals are all issues that make Region L vulnerable. The<br />
initial concern during an incident is for <strong>the</strong> large amount of people that live in this Region, <strong>the</strong>n<br />
<strong>the</strong> environment.<br />
Local Mitigation Concerns<br />
• As mentioned in <strong>the</strong> vulnerability overview, <strong>the</strong> transportation nodes are a susceptible to<br />
a hazardous <strong>material</strong> incident. Whe<strong>the</strong>r due to transportation trucks carrying freight that<br />
is classified as hazardous <strong>material</strong>, railroad cars carrying potentially dangerous loads, or<br />
<strong>the</strong> waterways that have barges carrying freight subject to an incident. All are concerns<br />
that require a proactive approach.<br />
• Wyandotte County is 2 nd on <strong>the</strong> top 10 worst case scenario facilities list for <strong>the</strong> State of<br />
Kansas., with four facilities that have <strong>the</strong> potential to create a major hazardous incident.<br />
Added to this is <strong>the</strong>ir high industrial footprint that requires <strong>the</strong> use and storage of<br />
hazardous <strong>material</strong>s.<br />
• Gas and Petroleum pipelines are numerous within <strong>the</strong> Region, transporting highly<br />
flammable and toxic products throughout <strong>the</strong> area and state. A release, or fire, at any of<br />
<strong>the</strong>se locations could be catastrophic to <strong>the</strong> lives and property of individuals that live or<br />
travel near to any of <strong>the</strong>se areas. Individuals downwind could suffer repercussions also.<br />
• Millions of gallons of gas is stored underground in this Region. This storage is located<br />
under <strong>the</strong> Central West portion of <strong>the</strong> county from West of <strong>the</strong> county shop – south of<br />
Spring Dale, East of McLouth.<br />
• With <strong>the</strong> KU Cancer Center moving into Nor<strong>the</strong>ast Johnson County, and <strong>the</strong> Bio-Hazard<br />
Facility being built in Manhattan, KS, <strong>the</strong> interstate highway systems which run through<br />
Region L could be at an increased risk of a hazardous <strong>material</strong> spill, sometimes of<br />
unknown etiology.<br />
3.185
• An area of concern for <strong>the</strong> Region is <strong>the</strong> lack of state enforcement related to nonreporting<br />
of disease. When a communicable disease is suspected in a patient, not all<br />
physicians report in a timely manner, reducing/limiting response to <strong>the</strong> potential<br />
outbreak.<br />
Development in Hazard prone Areas<br />
As <strong>the</strong> infrastructure and population of Region L increases, along with <strong>the</strong> number and type of<br />
hazardous chemicals stored and transported through <strong>the</strong> area, <strong>the</strong> amount of potential losses<br />
will increase.<br />
Johnson County<br />
Table 3.106. Johnson County CPRI: Hazardous Materials<br />
Hazard Type Probability Magnitude<br />
Warning<br />
Time Duration CPRI<br />
Planning<br />
Significance<br />
Johnson County<br />
Hazardous Materials 4 1 4 2 2.90 Moderate<br />
Leavenworth County<br />
Table 3.107. Leavenworth County CPRI: Hazardous Materials<br />
Hazard Type Probability Magnitude<br />
Warning<br />
Time Duration CPRI<br />
Planning<br />
Significance<br />
Leavenworth County<br />
Hazardous Materials 4 1 4 2 2.90 Moderate<br />
Wyandotte County<br />
Table 3.108. Wyandotte County CPRI: Hazardous Materials<br />
Hazard Type Probability Magnitude<br />
Warning<br />
Time Duration CPRI<br />
Planning<br />
Significance<br />
Wyandotte County<br />
Hazardous Materials 4 1 4 2 2.90 Moderate<br />
Consequence (Impact) Analysis<br />
This hazard could have a significant impact on <strong>the</strong> public health, <strong>the</strong> environment, private<br />
property and <strong>the</strong> economy. The impact of this type of disaster will likely be localized to <strong>the</strong><br />
immediate area surrounding <strong>the</strong> incident. The initial concern will be for people, <strong>the</strong>n <strong>the</strong><br />
environment. If contamination occurs, <strong>the</strong> spiller is responsible for <strong>the</strong> cleanup actions and will<br />
3.186
work closely with <strong>the</strong> KDHE, KDEM, KCC, EPA and <strong>the</strong> local jurisdiction to ensure that cleanup<br />
is done safely and in accordance with federal and state laws.<br />
The information in provides <strong>the</strong> Impact Analysis of Potential for Detrimental Impacts of Hazards<br />
done for accreditation with <strong>the</strong> Emergency Management Accreditation Program (EMAP).<br />
Table 3.109. EMAP Consequences Analysis: Hazardous Materials<br />
Subject Ranking Impacts/Hazardous Materials<br />
Severe<br />
Localized impact will be severe within <strong>the</strong><br />
plume/spill area, depending on <strong>the</strong> type of<br />
chemical/<strong>material</strong> released. As distance is<br />
increased from <strong>the</strong> plume area, <strong>the</strong> impact will<br />
become minimal to moderate.<br />
Health and Safety of Persons in <strong>the</strong><br />
Area of <strong>the</strong> Incident<br />
Responders Severe Impact to responders could be severe if not<br />
trained and properly equipped. Responders that<br />
are properly trained and equipped will have a<br />
minimal to moderate impact.<br />
Continuity of Operations Minimal to Severe Temporary relocation could be necessary if<br />
government facilities are in close proximity to <strong>the</strong><br />
incident area. This temporary relocation could<br />
become significant depending on clean-up<br />
(minimal to severe).<br />
Property, Facilities, and Infrastructure Minimal – Severe Impact is expected to be minimal for actual<br />
structural properties, facilities, and infrastructure.<br />
Unless it is accompanied by an igniting device in<br />
which case it could be severe.<br />
Delivery of Services Minimal to Severe Delivery of services could be affected within and<br />
around <strong>the</strong> plume/spill area (minimal to severe).<br />
Environment Severe Localized impact within <strong>the</strong> plume/spill area<br />
could be severe to native plants, wildlife and<br />
natural habitats. Clean up and remediation will<br />
be required.<br />
Economic Conditions Minimal to Severe Economic conditions could be adversely affected<br />
depending on whe<strong>the</strong>r agriculture is affected,<br />
what type of <strong>material</strong> is released, is <strong>the</strong> company<br />
a major employer, etc.<br />
Public Confidence in Jurisdiction’s<br />
Governance<br />
Minimal to Severe<br />
Impact will be dependent on whe<strong>the</strong>r or not <strong>the</strong><br />
release could have been avoided by government<br />
or non-government entities, clean-up and<br />
investigation times, and outcomes.<br />
3.187
3.2.12 Land Subsidence<br />
Calculated Priority Risk Index<br />
Description<br />
Planning Significance<br />
1.30 Low<br />
Subsidence is caused when <strong>the</strong> ground above manmade or natural voids collapses. Subsidence<br />
can be related to mine collapse, water and oil withdrawal, or natural causes such as shrinking of<br />
expansive soils, salt dissolution (which may also be related to mining activities), and cave<br />
collapses. The surface depression is known as a sinkhole. If sinkholes appear beneath<br />
developed areas, damage or destruction of buildings, roads and rails, or o<strong>the</strong>r infrastructure can<br />
result. The rate of subsidence, which ranges from gradual to catastrophic, correlates to its risk<br />
to public safety and property damage.<br />
The development of sinkhole and subsidence areas can be grouped into three major categories:<br />
1. Natural dissolution of soluble minerals, causing <strong>the</strong> development of sinkholes,<br />
2. Extraction of minerals by ei<strong>the</strong>r solution mining or shaft mining which leaves a void<br />
space w<strong>here</strong> subsidence can occur, and<br />
3. Downward drainage of fresh water, via a drill hole or unplugged oil or gas well which<br />
penetrates a soluble mineral formation and has an outlet for <strong>the</strong> solution cavity water to<br />
be disposed.<br />
Major <strong>material</strong>s or minerals present in Kansas that are associated with subsidence and sinkhole<br />
development include: salt, limestone and dolomite, gypsum, coal, lead and zinc.<br />
Underground limestone mines have contributed to a subsidence problem in <strong>the</strong> Kansas City<br />
metropolitan area, on <strong>the</strong> Missouri side.<br />
Location<br />
The planning area does have some areas of concern for this hazard, although it is not a wide<br />
spread hazard.<br />
The Kansas Department of Health and Environment in 2006 prepared a report on “Subsurface<br />
Void Space and Sinkhole/Subsidence Area Inventory for <strong>the</strong> State of Kansas.” The report<br />
inventoried subsurface void space from oil and gas exploration and production, natural sources,<br />
shaft mining, and solution mining. Because some areas were corrected <strong>the</strong> revised total void<br />
space inventory for all sources in <strong>the</strong> state is 119,136 acres. The distribution of total acres and<br />
major cause of void spaces are shown for each county in Figure 3.68. Additional information<br />
from this report is discussed in <strong>the</strong> Extent Section below.<br />
3.188
Figure 3.68. Total Subsurface Void Space by County (in acres)<br />
Source http://www.engg.ksu.edu/CHSR/outreach/tosnac/sites/docs/04.pdf<br />
3.189
Ano<strong>the</strong>r area of concern is karst; a terrain or type of topography generally underlain by soluble<br />
rocks, such as limestone, gypsum, and dolomite, in which <strong>the</strong> topography is chiefly formed by<br />
dissolving <strong>the</strong> rock, are also particularly prone to sinkholes.<br />
Figure 3.69 illustrates <strong>the</strong> location of karst features and features analogous to karst in Kansas.<br />
The green areas shown in <strong>the</strong> map show fissures, tubes, and caves generally less than 1,000<br />
feet long with 50 feet or less vertical extent in gently dipping to flat-lying carbonate rock. The<br />
planning area shows karst features in all three counties. T<strong>here</strong> are limited documented<br />
problems associated with natural limestone subsidence and sinkholes in Kansas. However,<br />
eastern Kansas has anthropogenic risk associated with limestone mines.<br />
Figure 3.69. Karst Features in Kansas<br />
Previous Occurrences<br />
The following map shows one-mile square sections of land in <strong>the</strong> eastern side of <strong>the</strong> state<br />
w<strong>here</strong> sinkhole locations have been documented in writing. Red indicates sinkhole occurrences<br />
and yellow indicates springs. Region L, indicated by LV, WY, and JO show that Wyandotte and<br />
Johnson County have had documented sinkhole locations.<br />
3.190
Figure 3.70. Sinkholes in Eastern Kansas<br />
Records maintained by KDHE, indicate that $1,144.39 has been spent in Leavenworth County<br />
during <strong>the</strong> years that records were available for <strong>the</strong> Abandoned Mine Land Program. Historical<br />
costs capture only <strong>the</strong> remediation costs eligible for KDHE’s programs. The potential for o<strong>the</strong>r<br />
structural damage and economic impacts exists for all counties that have subsurface void<br />
spaces.<br />
The Kansas Department of Health and Environment’s Surface Mining Section is <strong>the</strong> agency<br />
responsible for <strong>the</strong> reclamation of abandoned coal mines in Kansas under <strong>the</strong> Surface Mining<br />
and Control Reclamation Act of 1977 (P.L. 95-87). Federal funds are available through <strong>the</strong><br />
office of Surface Mining Reclamation and Enforcement for <strong>the</strong> reclamation of past mining<br />
problems which are hazardous to <strong>the</strong> health, safety, and general welfare of <strong>the</strong> public. The<br />
Abandoned Mine Land (AML) Program receives reports yearly on coal mine subsidence alone.<br />
KDHA provided <strong>the</strong> following data:<br />
• Coal Subsidence Projects,<br />
3.191
• Coal Emergency Program Projects for <strong>the</strong> remediation of sites which are in immediate<br />
threat to <strong>the</strong> health and safety of <strong>the</strong> general public.<br />
The following Table shows <strong>the</strong> Coal Emergency Fund Expenditures from 1980 to October 2012<br />
for <strong>the</strong> state of Kansas.<br />
Table 3.110. Coal Emergency Fund Expenditures by County, 1980 to Oct. 2012)<br />
County # of projects cost<br />
Bourbon 9 $58,815<br />
Cherokee 734 $2,880,030<br />
Crawford 1851 $4,535,670<br />
Crawford/ck 1 $723<br />
Leavenworth 2 $37,765<br />
Linn 2 $0<br />
Neosho 1 $0<br />
Osage 3 $0<br />
Shawnee 1 $0<br />
Wabaunsee 3 $96,660<br />
Wyandotte 1 $0<br />
Total $7,609,662<br />
Source: State Hazard Mitigation Plan<br />
O<strong>the</strong>r Notable Land Subsidence Events<br />
• 2010: Kansas City, MO. - Ramps to a major highway shut down because of a growing<br />
sinkhole in <strong>the</strong> pavement. I-470 westbound near <strong>the</strong> Three Trails Interchange is closed<br />
because of a partial collapse w<strong>here</strong> Westbound I-470 meets westbound I-435.<br />
• 1998–1999: Two medical buildings were damaged in Wyandotte County.<br />
• 1965–1966: Subsidence over abandoned limestone mines in Wyandotte County damaged<br />
roads and destroyed houses.<br />
Extent<br />
Magnitude: Negligible. Less than 10% of property is severely damaged and <strong>the</strong> shutdown of<br />
critical facilities and services would not exceed 24 hours.<br />
Probability of Future Events<br />
Based on historical records, <strong>the</strong> planning region is “Unlikely” to have an event happen within a<br />
10 year window.<br />
Impact and Vulnerability<br />
The KDHE Abandoned Mine Land Program estimates <strong>the</strong>re are over 350 abandoned coal mine<br />
sites in <strong>the</strong> State of Kansas that alone identified with health and safety problems. While not all<br />
abandoned mines include subsidence issues it is a great concern.<br />
3.192
Records maintained by KDHE, indicate that of <strong>the</strong> counties in <strong>the</strong> planning area, Leavenworth<br />
County has been <strong>the</strong> recipient of <strong>the</strong> Abandoned Mine Land Programs with an annualized cost<br />
of $1,144.39. The following Table 3.)))))))) shows <strong>the</strong> counties in <strong>the</strong> state that have used this<br />
program to address <strong>the</strong>ir abandoned mines subsidence issues. The whole state is reflected to<br />
show a contrast and comparison model.<br />
Table 3.111. Annualized Cost for Abandoned Mine Land Programs by County<br />
Total<br />
County<br />
Annualized<br />
Bourbon $1,782.27<br />
Cherokee $270,223.64<br />
Crawford $158,760.55<br />
Crawford/Ck $21.91<br />
Leavenworth $1,144.39<br />
Wabaunsee $2,929.09<br />
Total $434,861.85<br />
Source: State Hazard Mitigation Plan<br />
The above annualized amounts of historical costs capture only <strong>the</strong> remediation costs eligible for<br />
KDHE’s programs. The potential for o<strong>the</strong>r structural damage and economic impacts exists for<br />
all counties that have subsurface void spaces. Damages will be more isolated in general<br />
compared to o<strong>the</strong>r hazards, but future disruptions to transportation and o<strong>the</strong>r infrastructure as<br />
well as structural damage are possible.<br />
To analyze vulnerability to land subsidence in <strong>the</strong> State, <strong>the</strong> November 2006 KDHE report<br />
entitled “Subsurface Void Space and Sinkhole/Subsidence Area Inventory for <strong>the</strong> State of<br />
Kansas” was fur<strong>the</strong>r studied for additional details about land subsidence vulnerability.<br />
In <strong>the</strong> report, subsidence areas are grouped into three categories as follows:<br />
• Category I: High Risk<br />
• Category II: Medium Risk<br />
• Category III: Low Risk<br />
All documented acres of subsurface void space were classified according to <strong>the</strong>se risk<br />
categories for each of <strong>the</strong> following causes of void space:<br />
• Lead and Zinc Mines<br />
• Coal Mines<br />
• Limestone Mines<br />
• Gypsum Mines<br />
• Salt Solution Mining<br />
• Rock Salt Mines<br />
• Hydrocarbon Storage Caverns<br />
3.193
With <strong>the</strong> known number of acres in each risk category for each county with documented<br />
subsurface void spaces, a weighted vulnerability calculation was completed. Acreage in risk<br />
Category I (High Risk) received a multiplier of three, acreage in risk Category II (Moderate Risk)<br />
received a multiplier of two and acreage in risk Category III (Low Risk) received a multiplier of<br />
one. Table 3.112 provides <strong>the</strong> results of this vulnerability analysis for counties with known<br />
subsurface void spaces, organized by Mitigation Planning Region.<br />
3.194
Table 3.112. Subsurface Void Space Vulnerability Analysis<br />
County<br />
Lead/<br />
Zinc Cat. I<br />
Acres<br />
Coal<br />
Category I<br />
Coal<br />
Category II<br />
Coal<br />
Category III<br />
Limestone<br />
Category I<br />
Limestone<br />
Category II<br />
Limestone<br />
Category III<br />
Gypsum<br />
Category II<br />
Mitigation Planning Region L<br />
Johnson 209 209 277 695 1,322<br />
Leavenworth 1100 40 40 40 1,220 1,340<br />
Wyandotte 394 323 347 1,064 2,175<br />
Subtotal 0 0 0 1100 643 572 664 0 0 0 0 0 0 2,979 4,837<br />
Source: Data from KDHE, “Subsurface Void Space and Sinkhole/Subsidence Area Inventory for <strong>the</strong> State of Kansas” November 2006; Data tabulated and assigned weighted<br />
scores by AMEC; Void Space Unknown indicates that known coal mines are present. However subsurface void space is not known<br />
Salt Solution<br />
Category I<br />
Salt Solution<br />
Category II<br />
Salt Solution<br />
Category III<br />
Rock Salt<br />
Category III<br />
Hydrocarbon<br />
Storage<br />
Category III<br />
Total Subsurface<br />
Void<br />
Space<br />
Weighted<br />
Calculation<br />
Table 3.113. Top 10 Counties Vulnerable to Land Subsidence According to Weighted Calculation<br />
Mitigation<br />
Planning<br />
Region County<br />
Total Sub-surface<br />
Void Space<br />
Weighted<br />
Calculation<br />
H Crawford 69,000 150,100<br />
H Cherokee 33,769 85,753<br />
J Osage 4,000 8,000<br />
G Reno 2,889 3,949<br />
L Wyandotte 1,064 2,175<br />
F Ellsworth 2,134 2,158<br />
G Rice 1,141 1,350<br />
L Leavenworth 1,220 1,340<br />
L Johnson 695 1,322<br />
E Barber 520 1,040<br />
Source: State Hazard Mitigation Plan<br />
Weighted Calculation: With <strong>the</strong> known number<br />
of acres in each risk category for each county<br />
with documented subsurface void spaces, a<br />
weighted vulnerability calculation was<br />
completed. Acreage in risk Category I (High<br />
Risk) received a multiplier of three, acreage in<br />
risk Category II (Moderate Risk) received a<br />
multiplier of two and acreage in risk Category III<br />
(Low Risk) received a multiplier of one.<br />
3.195
Summary<br />
Land subsidence is a concern in Region L, but is considered a rare occurrence. When it does<br />
happen <strong>the</strong> cost can be high. All three counties in <strong>the</strong> planning area are rated in <strong>the</strong> top 10<br />
most vulnerable counties in Kansas for this hazard due to <strong>the</strong> coal mines in Leavenworth<br />
County and <strong>the</strong> make-up of <strong>the</strong> land in <strong>the</strong> Region which has a high limestone component. Both<br />
of <strong>the</strong>se are highly susceptible to collapse.<br />
Local Mitigation Concerns<br />
• Comparison of <strong>the</strong> weighted vulnerability calculation considering known subsurface void<br />
spaces with <strong>the</strong> top 10 counties for housing unit gains and populations gains shows that<br />
Leavenworth and Johnson Counties are in <strong>the</strong> top 10 for both housing and population<br />
gains, and scored within <strong>the</strong> top 10 counties in <strong>the</strong> weighted vulnerability calculation for<br />
land subsidence. With <strong>the</strong>se growths, and <strong>the</strong> developments that are associated with<br />
<strong>the</strong>m, land subsidence could beome an even bigger issue as <strong>the</strong> urban areas spread out<br />
toward <strong>the</strong> more susceptible land areas that pose <strong>the</strong> most risk for subsidence, such as<br />
<strong>the</strong> coal mines in Leavenworth County.<br />
• Wyandotte County is not growing at as fast a pace as Leavenworth and Johnson<br />
counties, yet it is <strong>the</strong> county on record as having <strong>the</strong> notable incidents with <strong>the</strong> latest<br />
being in 1999. The Kansas City incident was not on <strong>the</strong> Kansas side, but it was close<br />
enough to Wyandotte County to merit concern. Known for its industrial areas,<br />
Wyandotte could experience heavy financial burdens should sinkholes develop in this<br />
area.<br />
Development in Hazard Prone Areas<br />
Comparison of <strong>the</strong> weighted vulnerability calculation considering known subsurface void spaces<br />
with <strong>the</strong> top 10 counties for housing unit gains and populations gains reveals that Leavenworth<br />
and Johnson Counties are in <strong>the</strong> top 10 for both housing and population gains and scored within<br />
<strong>the</strong> top 10 counties in <strong>the</strong> weighted vulnerability calculation for land subsidence.<br />
Johnson County<br />
Table 3.114. Johnson County CPRI: Land Subsidence<br />
Hazard Type Probability Magnitude<br />
Warning<br />
Time Duration CPRI<br />
Planning<br />
Significance<br />
Johnson County<br />
Land Subsidence 1 1 4 1 1.30 Low<br />
3.196
Leavenworth County<br />
Table 3.115. Leavenworth County CPRI: Land Subsidence<br />
Hazard Type Probability Magnitude<br />
Warning<br />
Time Duration CPRI<br />
Planning<br />
Significance<br />
Leavenworth County<br />
Land Subsidence 1 1 4 1 1.30 Low<br />
Wyandotte County<br />
Table 3.116. Wyandotte County CPRI: Land Subsidence<br />
Hazard Type Probability Magnitude<br />
Warning<br />
Time Duration CPRI<br />
Planning<br />
Significance<br />
Wyandotte County<br />
Land Subsidence 1 1 4 1 1.30 Low<br />
Consequence (Impact) Analysis<br />
The information in Table 3.117 provides <strong>the</strong> Consequence Analysis of Potential for Detrimental<br />
Impacts of Hazards done for accreditation with <strong>the</strong> Emergency Management Accreditation<br />
Program (EMAP).<br />
Table 3.117. EMAP Consequence Analysis: Land Subsidence<br />
Subject Ranking Impacts/Land Subsidence<br />
Health and Safety of Persons in <strong>the</strong><br />
Area of <strong>the</strong> Incident<br />
Moderate to Severe<br />
Local impact expected to be moderate to<br />
severe for <strong>the</strong> incident area.<br />
Responders Minimal Impact to responders would be minimal.<br />
Continuity of Operations Minimal Minimal expectation of execution of <strong>the</strong><br />
COOP, unless a facility is impacted.<br />
Property, Facilities, and Infrastructure Severe Localized impact to facilities and<br />
infrastructure in <strong>the</strong> incident area has<br />
<strong>the</strong> potential to do severe damage.<br />
Delivery of Services Minimal Impacts to <strong>the</strong> delivery of services could<br />
be severe if roads/utilities are affected.<br />
O<strong>the</strong>rwise impact would be non-existent<br />
to minimal.<br />
Environment Minimal Impact to <strong>the</strong> area would be minimal.<br />
Economic Conditions Minimal Impacts to <strong>the</strong> economy will depend on<br />
<strong>the</strong> severity of <strong>the</strong> damage.<br />
Public Confidence in Jurisdiction’s<br />
Governance<br />
Minimal to Severe<br />
Local development policies will be<br />
questioned (minimal to severe)<br />
3.197
3.2.13 Landslide<br />
Calculated Priority Risk Index Planning Significance<br />
1.75 Low<br />
Description<br />
Landslides are a phenomenon that is not new to <strong>the</strong> planning area. A landslide is <strong>the</strong> downhill<br />
movement of soil and rock by gravity. The basic ingredients for landslides are gravity,<br />
susceptible soil or rock, sloping ground, and water. Types of landslides that occur in Kansas are<br />
rockfalls, block slides, slumps, earth flows, and creep. Creep is widespread on hillsides<br />
throughout Kansas.<br />
Landslides must have an elevated terrain, with <strong>the</strong> potential for landslides increasing as <strong>the</strong><br />
slope angle increases in degrees. Anything that increases <strong>the</strong> slope angle can trigger a<br />
landslide (e.g., a stream actively eroding a hill, construction practices). Slope steepness is <strong>the</strong><br />
primary factor determining slope stability, but soil and rock types are also important. The most<br />
common rocks <strong>found</strong> in Kansas are shale’s, limestone, and sandstones. Shale’s—rocks<br />
composed of clay- and silt-sized grains—are most often associated with landslides. When shale<br />
is near <strong>the</strong> ground surface w<strong>here</strong> <strong>the</strong> water content fluctuates, it wea<strong>the</strong>rs into a clayey soil that<br />
could be landslide prone. Limestone and sandstones exposed in cliffs or roadcuts can pose a<br />
risk for rock fall, especially when <strong>the</strong>y overlie shale’s.<br />
Landslides may occur when soil on hillsides is saturated following extended periods of rainfall or<br />
snow melt. Landslides can damage or destroy structures, roadways, and utilities as well as<br />
block roadways with debris. They are often associated with o<strong>the</strong>r hazard events (e.g.,<br />
earthquakes, flooding, and heavy rainfall).<br />
Landslides occur occasionally in Region L and are a localized problem, but growth of cities<br />
provides potential for more property losses. In parts of <strong>the</strong> state w<strong>here</strong> topographic relief is<br />
greatest, especially in central and eastern Kansas, landslides can occur when underlying<br />
shale’s become saturated with water in wet years. Rocks and overlying soils <strong>the</strong>n slip down<br />
slope and are a particular problem in areas of housing or w<strong>here</strong> road construction has occurred.<br />
Location<br />
While <strong>the</strong> probability of a landslide happening in Region L is unlikely, Johnson County<br />
historically shows <strong>the</strong> event is possible in a 5 year window. Vulnerability to landslide hazards is<br />
a function of location, type of human activity, use, and frequency of landslide events. The risk<br />
posed by landslide to <strong>the</strong> planning area is low, but not impossible in <strong>the</strong> metro area.<br />
According to <strong>the</strong> U.S. Geological Survey, <strong>the</strong> areas of Kansas that are most prone to landslides<br />
are <strong>the</strong> Missouri River Corridor in nor<strong>the</strong>astern Kansas, including <strong>the</strong> Kansas City metropolitan<br />
area (Johnson, Leavenworth, and Wyandotte counties); <strong>the</strong> Smoky Hills in nor<strong>the</strong>rn and central<br />
Kansas; and northwestern Hamilton County (see Figure 3.71).<br />
3.198
Figure 3.71. Landslide-Prone Areas of Kansas<br />
Source: Kansas Geological Survey, http://www.kgs.ku.edu/Publications/AnnRep02/hazards/hazards.html<br />
3.199
Landslides in <strong>the</strong> hilly terrain along <strong>the</strong> Kansas and Missouri rivers in nor<strong>the</strong>astern Kansas have<br />
caused millions of dollars in property damage. In 1997, <strong>the</strong> Kansas Geological Survey began an<br />
effort to map <strong>the</strong> landslide hazards of nor<strong>the</strong>astern Kansas. The pilot area was Atchison,<br />
because of <strong>the</strong> steep bluffs along <strong>the</strong> Missouri River. A statistical method called multiple logistic<br />
regression has been used to create a landslide-hazard map for Atchison, Kansas, and<br />
surrounding areas. Data included digitized geology, slopes, and landslides, manipulated using<br />
ArcView GIS. Additional information including landslide hazard maps is available for <strong>the</strong> study<br />
area from <strong>the</strong> Kansas Geological Survey (reference <strong>the</strong> KGS M Series Maps).<br />
Previous Occurrences<br />
The most costly landslide in Kansas was in 1995 in Overland park. Two houses were destroyed<br />
and four lots were damaged with an estimated value of $1.5 million. O<strong>the</strong>r landslides in <strong>the</strong><br />
planning area include:<br />
• July 2001: Mission, Kansas (Johnson County). A 180 foot wide landslide accord along <strong>the</strong><br />
north side of Foxridge Drive. The ear<strong>the</strong>n mass moved laterally and downward<br />
approximately 2 feet.<br />
• 200: Landslide in Shawnee, Kansas that began about 10 feet behind a house and<br />
extended about 90 feet north to <strong>the</strong> stream 50 feet below. A $275,000 retaining wall was<br />
built to mitigate damages.<br />
• 1998: Kansas City intense rainfall on October 4, 1998 caused excessive pressure on<br />
retaining walls at <strong>the</strong> Woodlawn Cemetery in Kansas City, KS (north of Parallel and<br />
east of 9th St). Also several roads throughout <strong>the</strong> County, (51st & Douglas Ave, and<br />
Barnes Dr between Pomeroy Dr & 74th St) experienced landslide damage. The total<br />
landslide damage was over $1 million to repair through FEMA’s Public Assistance<br />
funds.<br />
• 1990: Leawood, Kansas (Johnson County): two homes were damaged at an estimated<br />
cost of $120,000.<br />
Extent<br />
A Landslide in <strong>the</strong> Region is not expected to be of a catastrophic nature. The planning<br />
committee has determined <strong>the</strong> magnitude of this hazard as: Limited. No resulting permanent<br />
disability, critical facilities would not be shut down for more than one week, and 10 – 25% of<br />
property could potentially be severely damaged in an event.<br />
Probability of Future Events<br />
According to <strong>the</strong> Geological Survey, Region L is in an area that is more prone to landslides, due<br />
to its co-location to <strong>the</strong> Missouri River. However, while it is prone to landslides, historically <strong>the</strong><br />
incidences are few and far between. The planning committee has ranked this hazard’s<br />
probability as “Unlikely”, with a 1 in 10 years chance of occurring.<br />
3.200
Impact and Vulnerability<br />
While not a regular or normal event, losses due to landslides in <strong>the</strong> planning area will continue.<br />
Landslide losses are primarily related to damage to property. However, if a sudden landslide<br />
impacts an inhabited structure, injuries or deaths could occur. Historically, landslides in Kansas<br />
have been isolated events impacting a few properties or a particular area. Often, damages in<br />
terms of estimated losses are not reported. Additionally, <strong>the</strong>re is not a repository for damages<br />
to be reported, o<strong>the</strong>r than NCDC. The NCDC database does not include any previous landslide<br />
events in <strong>the</strong> Region, let alone in Kansas. This is likely because <strong>the</strong> events are generally<br />
isolated and do not impact large areas.<br />
It is not possible at this time to determine quantitative estimates for potential losses associated<br />
with <strong>the</strong> landslide hazard.<br />
Landslides were ranked 19 th on <strong>the</strong> planning significance for area. Region L is notable for its<br />
hills, oftentimes having steep slopes. These slopes are prone to landslides, especially during<br />
periods of heavy rain. Wildfire can exacerbate a landslide by depleting <strong>the</strong> soil of its ‘anchor’.<br />
Region L has been noted to have wildfires and landslides, with <strong>the</strong> worst being in Johnson<br />
County.<br />
Local Mitigation Concerns<br />
• Region L is located along <strong>the</strong> Missouri River corridor and <strong>the</strong> Kansas River, which according<br />
<strong>the</strong> U.S. Geological Survey makes it more prone to landslides. Coupled with increased<br />
development trends to accommodate <strong>the</strong> increase in <strong>the</strong> population base and <strong>the</strong> hilly<br />
terrain, a landslide could potentially cause <strong>the</strong> loss of life and property.<br />
• Areas that have seen wildfires or human modification of <strong>the</strong> land that have destroyed<br />
vegetation are prone to landslides, specifically during rain events. With <strong>the</strong> drought from<br />
2011 to present, <strong>the</strong> Region has seen an increase in <strong>the</strong> incidence of wildfires (discussed in<br />
<strong>the</strong> Wildfire section). Human modification to include landscaping or development also<br />
brings <strong>the</strong> risk of landslides. Particularly if a home or business is on a hill, which includes<br />
slopes that have been altered for construction of buildings and roads. Johnson County saw<br />
a couple of homes destroyed in a landslide in 1995, causing a total of $1.5 million dollars.<br />
3.201
Figure 3.72. 1995 Johnson County Landslide<br />
Source: Kansas Geological Survey, http://www.kgs.ku.edu/Publications/AnnRep02/hazards/hazards.html<br />
• Landslides have a significant impact on transportation corridors, fuel and energy conduits,<br />
and communications linkages. Ground-failure events have devastating economic effects on<br />
Federal, State, local, and private roads, and bridges. Railroads, electric and<br />
telecommunication lines, dams, levees, and waste repositories can be affected by land<br />
movement. Road building and construction often exacerbate <strong>the</strong> landslide problem in hilly<br />
areas by altering <strong>the</strong> landscape, slopes, and drainages and by changing and channeling<br />
runoff, <strong>the</strong>reby increasing <strong>the</strong> potential for landslides. Landslides and o<strong>the</strong>rs forms of ground<br />
failure also have adverse environmental consequences, such as dramatically increased soil<br />
erosion, siltation of streams and reservoirs, blockage of stream drainages, and<br />
loss of valuable watershed, grazing, and timber lands.<br />
Development in Hazard Prone Areas<br />
Of <strong>the</strong> landslide-prone areas, Johnson and Leavenworth are also rated in <strong>the</strong> top 10 Kansas<br />
Counties for Housing Unit Gains Additionally, <strong>the</strong>se two counties are in <strong>the</strong> top 10 Kansas<br />
Counties for Population Gains If construction is occurring in or near landslide hazard areas,<br />
more structures/population will be at risk to damage/injury from landslides.<br />
The effects of landslides on people and structures can be lessened by total avoidance of<br />
landslide hazard areas or by restricting, prohibiting, or imposing conditions on hazard-zone<br />
activity. The hazard from landslides can be reduced by avoiding construction on steep slopes<br />
and existing landslides, or by stabilizing <strong>the</strong> slopes. Stability increases when ground water is<br />
prevented from rising in <strong>the</strong> landslide mass by (1) covering <strong>the</strong> landslide with an impermeable<br />
membrane, (2) directing surface water away from <strong>the</strong> landslide, (3) draining ground water away<br />
from <strong>the</strong> landslide, and (4) minimizing surface irrigation. Slope stability is also increased when a<br />
3.202
etaining structure and/ or <strong>the</strong> weight of a soil/rock berm are placed at <strong>the</strong> toe of <strong>the</strong> landslide or<br />
when mass is removed from <strong>the</strong> top of <strong>the</strong> slope.<br />
Johnson County<br />
Table 3.118. Johnson County CPRI: Landslide<br />
Hazard Type Probability Magnitude<br />
Warning<br />
Time Duration CPRI<br />
Planning<br />
Significance<br />
Johnson County<br />
Landslide 1 2 4 1 1.75 Low<br />
Leavenworth County<br />
Table 3.119. Leavenworth County CPRI: Landslide<br />
Hazard Type Probability Magnitude<br />
Warning<br />
Time Duration CPRI<br />
Planning<br />
Significance<br />
Leavenworth County<br />
Landslide 1 2 4 1 1.75 Low<br />
Wyandotte County<br />
Table 3.120. Wyandotte County CPRI: Landslide<br />
Hazard Type Probability Magnitude<br />
Warning<br />
Time Duration CPRI<br />
Planning<br />
Significance<br />
Wyandotte County<br />
Landslide 1 2 4 1 1.75 Low<br />
Consequence (Impact) Analysis<br />
The information in Table 3.121 provides <strong>the</strong> Consequence Analysis of Potential for Detrimental<br />
Impacts of Hazards done for accreditation with <strong>the</strong> Emergency Management Accreditation<br />
Program (EMAP).<br />
3.203
Table 3.121. EMAP Consequence Analysis: Landslide<br />
Subject Ranking Impacts/Landslide<br />
Health and Safety of Persons in <strong>the</strong><br />
Area of <strong>the</strong> Incident<br />
Moderate to Severe<br />
Localized impact could be moderate to<br />
severe for <strong>the</strong> incident area.<br />
Responders Minimal Impact to responders would be minimal.<br />
Continuity of Operations Minimal Minimal expectation of execution of <strong>the</strong><br />
COOP, unless a facility is impacted.<br />
Property, Facilities, and<br />
Infrastructure<br />
Minimal to Severe<br />
Localized impact to facilities and<br />
infrastructure in <strong>the</strong> incident area has <strong>the</strong><br />
potential to do severe damage if <strong>the</strong>y are<br />
on, or in, <strong>the</strong> area of <strong>the</strong> landslide.<br />
Delivery of Services Minimal Impacts to <strong>the</strong> delivery of services could be<br />
severe if roads/utilities are affected.<br />
O<strong>the</strong>rwise impact would be non-existent to<br />
minimal.<br />
Environment Minimal Impact to <strong>the</strong> area would be minimal o<strong>the</strong>r<br />
than <strong>the</strong> immediate area.<br />
Economic Conditions Minimal Impacts to <strong>the</strong> economy will depend on <strong>the</strong><br />
severity of <strong>the</strong> damage, i.e., are roads<br />
blocked, did any businesses get caught in<br />
<strong>the</strong> landslide.<br />
Public Confidence in Jurisdiction’s<br />
Governance<br />
Minimal to Severe<br />
Local development policies will be<br />
questioned (minimal to severe).<br />
3.204
3.2.14 Lightning<br />
Calculated Priority Risk Index<br />
2.80 Moderate<br />
Description<br />
Planning Significance<br />
According to <strong>the</strong> National Wea<strong>the</strong>r Service, lightning is one of <strong>the</strong> most underrated severe<br />
wea<strong>the</strong>r hazards. The second deadliest wea<strong>the</strong>r killer in <strong>the</strong> United States, it ranks above<br />
hurricanes or tornadoes. Of <strong>the</strong> estimated 1,000 people who are struck by lightning each year<br />
on <strong>the</strong> U.S., only 10 percent are killed, but survivors may suffer life-long disabilities.<br />
Severe thunderstorms strike Kansas on a regular basis. In addition to <strong>the</strong> heavy rains that<br />
cause floods, high winds, tornadoes and thunderstorms, lightning often accompanies<br />
thunderstorms and can cause injury, death, property damage and wild land fires. The<br />
widespread and frequent nature of thunderstorms makes lightning a relatively common<br />
occurrence. Of particular concern to Kansas is protection of facilities and communications<br />
systems that are important to emergency response operations, protection of public health and<br />
maintenance of <strong>the</strong> State’s economy. The threat to communications systems includes tornado<br />
sirens, which could get knocked out just when <strong>the</strong>y are needed most.<br />
According to <strong>the</strong> National Oceanic and Atmospheric Association, <strong>the</strong>re are 7 main types of<br />
lightning:<br />
Intra – Cloud: This is <strong>the</strong> most common type of lightning and completely inside of a cloud.<br />
Cloud to Cloud: This type of lightning occurs between two or more clouds.<br />
Cloud to Air: Lightning that is generated in a positively charged cloud top and reaches out to<br />
negatively charged air around it.<br />
Bolt from <strong>the</strong> blue: Originates within <strong>the</strong> updraft of a storm, travels horizontally for many miles,<br />
<strong>the</strong>n strikes <strong>the</strong> ground.<br />
Anvil Lightning: Lightning that develops in <strong>the</strong> anvil of a thunderstorm cloud and travels straight<br />
down to strike <strong>the</strong> ground.<br />
Heat Lightning: Lightning from a thunderstorm that is too far away to be heard.<br />
3.205
Location<br />
The Nor<strong>the</strong>astern part of Kansas, which includes Region L, has an average of 18 to 21 lightning<br />
strikes per square mile per year, which makes it a regularly occurring hazard. It affects <strong>the</strong><br />
agricultural farmlands and <strong>the</strong> urban landscape without discretion. Figure 3.73 indicates <strong>the</strong><br />
distribution of lightning throughout <strong>the</strong> U.S. from 1997 to 2010.<br />
Figure 3.73. Location and Frequency of Lightning in U.S., 1997 - 2010<br />
Source: Vaisala, http://www.vaisala.com/en/products/thunderstormandlightningdetectionsystems/Pages/NLDN.aspx<br />
Previous Occurrences<br />
26 July 2000 - A lightning strike sparked a house fire in Leawood, Johnson County, which<br />
resulted in an estimated $50,000 in damage.<br />
11 September 2000 - Lightning sparked a house fire in Lenexa, Johnson County which caused<br />
$325,000 in damage to <strong>the</strong> house and its contents.<br />
10 July 2001 – $25,000 in damage was done in Ola<strong>the</strong>, Johnson County, when a severe<br />
thunderstorm rolled through.<br />
20 August 2005 - Lightning struck a residence, causing $30,000 in damage at Fort<br />
Leavenworth, KS.<br />
14 August 2006 - Lightning hit a home and caused major damage from a fire that broke out in<br />
Overland Park, KS, Johnson County. Damage was estimated at $150,000.<br />
3.206
28 February 2007 – Lightning struck a transformer on <strong>the</strong> roof of a middle school resulting in<br />
$5,000 in damage in Bonner Springs, Wyandotte County, KS.<br />
2 June 2008 - A 36 year old female was standing in <strong>the</strong> doorway of her home, when lightning<br />
struck nearby. She was transported to <strong>the</strong> hospital complaining of deafness. Basehor, KS,<br />
Leavenworth, KS.<br />
Extent<br />
Magnitude: Limited. No resulting permanent disability, critical facilities not shut down for more<br />
than one week, and no more than 10 – 25% of property is potentially severely damaged.<br />
Probability of Future Events<br />
Region L experiences Lightning on a regular basis throughout <strong>the</strong> year, particularly during <strong>the</strong><br />
May – September time frame. However, as can be seen in <strong>the</strong> previous occurrences, it can<br />
strike during o<strong>the</strong>r months also as shown on <strong>the</strong> 28 February 2007 event. While lightning<br />
strikes regularly occur, w<strong>here</strong> and when it strikes is difficult to pin down. T<strong>here</strong> is no good data<br />
on <strong>the</strong> exact number of lightning incidents in <strong>the</strong> planning area during a given year, however, to<br />
one degree or ano<strong>the</strong>r Lightning is a presence every year. The probability for this hazard is<br />
“Highly Likely”.<br />
Impact and Vulnerability<br />
To determine potential financial loss estimates to lightning in <strong>the</strong> region, <strong>the</strong> available historical<br />
loss data was annualized. In <strong>the</strong> case of frequently occurring wea<strong>the</strong>r-related hazards such as<br />
lightning, annualized historical loss data is considered to be <strong>the</strong> best resource for determining<br />
future potential losses. The planning team obtained loss data for <strong>the</strong> National Climatic Data<br />
Center (NCDC) storm events (2000 – 2012). According to this data, <strong>the</strong> annualized property<br />
loss for <strong>the</strong> planning area from lightning is $48,749 Table 3.122.<br />
County Annualized Property Loss 2000 - 2012<br />
Johnson $45,833<br />
Leavenworth $2,500<br />
Wyandotte $416<br />
Total $48,749<br />
Source: NCDC. http://www.ncdc.noaa.gov/stormevents/choosedates.jsp?statefips=20%2CKANSAS<br />
Deaths and injuries from lightning in <strong>the</strong> planning area have been minimal according to <strong>the</strong><br />
NCDC database for <strong>the</strong> period 2000 – 2012 as reflected in Table 3.123 below.<br />
Table 3.123. Deaths and Injuries from Lightning in Region L, 2000 – 2012.<br />
County Events Deaths Injuries<br />
Leavenworth 2 0 1 female<br />
Johnson 4 0 0<br />
Wyandotte 1 0 0<br />
Source: NCDC. http://www.ncdc.noaa.gov/stormevents/choosedates.jsp?statefips=20%2CKANSAS<br />
3.207
Severe thunderstorms and <strong>the</strong> associated lightning events will continue to cause damage to<br />
anything and everything exposed to <strong>the</strong> wea<strong>the</strong>r elements. Historically NCDC has reported 1<br />
injury in <strong>the</strong> Region from 2000 through 2012.<br />
Lightning is a regular occurrence in <strong>the</strong> planning area and is a known hazard as it pertains to<br />
buildings, crops, and people. It can affect communication systems which include warning<br />
systems and power. The most common months for lightning strikes is May through September,<br />
<strong>the</strong> very time period that people are enjoying recreational activities outdoors such as <strong>the</strong> golf<br />
course and lakeside.<br />
The statistical analysis method was used to refine and assess <strong>the</strong> relative vulnerability of each<br />
of Region L’s counties to lightning. The planning committee assigned ratings to pertinent factors<br />
that were examined at <strong>the</strong> county level. These factors are: social vulnerability index, prior<br />
events, prior annualized property damage, building exposure valuation, population density and<br />
crop exposure (annualized crop losses were not used since USDA did not have insured crop<br />
loss amounts to use in <strong>the</strong> tabulation). Then a rating value of 1-10 was assigned to <strong>the</strong> data<br />
obtained for each factor and <strong>the</strong>n weighted equally and factored toge<strong>the</strong>r to obtain overall<br />
vulnerability scores for comparison and to determine <strong>the</strong> greatest vulnerable counties.<br />
The following are <strong>the</strong> data sources of <strong>the</strong> six factors: Social Vulnerability Index for Region L’s<br />
counties from <strong>the</strong> Hazards and Vulnerability Research Institute at <strong>the</strong> University of South<br />
Carolina, National Climatic Data Center (NCDC) storm events (2006 – 2012), U.S. Census<br />
Bureau (2010) and USDA’s Census of Agriculture (2007). It was determined that since lightning<br />
is a common occurrence in Kansas, that using historical events and property damages from<br />
2006 forward provides adequate events to describe <strong>the</strong> lightning problem in <strong>the</strong> planning area.<br />
Table 3.124 below provides <strong>the</strong> data for each of <strong>the</strong> six factors described above taken into<br />
consideration to determine overall vulnerability to lightning. The data is provided by county.<br />
Table 3.124. Vulnerability of Kansas Counties Factor Amounts for Lightning<br />
County<br />
SoVI<br />
Rating<br />
(1-5)<br />
Prior<br />
Events<br />
2006-<br />
2012<br />
Property<br />
Damages<br />
Annualized<br />
Property<br />
Damages<br />
Total Building<br />
Exposure<br />
($000)<br />
Population<br />
Density<br />
Crop Exposure<br />
(2007 Census of<br />
Agriculture)<br />
Region L<br />
Johnson 1 1 $150,000 $21,429 $43,871,468 1,149.60 $29,472,000<br />
Leavenworth 1 1 $0 $0 $4,877,783 164.7 $20,983,000<br />
Wyandotte 3 1 $5,000 $714 $12,066,666 1,039.00 $0<br />
total 3 $155,000 $22,143 $60,815,917 $50,455,000<br />
Note: The Census of Agriculture did not publish crop exposure in Wyandotte County to avoid disclosure of individual operations.<br />
Table 3.125 provides <strong>the</strong> ranges for <strong>the</strong> 1-10 lightning vulnerability factor ratings. The Social<br />
Vulnerability Index is in a range of 1- 5. To give Social Vulnerability Index <strong>the</strong> same weight as<br />
<strong>the</strong> o<strong>the</strong>r factors, <strong>the</strong> numbers were multiplied by two.<br />
3.208
Table 3.125. Ranges for Lightning Vulnerability Factor Ratings<br />
Social<br />
Vulnerability<br />
NCDC Prior<br />
Events<br />
Annualized<br />
Property<br />
Damage<br />
1 1<br />
$143 -<br />
$3,600<br />
$3,601 -<br />
2 1 2 $7,200<br />
$7,201 -<br />
3 3 $10,800<br />
$10,801 -<br />
4 2 4 $14,400<br />
$14,401 -<br />
5 5 $18,000<br />
$18,001 -<br />
6 3 n/a $21,600<br />
$21,601 - $<br />
7 n/a 25,200<br />
$25,201 -<br />
8 4 n/a $28,000<br />
$28,801 -<br />
9 n/a $33,000<br />
$33,001 and<br />
10 5 n/a up<br />
Source: State Hazard Mitigation Plan<br />
Building<br />
Exposure<br />
Valuation<br />
$117,421 -<br />
$4,492,825<br />
$4,492,826 -<br />
$8,868,229<br />
$8,868,230 -<br />
$13,243,634<br />
$13,243,635 -<br />
$17,619,039<br />
$17,619,040 -<br />
$21,994,444<br />
$21,994,445 -<br />
$26,369,848<br />
$26,369,849 -<br />
$30,745,253<br />
$30,745,254 -<br />
$35,120,658<br />
$35,120,659 -<br />
$39,496,062<br />
$39,496,063 -<br />
$43,871,468<br />
Population<br />
Density *<br />
Crop Exposure<br />
1.6 -<br />
116.3 0 - $18,548,500<br />
116.4 - $18,548,501 -<br />
231.1 $32,126,000<br />
231.2 - $32,126,001 -<br />
345.9 $45,703,500<br />
346 - $45,703,501 -<br />
460.7 $59,281,000<br />
460.8 - $59,281,001 -<br />
575.5 $72,858,500<br />
575.6 - $72,858,501 -<br />
690.3 $86,436,000<br />
690.4 - $86,436,001 -<br />
805.1 $100,013,500<br />
805.2 - $100,031,501 -<br />
919.9 $113,591,000<br />
920- $113,591,001 -<br />
1,034.7 $127,168,500<br />
1,034.8 - $127,168,501 -<br />
1,149.6 $140,746,000<br />
Table 3.126 provides <strong>the</strong> calculated ranges applied to determine <strong>the</strong> Low, Medium-Low,<br />
Medium, Medium-High and High vulnerable counties and Table 3.127 provides <strong>the</strong> rating values<br />
assigned that were considered in determining overall vulnerability to lightning.<br />
Table 3.126. Ranges for Overall Lightning Vulnerability<br />
Ranges Low Medium-Low Medium Medium-High High<br />
7 - 13 14 – 18 19 – 23 24 – 28 29 - 34<br />
Source: State Hazard Mitigation Plan<br />
Table 3.127. Vulnerability of Region L Counties to Lightning<br />
County<br />
SoVi Rating<br />
NCDC Prior<br />
Event Rating<br />
Annualized<br />
Property<br />
Damage<br />
Rating<br />
Bldg<br />
Exposure<br />
Valuation<br />
Rating<br />
Population<br />
Density<br />
Rating<br />
Crop<br />
Exposure<br />
Rating<br />
Overall<br />
Vulnerability<br />
Rating<br />
Region L<br />
Johnson 2 1 6 10 10 2 31 High<br />
Leavenworth 2 1 0 2 2 2 9 Low<br />
Wyandotte 6 1 1 3 10 1 22 Medium<br />
Source: State Hazard Mitigation Plan<br />
Lightning<br />
Vulnerability<br />
3.209
Table 3.128 below lists <strong>the</strong> top ten vulnerable counties in Kansas relative to each o<strong>the</strong>r<br />
concerning lightning events. This table gives <strong>the</strong> top ten counties in Kansas in order to put <strong>the</strong><br />
counties of Region L in perspective as to <strong>the</strong>ir vulnerability.<br />
Table 3.128. Top Ten Counties: Vulnerable to Lightning<br />
Mitigation<br />
Planning Region<br />
Lightning<br />
Vulnerability<br />
County<br />
G Sedgwick High<br />
L Johnson High<br />
A Rawlins High<br />
A Thomas High<br />
I Riley Medium<br />
G Cowley Medium<br />
L Wyandotte Medium<br />
K Brown Medium<br />
F Dickinson Medium<br />
J Shawnee Medium<br />
Source: State Hazard Mitigation Plan<br />
Summary<br />
The entire region is susceptible to lighting strikes. Of great concern is lightning during periods<br />
of drought which can result in wildfires and damage property and put lives in danger. Johnson<br />
County and Wyandotte County are in <strong>the</strong> Top 10 counties in Kansas for being <strong>the</strong> most<br />
vulnerable to lightning strikes.<br />
Local Mitigation Concerns<br />
• As with many hazards, lightning can go hand in hand with o<strong>the</strong>r natural disasters. With<br />
<strong>the</strong> drought of 2011 to present, lightning can cause a fire risk should it strike within <strong>the</strong><br />
planning area. The dry grass is ripe for an ignition, and lightning can be <strong>the</strong> spark that<br />
could create a wildfire that threatens crops, buildings, and lives.<br />
• Outdoor recreation within <strong>the</strong> planning area includes places such as <strong>the</strong> Kansas<br />
Speedway, which could be detrimental should a thunderstorm hit that is associated with<br />
lightning. Because of <strong>the</strong> large cluster of people, avoiding a hit if lightning does strike<br />
could be unavoidable. Added to that <strong>the</strong> stampede of people trying to get out of <strong>the</strong><br />
strike zone and <strong>the</strong> result could be catastrophic.<br />
Development in Hazard Prone Areas<br />
Virtually all structures, communication towers, power systems and electrical components in <strong>the</strong><br />
planning area are vulnerable to lightning. Lightning causes untold numbers of dollars in<br />
damages to homes, schools, businesses and barns each year. Fires, electrical fires, electricity<br />
loss and damage to equipment are a few of <strong>the</strong> problems associated with lightning strikes.<br />
3.210
Johnson County<br />
Table 3.129. Johnson County CPRI: Lightning<br />
Hazard Type Probability Magnitude<br />
Warning<br />
Time Duration CPRI<br />
Planning<br />
Significance<br />
Johnson County<br />
Lightning 4 2 2 1 2.80 Moderate<br />
Leavenworth County<br />
Table 3.130. Leavenworth County CPRI: Lightning<br />
Hazard Type Probability Magnitude<br />
Warning<br />
Time Duration CPRI<br />
Planning<br />
Significance<br />
Leavenworth County<br />
Lightning 4 2 2 1 2.80 Moderate<br />
Wyandotte County<br />
Table 3.131. Wyandotte County CPRI: Lightning<br />
Hazard Type Probability Magnitude<br />
Warning<br />
Time Duration CPRI<br />
Planning<br />
Significance<br />
Leavenworth County<br />
Lightning 4 2 2 1 2.80 Moderate<br />
Consequence (Impact) Analysis<br />
The information in Table 3.132 provides <strong>the</strong> Consequence Analysis of Potential for Detrimental<br />
Impacts of Hazards done for accreditation with <strong>the</strong> Emergency Management Accreditation<br />
Program (EMAP).<br />
3.211
Table 3.132. EMAP Consequence Analysis: Lightning<br />
Subject Ranking Impacts/Lightning<br />
Health and Safety of Persons in <strong>the</strong><br />
Area of <strong>the</strong> Incident<br />
Minimal to Severe<br />
Impact to <strong>the</strong> health and safety of persons could be<br />
minimal to severe if within <strong>the</strong> incident area.<br />
Responders<br />
Minimal<br />
Impact to responders is expected to be minimal<br />
unless responders live within <strong>the</strong> affected area.<br />
Continuity of Operations<br />
Minimal<br />
Temporary relocation may be necessary if<br />
government facilities experience damage (Minimal).<br />
Property, Facilities, and<br />
Infrastructure<br />
Minimal to Severe<br />
Impact could be severe if property, facilities or<br />
infrastructure take a direct hit which could result in<br />
fire or destruction.<br />
Delivery of Services<br />
Minimal to Severe<br />
Delivery of services could be affected if <strong>the</strong>re is any<br />
disruption to <strong>the</strong> roads and/or utilities due to<br />
damages sustained (minimal to severe).<br />
Environment<br />
Minimal to Severe<br />
Impact will be isolated, yet severe to any trees,<br />
animals, etc., that take a direct hit, or is in <strong>the</strong> path<br />
of any fire that may be generated due to <strong>the</strong> lighting<br />
strike.<br />
Local economy impact should be fairly minimal,<br />
unless <strong>the</strong> lightening causes fires which damage<br />
Economic Conditions<br />
Public Confidence in Jurisdiction’s<br />
Governance<br />
Minimal<br />
Minimal<br />
businesses and stops revenue (minimal to severe).<br />
Response and recovery will be in question if not<br />
timely and effective, specifically if electricity and<br />
o<strong>the</strong>r utilities are affected (minimal).<br />
3.212
3.2.15 Major Disease Outbreak<br />
Calculated Priority Risk Index Planning Significance<br />
2.75 Moderate<br />
Description<br />
Infectious diseases are human illnesses caused by microscopic agents, including viruses,<br />
bacteria, parasites, and fungi or by <strong>the</strong>ir toxins. They may be spread by direct contact with an<br />
infected person or animal, ingesting contaminated food or water, vectors such as mosquitoes or<br />
ticks, contact with contaminated surroundings such as animal droppings, infected droplets, or by<br />
aerosolization. Kansas’s public health and health care communities must be prepared to rapidly<br />
identify and contain a wide range of biological agents. Each year local public health<br />
departments and <strong>the</strong> Kansas Department of Health & Environment investigate disease<br />
“outbreaks” of routine illnesses such as food borne illness and sexually transmitted diseases.<br />
T<strong>here</strong> have also been outbreaks of vaccine-preventable diseases such as mumps. During<br />
2009, a pandemic “scare” served as a wake-up call to <strong>the</strong> public health and medical care<br />
communities regarding <strong>the</strong> requirements for personnel, pharmaceuticals, equipment and public<br />
education during large scale disease outbreaks.<br />
While <strong>the</strong>re are a number of biological diseases/agents that are of concern to <strong>the</strong> planning area,<br />
<strong>the</strong> following categories of disease are being addressed in this plan: vaccine preventable<br />
disease, food borne disease, and community associated infections as having significant<br />
recurring impact on <strong>the</strong> potential morbidity of Region L. The following descriptions are general<br />
and it should be noted that individuals may experience more or less severe consequences<br />
based upon <strong>the</strong>ir own circumstances.<br />
While <strong>the</strong>re are a number of biological diseases that are of concern to <strong>the</strong> planning area, <strong>the</strong><br />
planning committee chose to focus its narrative on <strong>the</strong> ones being followed <strong>the</strong> most closely,<br />
which are measles, mumps, pertussis, influenza, pandemic influenza, and food borne illnesses.<br />
Vaccine Preventable Disease<br />
Measles<br />
Measles (rubeola) is a respiratory disease caused by a virus. The disease of measles and <strong>the</strong><br />
virus that causes it share <strong>the</strong> same name. The measles virus normally grows in <strong>the</strong> cells that<br />
line <strong>the</strong> back of <strong>the</strong> throat and lungs. Measles typically causes fever, runny nose, cough and a<br />
rash all over <strong>the</strong> body.<br />
About one out of 10 children with measles also gets an ear infection, and up to one out of 20<br />
gets pneumonia. About one out of 1,000 gets encephalitis, and one or two out of 1,000 die.<br />
While measles is almost gone from <strong>the</strong> United States, it still kills nearly 200,000 people each<br />
year around <strong>the</strong> world. Measles can also make a pregnant woman have a miscarriage or give<br />
birth prematurely. Measles spreads through <strong>the</strong> air by breathing, coughing or sneezing. It is so<br />
contagious that any child who is exposed to it and is not immune will probably get <strong>the</strong> disease.<br />
3.213
Mumps<br />
Mumps is a contagious disease that is caused by <strong>the</strong> mumps virus. Mumps typically start with a<br />
few days of fever, headache, muscle aches, tiredness, and loss of appetite, and is followed by<br />
swelling of salivary glands. Anyone who is not immune from ei<strong>the</strong>r a previous mumps infection<br />
or from vaccination can get mumps.<br />
Most people with mumps recover fully. However, mumps can occasionally cause complications,<br />
and some of <strong>the</strong>m can be serious. Complications may occur even if a person does not have<br />
swollen salivary glands (parotitis) and are more common in people who have reached puberty.<br />
Complications of mumps can include:<br />
• Inflammation of <strong>the</strong> testicles (orchitis) in males who have reached puberty, which rarely<br />
leads to sterility<br />
• Inflammation of <strong>the</strong> brain (encephalitis) and/or tissue covering <strong>the</strong> brain and spinal cord<br />
(meningitis)<br />
• Inflammation of <strong>the</strong> ovaries (oophoritis) and/or breasts (mastitis) in females who have<br />
reached puberty<br />
• Temporary or permanent deafness<br />
Pertussis<br />
Pertussis is a highly communicable, vaccine-preventable disease that lasts for many weeks and<br />
is typically manifested in children with paroxysmal spasms of severe coughing, whooping, and<br />
posttussive vomiting. Major complications are most common among infants and young children<br />
and include hypoxia, apnea, pneumonia, seizures, encephalopathy, and malnutrition. Young<br />
children can die from pertussis. In 2007, 10 children died in <strong>the</strong> United States from Pertussis.<br />
Most deaths occur among unvaccinated children or children too young to be vaccinated.<br />
Children who are too young to be fully vaccinated and those who have not completed <strong>the</strong><br />
primary vaccination series are at highest risk for severe illness. Like measles, pertussis is highly<br />
contagious with up to 90% of susceptible household contacts developing clinical disease<br />
following exposure to an index case. Adolescents and adults become susceptible when<br />
immunity wanes, but can receive a booster shot of <strong>the</strong> new combination vaccine called Tdap.<br />
Influenza<br />
Influenza (flu) is a viral infection of <strong>the</strong> nose, throat, bronchial tubes, and lungs. T<strong>here</strong> are two<br />
main types of virus: A and B. Each type includes many different strains, which tend to change<br />
each year. In Kansas, influenza occurs most often in <strong>the</strong> winter months. Illnesses resembling<br />
influenza may occur in <strong>the</strong> summer months, but <strong>the</strong>se are usually <strong>the</strong> result of o<strong>the</strong>r viruses that<br />
exhibit symptoms commonly referred to as influenza-like illness or ILI.<br />
Influenza is highly contagious and is easily transmitted through contact with droplets from <strong>the</strong><br />
nose and throat of an infected person during coughing and sneezing. Typical symptoms include<br />
headache, fever, chills, cough, and body aches. Although most people are ill for only a few days<br />
some may have secondary infections, such as pneumonia, and may need to be hospitalized.<br />
3.214
Anyone can get influenza, but it is typically more serious in <strong>the</strong> elderly and people with chronic<br />
illnesses such as cancer, emphysema, or diabetes or weak immune systems. It is estimated<br />
that thousands of people die each year in <strong>the</strong> United States from flu or related complications.<br />
Pandemic Influenza<br />
A pandemic is a global disease outbreak. A pandemic flu is a human flu that causes a global<br />
outbreak, or pandemic, of serious illness. A flu pandemic occurs when a new influenza virus<br />
emerges for which people have little or no immunity, and for which <strong>the</strong>re is no vaccine.<br />
This disease spreads easily person-to-person, causing serious illness, and can sweep across<br />
<strong>the</strong> country and around <strong>the</strong> world in a very short time. The Centers for Disease Control and<br />
Prevention (CDC) has been working closely with o<strong>the</strong>r countries and <strong>the</strong> World Health<br />
Organization to streng<strong>the</strong>n systems to detect outbreaks of influenza that might cause a<br />
pandemic and to assist with pandemic planning and preparation.<br />
During 2009 and 2010 health professionals around <strong>the</strong> globe worked to combat <strong>the</strong> H1N1<br />
influenza virus. This relatively mild and stable influenza virus circulated across <strong>the</strong> globe and<br />
caused one of <strong>the</strong> most robust worldwide vaccination campaigns since <strong>the</strong> 1970s. Health<br />
professionals continue to monitor <strong>the</strong> possibility of an avian (bird) flu pandemic associated with<br />
a highly pathogenic avian H5N1 virus. Since 2003, avian influenza has been spreading through<br />
Asia. A growing number of human H5N1 cases contracted directly from handling infected<br />
poultry have been reported in Asia, Europe, and Africa, and more than half <strong>the</strong> infected people<br />
have died. T<strong>here</strong> has been no sustained human-to-human transmission of <strong>the</strong> disease, but <strong>the</strong><br />
concern is that H5N1 will evolve into a virus capable of human-to-human transmission.<br />
An especially severe influenza pandemic could lead to high levels of illness, death, social<br />
disruption, and economic loss. Impacts could range from school and business closings to <strong>the</strong><br />
interruption of basic services such as public transportation, health care, and <strong>the</strong> delivery of food<br />
and essential medicines.<br />
Pandemics are generally thought to be <strong>the</strong> result of novel strains of viruses. Because of <strong>the</strong><br />
process utilized to prepare vaccines, it is impossible to have vaccine pre-prepared to combat<br />
pandemics. A portion of <strong>the</strong> human and financial cost of a pandemic is related to lag time to<br />
prepare a vaccine to prevent future spread of <strong>the</strong> novel virus. In some cases, current vaccines<br />
may have limited activity against novel strains.<br />
Food borne Disease<br />
Norovirus<br />
Noroviruses are a group of related, single-stranded RNA, non-enveloped viruses that cause<br />
acute gastroenteritis in humans. The most common symptoms of acute gastroenteritis are<br />
diarrhea, vomiting, and stomach pain. Norovirus is <strong>the</strong> official genus name for <strong>the</strong> group of<br />
viruses previously described as “Norwalk-like viruses” (NLV).<br />
The incubation period for norovirus-associated gastroenteritis in humans is usually between 24<br />
and 48 hours, but cases can occur within 12 hours of exposure. Norovirus infection usually<br />
3.215
presents as acute-onset vomiting, watery non-bloody diarrhea with abdominal cramps, and<br />
nausea. Low-grade fever also occasionally occurs, and diarrhea is more common than vomiting<br />
in children. Dehydration is <strong>the</strong> most common complication, especially among <strong>the</strong> young and<br />
elderly, and may require medical attention. The symptoms of norovirus infection usually last 24<br />
to 72 hours.<br />
Recovery is usually complete and <strong>the</strong>re is no evidence of any serious long-term sequelae.<br />
Studies with volunteers given <strong>the</strong> virus have shown that asymptomatic infection may occur in as<br />
many as 30% of infections, although <strong>the</strong> role of asymptomatic infection in norovirus<br />
transmission is not well understood.<br />
Noroviruses are transmitted primarily through <strong>the</strong> fecal-oral route, ei<strong>the</strong>r by consumption of<br />
fecally contaminated food or water or by direct person-to-person spread. Environmental and<br />
fomite contamination may also act as a source of infection. Good evidence exists for<br />
transmission due to aerosolization of vomitus that presumably results in droplets contaminating<br />
surfaces or entering <strong>the</strong> oral mucosa and being swallowed. No evidence suggests that infection<br />
occurs through <strong>the</strong> respiratory system.<br />
Noroviruses are highly contagious and as few as 10 viral particles may be sufficient to infect an<br />
individual. During outbreaks of norovirus gastroenteritis, several modes of transmission have<br />
been documented; for example, initial food borne transmission in a restaurant, followed by<br />
secondary person-to-person transmission to household contacts. Although pre-symptomatic<br />
viral shedding may occur, shedding usually begins with <strong>the</strong> onset of symptoms and may<br />
continue for two weeks or more after recovery. It is unclear to what extent viral shedding over 72<br />
hours after recovery signifies continued infectivity.<br />
Salmonellosis<br />
Salmonellosis is an infection with bacteria called Salmonella. Most persons infected with<br />
Salmonella develop diarrhea, fever, and abdominal cramps 12 to 72 hours after infection. The<br />
illness usually lasts four to seven days, and most persons recover without treatment. However,<br />
in some persons, <strong>the</strong> diarrhea may be so severe that <strong>the</strong> patient needs to be hospitalized. In<br />
<strong>the</strong>se patients, <strong>the</strong> Salmonella infection may spread from <strong>the</strong> intestines to <strong>the</strong> blood stream, and<br />
<strong>the</strong>n to o<strong>the</strong>r body sites and can cause death unless <strong>the</strong> person is treated promptly with<br />
antibiotics. The elderly, infants, and those with impaired immune systems are more likely to<br />
have a severe illness.<br />
Salmonella is actually a group of bacteria that can cause diarrheal illness in humans. They are<br />
microscopic living creatures that pass from <strong>the</strong> feces of people or animals to o<strong>the</strong>r people or<br />
o<strong>the</strong>r animals. T<strong>here</strong> are many different kinds of Salmonella bacteria. Salmonella serotype<br />
Typhimurium and Salmonella serotype Enteritidis are <strong>the</strong> most common in <strong>the</strong> United States.<br />
Salmonella germs have been known to cause illness for over 100 years. They were discovered<br />
by an American scientist named Salmon, for whom <strong>the</strong>y are named.<br />
Many different kinds of illnesses can cause diarrhea, fever, or abdominal cramps. Determining<br />
that Salmonella is <strong>the</strong> cause of <strong>the</strong> illness depends on laboratory tests that identify Salmonella<br />
3.216
in <strong>the</strong> stool of an infected person. Once Salmonella has been identified, fur<strong>the</strong>r testing can<br />
determine its specific type.<br />
Location<br />
Region L is vulnerable to outbreaks causes by viruses and bacteria due to <strong>the</strong> dense population<br />
base, which increases <strong>the</strong> amount of institutional settings such as dormitories, daycares, and<br />
o<strong>the</strong>r avenues w<strong>here</strong> groups of people are in contact, which can lead to <strong>the</strong> spread of diseases.<br />
Previous Occurrences<br />
• During <strong>the</strong> summer of 2012, <strong>the</strong> planning area saw <strong>the</strong> closing of outdoor pools early due to<br />
an outbreak of a highly contagious disease caused by <strong>the</strong> cryptosporidium parvum.<br />
Cryptosporidium is a waterborne disease that can cause gastrointestinal illness associated<br />
with diarrhea.<br />
• The Johnson County Department of Health and Environment reported a community-wide<br />
outbreak of Pertussis. 485 cases reported in Johnson County as of December 2012.<br />
Table 3.133 and Table 3.134 show o<strong>the</strong>r reportable diseases, by county, in <strong>the</strong> Region.<br />
Table 3.133. Reportable disease by county for <strong>the</strong> planning area for 2002 – 2011 (part 1<br />
of 2).<br />
County<br />
Amebiasis<br />
Arboviral Disease<br />
Botulism<br />
Campylobacteriosis<br />
Chlamydia<br />
Cholera<br />
Cryptosporidiosis<br />
Ehrlichiosis/Anaplasmosis<br />
Mitigation Planning Region L<br />
Johnson 0 0 0 37 1,312 0 18 2 38 187 3 1 1 3 0 48 7 3<br />
Leavenworth 0 0 0 5 264 0 0 0 1 53 1 0 0 0 0 * 0 0<br />
Wyandotte 0 0 0 7 1,187 0 7 0 6 389 2 0 1 1 0 19 2 1<br />
Total 0 0 0 49 2,763 0 25 2 45 629 6 1 2 4 0 67 9 4<br />
Source: Kansas Department of Health and Environment, *Zero to five cases reported. Not shown to protect confidentiality.<br />
Giardiasis<br />
Gonorrhea<br />
H. influenzae, invasive<br />
Hemolytic Uremic Syndrome (HUS)<br />
Hepatitis A<br />
Hepatitis B, acute<br />
Hepatitis C, acute<br />
HIV/AIDS<br />
Legionellosis<br />
Listeriosis<br />
3.217
Table 3.134. Reportable disease by county for <strong>the</strong> planning area for 2002 – 2011 (part 2<br />
of 2).<br />
County<br />
Lyme Disease<br />
Malaria<br />
Measles<br />
Meningitis, non-HiB, non-Neisseria<br />
Meningococcal Disease<br />
Mumps<br />
Pertussis<br />
Rabies, animal<br />
Salmonellosis<br />
Shiga toxin-producing E. coli<br />
Shigellosis<br />
Strep., Group A, invasive<br />
Mitigation Planning Region L<br />
Johnson 3 4 6 1 2 0 2 0 68 21 8 11 13 8 5 1 7 0 2 16<br />
Leavenworth 2 0 0 0 0 0 0 0 8 0 2 1 1 0 0 0 1 0 0 2<br />
Wyandotte 1 1 0 0 1 0 10 0 20 1 9 3 10 3 3 0 5 0 0 0<br />
Total 6 5 6 1 3 0 12 0 96 22 19 15 24 11 8 1 13 0 2 18<br />
Source: Kansas Department of Health and Environment, *Zero to five cases reported. Not shown to protect confidentiality.<br />
Strep. pneumoniae, invasive<br />
Syphilis, 1° & 2°<br />
Syphilis, early latent<br />
TSE or Prion Disease<br />
Tuberculosis, active<br />
Tularemia<br />
Typhoid Fever<br />
Varicella<br />
Previous Occurrences<br />
• 2012 – Johnson County had a reported 485 cases of pertussis to JCDHE.<br />
• 2011 – The highly contagious disease, cryptosporidium, which is a waterborne disease,<br />
facilitated <strong>the</strong> early closing of pools in <strong>the</strong> planning area.<br />
Previous Occurrences of Pandemic Influenza<br />
T<strong>here</strong> have been four acknowledged pandemics in <strong>the</strong> past century:<br />
• 1918–19 Spanish flu (H1N1): This flu is estimated to have sickened 20-40% of <strong>the</strong><br />
world’s population. Over 20 million people lost <strong>the</strong>ir lives. Between September 1918 and<br />
April 1919, 500,000 Americans died. The flu spread rapidly; many died within a few days<br />
of infection, o<strong>the</strong>rs from secondary complications. The attack rate and mortality was<br />
highest among adults 20-50 years old; <strong>the</strong> reasons for this are uncertain. Recently, <strong>the</strong><br />
origin of <strong>the</strong> pandemic was traced to an outbreak of influenza in Haskell County, Kansas,<br />
in January 1918. Army personnel in Haskell County reported to Camp Funston (now Ft.<br />
Riley), which meant soldiers and <strong>the</strong>ir friends and families likely carried <strong>the</strong> virus from<br />
<strong>the</strong> county to <strong>the</strong> camp. Camp Funston sent a constant stream of soldiers to o<strong>the</strong>r<br />
American locations and to Europe, enabling <strong>the</strong> spread of <strong>the</strong> disease throughout <strong>the</strong><br />
country and around <strong>the</strong> world. By <strong>the</strong> end of 1918, <strong>the</strong> Kansas death toll was around<br />
12,000.<br />
• 1957–58 Asian flu (H2N2): This virus was quickly identified because of advances in<br />
technology, and a vaccine was produced. Infection rates were highest among school<br />
children, young adults, and pregnant women. The elderly had <strong>the</strong> highest rates of death.<br />
A second wave developed in 1958. In total, <strong>the</strong>re were about 70,000 deaths in <strong>the</strong><br />
3.218
United States. Worldwide deaths were estimated between one and two million.<br />
Information about how this pandemic affected Kansas was not available.<br />
• 1968–69 Hong Kong flu (H3N2): This strain caused approximately 34,000 deaths in<br />
<strong>the</strong> United States and more than 700,000 deaths worldwide. It was first detected in Hong<br />
Kong in early 1968 and spread to <strong>the</strong> United States later that year. Those over age 65<br />
were most likely to suffer fatal consequences. This virus returned in 1970 and 1972 and<br />
still circulates today.<br />
• 2009 H1N1 Influenza: The 2009 H1N1 Pandemic Influenza began in Kansas with <strong>the</strong><br />
first identified case on April 24, 2009. Kansas was <strong>the</strong> third state to positively identify this<br />
novel strain of influenza and was <strong>the</strong> first non-border state to confirm a positive<br />
identification. During <strong>the</strong> 2009 H1N1 Pandemic a total of 29 Kansans died as a result of<br />
confirmed infection with <strong>the</strong> disease.<br />
Extent<br />
The severity and magnitude of a Major Disease Outbreak are dependent on <strong>the</strong> etiology of <strong>the</strong><br />
disease. A highly contagious disease could spread like wildfire throughout <strong>the</strong> planning area,<br />
because of <strong>the</strong> density of <strong>the</strong> population. The planning committee has determined that in <strong>the</strong><br />
case of a contagious Major Disease Outbreak, <strong>the</strong> extent could be catastrophic. Multiple deaths<br />
could occur, a complete shutdown of 50% or more of facilities for over 30 days.<br />
Probability of Future Events<br />
While it is impossible to predict outbreaks, <strong>the</strong> local Health Agencies in conjunction with KDHE,<br />
report to, and provide data on, <strong>the</strong> reportable diseases that affect each county, bringing<br />
awareness to <strong>the</strong> population. These agencies also promote vaccinations to prevent against<br />
contagious diseases for adults and children in order to protect against an outbreak. In <strong>the</strong><br />
planning area <strong>the</strong> probability of a future event is ‘Possible’ for a large-scale major disease<br />
outbreak.<br />
Impact and Vulnerability<br />
It is difficult to ascertain <strong>the</strong> Regional cost for <strong>the</strong> impacts of Major Disease Outbreaks.<br />
However, according to The annual impact of seasonal influenza in <strong>the</strong> US: Measuring disease<br />
burden and costs by Molinari et al., nationally <strong>the</strong> economic burden of influenza medical costs,<br />
medical costs plus lost earnings, and <strong>the</strong> total economic burden were $10.4 billion, $26.8 billion<br />
and $87.1 billion respectively. The financial burden of healthcare-associated infections<br />
nationally has been estimated at $33 billion annually. T<strong>here</strong> is no data currently available on<br />
<strong>the</strong> economic impact of previous illness in Kansas. Using pandemic influenza as <strong>the</strong> worst case<br />
scenario for estimating potential losses, <strong>the</strong> Kansas Department of Health and Environment’s<br />
Pandemic Influenza Planning includes <strong>the</strong> following vulnerability estimates. It has been<br />
estimated that a medium-level pandemic could cause, in Kansas:<br />
• Between 229,203 and 534,807 persons may require outpatient care<br />
• Between 5,016 and 11,706 may require hospitalization<br />
• Between 1,163 and 2,714 individuals may die<br />
3.219
The majority of <strong>the</strong>se deaths, hospitalizations, etc. would occur in more highly populated<br />
counties.<br />
The U.S. Centers for Disease Control and Prevention (CDC) estimates 76 million people suffer<br />
foodborne illnesses each year in <strong>the</strong> United States, accounting for 325,000 hospitalizations and<br />
more than 5,000 deaths. Foodborne disease is extremely costly. Health experts estimate that<br />
<strong>the</strong> yearly cost of all foodborne diseases in this country is $5 to $6 billion in direct medical expenses<br />
and lost productivity. Infections with <strong>the</strong> bacteria Salmonella alone account for $1 billion<br />
yearly in direct and indirect medical costs.<br />
The entire planning area is vulnerable to a major disease outbreak. As evidenced by <strong>the</strong><br />
Annual Infectious Disease Summaries completed by <strong>the</strong> KDHE Bureau of Surveillance and<br />
Epidemiology (http://www.kdheks.gov/epi/index.html) <strong>the</strong> planning area has connections with<br />
one or multiple disease outbreaks each year, with few exceptions. Due to <strong>the</strong> density of <strong>the</strong><br />
population base, and <strong>the</strong> higher pediatric and elderly populations, potential casualty losses are<br />
expected to be higher than <strong>the</strong> rest of <strong>the</strong> state. Region L has an advantage over o<strong>the</strong>r Regions<br />
in that <strong>the</strong>y are in closer proximity to more Health professionals and medical capabilities. With<br />
<strong>the</strong> new health care laws being enacted, insurance will potentially become a lesser issue with<br />
access to <strong>the</strong>se facilities in <strong>the</strong> case of a disease outbreak.<br />
Although infectious diseases do not respect geographic boundaries, several populations in <strong>the</strong><br />
planning area are at specific risk to infectious diseases. Communicable diseases are most likely<br />
to spread quickly in institutional settings such as dormitories, long-term care facilities, day care<br />
facilities, schools, etc.<br />
The planning committee ranked <strong>the</strong> disease outbreak as possible based on a pandemic<br />
scenario within <strong>the</strong> next five years. The magnitude of an infectious disease outbreak is related<br />
to <strong>the</strong> ability of <strong>the</strong> public health and medical communities to stop <strong>the</strong> spread of <strong>the</strong> disease.<br />
Most disease outbreaks that cause catastrophic numbers of deaths are infectious in nature,<br />
meaning that <strong>the</strong>y are spread from person to person. The key to reducing <strong>the</strong> catastrophic<br />
nature of <strong>the</strong> event is to stop <strong>the</strong> spread of disease. This is generally done in three ways: (1)<br />
identification and isolation of <strong>the</strong> ill, (2) quarantine of those exposed to <strong>the</strong> illness to prevent<br />
fur<strong>the</strong>r spread, and (3) education of <strong>the</strong> public about methods to prevent transmission. The<br />
public health and health care providers in Region L routinely utilize all three methods to reduce<br />
morbidity and mortality from infectious disease. O<strong>the</strong>r less common ways to contain <strong>the</strong> spread<br />
of any disease outbreaks would be to close schools, day cares, and o<strong>the</strong>r public events. These<br />
measures could have far-reaching economic impacts on <strong>the</strong> community and might shutdown<br />
facilities for 30 days or more. Day care and school closures could have a serious impact on<br />
businesses as parents might not be able to find child care services in order to report to work.<br />
Summary<br />
The entire planning area is vulnerable to a major disease outbreak. The Annual Infectious<br />
Disease Summaries completed by <strong>the</strong> KDHE Bureau of Surveillance and Epidemiology<br />
(http://www.kdheks.gov/epi/index.html) shows that all counties in <strong>the</strong> Region have connections<br />
with multiple disease outbreaks each year.<br />
3.220
The demographics of Region L show a higher vulnerability to disease outbreaks due to <strong>the</strong><br />
dense population base, and <strong>the</strong> number of elderly and very young people. Within <strong>the</strong> planning<br />
area <strong>the</strong>re is also a higher number of institutional settings such as dormitories, long-term care<br />
facilities, day care facilities, schools, etc., which also lend <strong>the</strong>mselves to infectious disease<br />
outbreaks.<br />
Local Mitigation Concerns<br />
• Major Disease Outbreak in <strong>the</strong> human population tends to occur w<strong>here</strong> groups of people<br />
ga<strong>the</strong>r. Region L is <strong>the</strong> most densely population area in Kansas, and as such large<br />
numbers of <strong>the</strong> population are in direct contact daily with each o<strong>the</strong>r. From schools to<br />
sporting events, to concerts, <strong>the</strong> planning area provides many outlets for a major<br />
disease outbreak to spread. Daycares, nursing homes, and hospitals also contribute to<br />
this hazard event, particularly with <strong>the</strong> large over 65 and under 5 year age groups.<br />
• A major area of concern is parents deciding not to vaccinate <strong>the</strong>ir children due to <strong>the</strong><br />
perceived repercussions in doing so. Vaccinations have been tied unscientifically to an<br />
increase in autism and o<strong>the</strong>r disorders which make parents wary of vaccinating <strong>the</strong>ir<br />
children, regardless of <strong>the</strong> scientific benefits. This lack of vaccinations give rise to<br />
incidents of pertussis, mumps, measles, and o<strong>the</strong>r predominantly childhood diseases.<br />
2012 saw an outbreak of Pertussis in Johnson County with 485 reported cases. Lack of<br />
vaccinations in a densely populated area contributes to contagious disease spreading.<br />
Development in Hazard Prone Areas<br />
Buildings, infrastructure, and critical facilities are vulnerable to this hazard when water systems<br />
are affected. Water-borne illness is very common, although <strong>the</strong> drinking water system as a<br />
source of contamination is not. The impacts and potential losses are largely economic and are<br />
dependent on <strong>the</strong> type, extent, and duration of <strong>the</strong> illness. As <strong>the</strong> population in <strong>the</strong> planning area<br />
grows in size, and ages, <strong>the</strong> vulnerability to this hazard is likely to increase.<br />
Johnson County<br />
Table 3.135. Johnson County CPRI: Major Disease Outbreak<br />
Hazard Type Probability Magnitude<br />
Warning<br />
Time Duration CPRI<br />
Planning<br />
Significance<br />
Johnson County<br />
Major Disease Outbreak 3 4 1 4 3.10 High<br />
Leavenworth County<br />
Table 3.136. Leavenworth County CPRI: Major Disease Outbreak<br />
Hazard Type Probability Magnitude<br />
Warning<br />
Time Duration CPRI<br />
Planning<br />
Significance<br />
3.221
Leavenworth County<br />
Major Disease Outbreak 2 4 2 4 2.80 Moderate<br />
Wyandotte County<br />
Table 3.137. Wyandotte County CPRI: Major Disease Outbreak<br />
Hazard Type Probability Magnitude<br />
Warning<br />
Time Duration CPRI<br />
Planning<br />
Significance<br />
Wyandotte County<br />
Major Disease Outbreak 2 3 1 4 2.35 Moderate<br />
Consequence (Impact) Analysis<br />
The information in Table 3.138 provides <strong>the</strong> Impact Analysis of Potential for Detrimental<br />
Impacts of Hazards done for accreditation with <strong>the</strong> Emergency Management Accreditation<br />
Program (EMAP)<br />
Table 3.138. EMAP Impact Analysis: Major Disease Outbreak<br />
Subject Ranking Impacts/Major Disease Outbreak<br />
Health and Safety of<br />
Persons in <strong>the</strong> Area of <strong>the</strong><br />
Incident<br />
Severe<br />
Impact over a widespread area could be severe<br />
depending on type of outbreak and whe<strong>the</strong>r it is a<br />
communicable disease. Casualties are dependent<br />
on warning systems, warning times and <strong>the</strong><br />
availability of vaccines, antidotes, & medical svc.<br />
Responders Severe Impact to responders could be severe, especially if<br />
<strong>the</strong>y reside in <strong>the</strong> area and or <strong>the</strong>ir type of<br />
exposure during response. With proper<br />
precautions and safety nets in place <strong>the</strong> impact is<br />
lessened.<br />
Continuity of Operations Minimal Continuity of Operations will be greatly dependent<br />
on availability of healthy individuals. COOP is not<br />
expected to be exercised (minimal).<br />
Property, Facilities, and<br />
Infrastructure<br />
Minimal<br />
Access to facilities and infrastructure could be<br />
affected until decontamination is completed<br />
Delivery of Services Minimal Delivery of services could be affected if <strong>the</strong>re are<br />
road blocks or mass hysteria of any level (minimal).<br />
Environment Severe Impact could be severe for <strong>the</strong> immediate impacted<br />
area depending on <strong>the</strong> source of <strong>the</strong> outbreak.<br />
Impact could have far-reaching implications if<br />
disease is transferable between humans and<br />
animals or to wildlife.<br />
Economic Conditions Severe Impacts to <strong>the</strong> economy could be severe if <strong>the</strong><br />
disease is communicable. Loss of tourism,<br />
revenue, and business as usual will greatly affect<br />
<strong>the</strong> local economy and <strong>the</strong> state as a whole.<br />
3.222
Subject Ranking Impacts/Major Disease Outbreak<br />
Public Confidence in<br />
Jurisdiction’s Governance<br />
Severe<br />
Response and recovery will be in question if not<br />
timely and effective. Availability of medical<br />
supplies, vaccines, and treatments will come into<br />
question (minimal to severe).<br />
3.223
3.2.16 Radiological<br />
Calculated Priority Risk Index<br />
2.10 Moderate<br />
Planning Significance<br />
Description<br />
A Radiological event in <strong>the</strong> planning area could happen as a result of transportation accidents,<br />
hazardous <strong>material</strong>s, industrial and medical uses and lost or stolen sources to which <strong>the</strong> public<br />
could be exposed, or contaminated, with a high level of radiation. Radiological accidents could<br />
cause injury or death, contaminate property and valuable environmental resources, as well as<br />
disrupt <strong>the</strong> functioning of communities and <strong>the</strong>ir economies. T<strong>here</strong> have been no reported<br />
events of this type in <strong>the</strong> planning area, and all information contained in this hazard profile<br />
remains valid and current for <strong>the</strong> 2013 update.<br />
The State of Kansas has two commercial plants that <strong>the</strong>y plan for: The Wolf Creek Nuclear<br />
Power Plant in Coffey County and <strong>the</strong> Cooper Nuclear Station in Nemaha County. The Kansas<br />
State University’s TRIGA research reactor that supports education, research, training, and<br />
regional industries is also a planning factor in <strong>the</strong> State. Because Region L is not located in <strong>the</strong><br />
10-mile, and only slightly in <strong>the</strong> 50-mile emergency planning zones (EPZ) for <strong>the</strong>se entities (see<br />
figure 3.73a), this mitigation plan will not address <strong>the</strong>m as a hazard to <strong>the</strong> planning area.<br />
However, <strong>the</strong> nuclear fuel rods in transit, along with diagnostic and <strong>the</strong>rapy medical radioactive<br />
<strong>material</strong>s used in hospitals, and o<strong>the</strong>r <strong>material</strong>s, including pharmaceuticals and industrial<br />
sources can be an issue for <strong>the</strong> planning area.<br />
3.224
Figure 3.73a. 50 mile Wolf Creek IPZ, which includes a small portion of Johnson County<br />
Location<br />
Region L is vulnerable to transportation accidents, hazardous <strong>material</strong>, industrial, and medical<br />
uses that have radiation as a component. Johnson County has a higher percentage of hospitals<br />
and medical centers that could facilitate a higher incidence of exposure should an accident or<br />
<strong>the</strong>fts occur. All three counties in <strong>the</strong> planning area have a highly visible transportation node<br />
that could potentially increase <strong>the</strong>ir chance of a spill or accident resulting in radioactive <strong>material</strong><br />
being leaked.<br />
Previous Occurrence<br />
The following is a table of incidences for <strong>the</strong> planning area. Actual narratives could not be<br />
obtained.<br />
3.225
Table 3.139. Radiological Incidences in Region L 2006 - 2009<br />
LICENSEE CITY EVTDATE DESC CO CLASSEVT<br />
McAfee<br />
Henderson & LEAVENWORTH 02/19/2006 LOST/ABANDONED/STOLEN LV Moisture/density gauge stolen, not recovered.<br />
Moisture/density gauge struck by vehicle. No<br />
GEOTECHNOLOGY,<br />
INC.<br />
OVERLAND<br />
PARK 08/09/2006 TRANSPORTATION JO<br />
Honeywell OLATHE 07/27/2006 LOST/ABANDONED/STOLEN JO<br />
ACUREN<br />
INSPECTION INC SHAWNEE 09/04/2006 OTHER JO<br />
Tetra Tech KANSAS CITY 08/14/2007 EQUIPMENT WY<br />
APTUIT INC LENEXA 04/22/2008<br />
APTUIT INC LENEXA 08/20/2008<br />
RADIOACTIVE MATERIAL<br />
REL.<br />
RADIOACTIVE MATERIAL<br />
REL.<br />
KLEINFELDER<br />
CENTRAL INC Lenexa 06/06/2009 LOST/ABANDONED/STOLEN JO<br />
Source: Kansas Department of Health and Environment<br />
Extent<br />
JO<br />
JO<br />
loss of radioactive <strong>material</strong><br />
Lost static eliminator containing. Not recovered.<br />
Radioactive <strong>material</strong> has decayed to non<br />
d t t bl l l<br />
Attempted <strong>the</strong>ft of industrial radiography source.<br />
Security controls prevented <strong>the</strong>ft.<br />
Moisture/density gauge damaged. No loss of<br />
radioactive <strong>material</strong><br />
Release of small amount of radioactive <strong>material</strong>.<br />
No exposures above limits<br />
Release of small amount of radioactive <strong>material</strong>.<br />
No exposures above limits<br />
Moisture/density gauge stolen. Gauge was<br />
recovered.<br />
Should a significant radiological incident occur, <strong>the</strong> planning committee has determined that <strong>the</strong><br />
magnitude would be critical with injuries and/or illnesses resulting in permanent disability. 25% -<br />
50% of property would be severely damaged in <strong>the</strong> incident area, and critical facilities could be<br />
completely shut down for at least two weeks.<br />
Probability of Future Hazard Events<br />
Region L is not within <strong>the</strong> 10- mile or 50-mile emergency planning zones, however, <strong>the</strong>y could<br />
potentially be susceptible to radiological events through <strong>the</strong>ir transportation nodes, hazardous<br />
<strong>material</strong>, industrial, and medical uses which have radiation as a component. The planning area<br />
is a highly urbanized area with medical centers that could be subjected to <strong>the</strong>ft of entities<br />
containing radiological elements. The incidences of radiological release are a rare occurrence<br />
in Region L and have been given a probability of “Unlikely” by <strong>the</strong> planning committee.<br />
Impact and Vulnerability<br />
The potential danger from an accident is exposure to radiation. This exposure could come from<br />
<strong>the</strong> release of radioactive <strong>material</strong> from <strong>the</strong> plant into <strong>the</strong> environment, usually characterized by<br />
a plume (cloud-like formation) of radioactive gases and particles. The major hazards to people<br />
in <strong>the</strong> vicinity of <strong>the</strong> plume are radiation exposure to <strong>the</strong> body from <strong>the</strong> cloud and particles<br />
deposited on <strong>the</strong> ground, inhalation of radioactive <strong>material</strong>s and ingestion of radioactive<br />
<strong>material</strong>s.<br />
The planning area is not within <strong>the</strong> 10 mile or 50 mile emergency planning zone of any nuclear<br />
plant, however <strong>the</strong> transportation nodes increase <strong>the</strong> vulnerability to <strong>the</strong> Region. A truck<br />
transporting fuel rods, or medical equipment that is involved in an accident can put <strong>the</strong> entire<br />
population at risk. Region L is also a very urbanized area with multiple hospitals, elderly care<br />
3.226
and hospice institutions. An accident, spill or <strong>the</strong>ft in one of <strong>the</strong>se places that handle radioactive<br />
<strong>material</strong> on a daily basis could be catastrophic.<br />
Summary<br />
The threat of a radiological incident to <strong>the</strong> region is not through nuclear power plants, but<br />
through everyday uses within <strong>the</strong> workplace. Hazardous <strong>material</strong>s, industrial, and medical uses<br />
that have radiological elements are <strong>the</strong> threat to <strong>the</strong> planning area. The incidents would tend to<br />
be human caused whe<strong>the</strong>r through human error, <strong>the</strong>ft, or neglect.<br />
Local Mitigation Concerns<br />
• Region L is a highly urbanized area that has a dense population and transportation<br />
nodes that are thoroughfares for <strong>the</strong> movement of goods and <strong>material</strong>s to <strong>the</strong> continental<br />
United States. The make-up of <strong>the</strong>se goods and <strong>material</strong>s include <strong>the</strong> movement of<br />
radiological elements at any given time through <strong>the</strong> planning area. Of high concern to<br />
<strong>the</strong> planning committee is a potential accident on <strong>the</strong>ir nodes that could lead to <strong>the</strong><br />
release of radiological <strong>material</strong>s putting <strong>the</strong> citizens, motorists, and tourist at risk of<br />
exposure.<br />
• As <strong>the</strong> most urbanized and densely populated portion of <strong>the</strong> State of Kansas, Region L<br />
has a high medical footprint. The hospitals, Medical Centers, and nursing homes all<br />
utilize medical entities that contain radiological elements that could be subject to release<br />
or even <strong>the</strong>ft.<br />
• The planning area is not within <strong>the</strong> 10 or 50 mile emergency planning zone for a nuclear<br />
power plant incident. However, a concern is if <strong>the</strong> wea<strong>the</strong>r makes for conditions that<br />
could move a plume from Wolf Creek in its direction and thus endanger <strong>the</strong> population.<br />
While this is not an expected concern, it is notable for its potential.<br />
Development in Hazard Prone Areas<br />
Contaminated sites in urban environments are a concern as often <strong>the</strong> sewer system and o<strong>the</strong>r<br />
underground structures can act as conduits for <strong>the</strong> migration of nonsoluble radionuclides in <strong>the</strong><br />
subsurface. This should be a consideration for excavation near or down gradient from a known<br />
contaminated site.<br />
During all lawful operations of radioactive <strong>material</strong>s, <strong>the</strong> licensee is responsible for ensuring that<br />
<strong>the</strong> area around <strong>the</strong> source <strong>material</strong> is cordoned off or shielding is used to prevent unnecessary<br />
exposures. Inspections of practices and security measures are regularly conducted to ensure<br />
compliance and conformity to regulations in order to protect <strong>the</strong> public. The frequency of<br />
inspections can be adjusted in response to perceived risk. Public risk can be reduced by<br />
minimizing <strong>the</strong> duration of exposure, shielding <strong>the</strong> source <strong>material</strong> and maximizing <strong>the</strong> distance<br />
from <strong>the</strong> source.<br />
3.227
Johnson County<br />
Table 3.140. Johnson County CPRI: Radiological<br />
Hazard Type Probability Magnitude<br />
Warning<br />
Time Duration CPRI<br />
Planning<br />
Significance<br />
Johnson County<br />
Radiological 1 3 4 3 2,25 Moderate<br />
Leavenworth County<br />
Table 3.141. Leavenworth County CPRI: Radiological<br />
Hazard Type Probability Magnitude<br />
Warning<br />
Time Duration CPRI<br />
Planning<br />
Significance<br />
Leavenworth County<br />
Radiological 1 3 2 3 1.95 Low<br />
Wyandotte County<br />
Table 3.142. Wyandotte County CPRI: Radiological<br />
Hazard Type Probability Magnitude<br />
Warning<br />
Time Duration CPRI<br />
Planning<br />
Significance<br />
Wyandotte County<br />
Radiological 1 2 4 2 1.85 Low<br />
Consequence (Impact) Analysis<br />
The information in Table 3.143 provides <strong>the</strong> Consequence Analysis of Potential for Detrimental<br />
Impacts of Hazards done for accreditation with <strong>the</strong> Emergency Management Accreditation<br />
Program (EMAP).<br />
Table 3.143. Consequence (Impact) Analysis: Radiological<br />
Subject Ranking Impacts/Radiological<br />
Health and Safety of Persons in <strong>the</strong><br />
Area of <strong>the</strong> Incident<br />
Responders<br />
Continuity of Operations<br />
Property, Facilities, and<br />
Infrastructure<br />
Severe<br />
Severe<br />
Minimal to Severe<br />
Severe<br />
Impact expected to be severe for persons within <strong>the</strong><br />
incident area. Protection capabilities and warning times<br />
will greatly affect <strong>the</strong> severity.<br />
Impact to responders could be severe if not trained and<br />
properly equipped. Responders that are properly<br />
trained and equipped will have a low to moderate<br />
impact.<br />
Temporary relocation could be necessary if government<br />
facilities are in close proximity to <strong>the</strong> incident area. This<br />
temporary relocation could become significant<br />
depending on clean-up (minimal to severe).<br />
Impact within <strong>the</strong> incident area could be severe to<br />
property, facilities, and infrastructure.<br />
3.228
Delivery of Services<br />
Environment<br />
Economic Conditions<br />
Public Confidence in Jurisdiction’s<br />
Governance<br />
Minimal to Severe<br />
Severe<br />
Minimal to Severe<br />
Minimal to Severe<br />
Delivery of services could be affected within and around<br />
<strong>the</strong> affected area (minimal to severe).<br />
Localized impact within <strong>the</strong> incident area could be<br />
severe to native plants, wildlife and natural habitats.<br />
Clean up and remediation will be required.<br />
Economic conditions could be adversely affected and<br />
dependent upon time and length of clean up and<br />
investigation (minimal to severe).<br />
Impact will be dependent on whe<strong>the</strong>r or not <strong>the</strong> incident<br />
could have been avoided by government or nongovernment<br />
entities, clean-up and investigation times,<br />
and outcomes (minimal to severe).<br />
3.229
3.2.17 Soil Erosion and Dust<br />
Calculated Priority Risk Index<br />
1.75 Low<br />
Planning Significance<br />
Description<br />
Soil erosion and dust are both ongoing problems for <strong>the</strong> planning area. Both can cause<br />
significant loss of valuable agricultural soils, damage crops, harm environmental resources and<br />
have adverse economic impacts. Soil erosion in <strong>the</strong> region is largely associated with periods of<br />
drought, when winds are able to move tremendous quantities of exposed dry soil (wind erosion),<br />
and flooding (stream bank erosion). Improper agricultural and grazing practices can also<br />
contribute to soil erosion.<br />
The United States is losing soil 10 times faster than <strong>the</strong> natural replenishment rate, and related<br />
production losses cost <strong>the</strong> country about $37.6 billion each year. On average, wind erosion is<br />
responsible for about 40 percent of this loss and can increase markedly in drought years. Wind<br />
erosion physically removes <strong>the</strong> lighter, less dense soil constituents such as organic matter,<br />
clays and silts. Thus it removes <strong>the</strong> most fertile part of <strong>the</strong> soil and lowers soil productivity,<br />
which can result in lower crop yields or poorer grade pastures and increase economic costs.<br />
Stream bank erosion, which can remove agricultural land and damage or destroy roads and<br />
bridges and utility lines, occurs each year, particularly in <strong>the</strong> spring when high runoff is most<br />
common. A large proportion of all eroded soil <strong>material</strong> ends up in rivers, streams and lakes,<br />
which makes waterways more prone to flooding and contamination and reduces water supply<br />
storage space.<br />
Erosion increases <strong>the</strong> amount of dust carried by wind. Dust can also threaten agriculture and<br />
have economic impacts by reducing seedling survival and growth, increasing <strong>the</strong> susceptibility<br />
of plants to certain stressors, and damaging property and equipment (e.g., clogging machinery<br />
parts). It is also a threat to health and safety. It acts as an abrasive and air pollutant and carries<br />
about 20 human infectious disease organisms (including anthrax and tuberculosis). T<strong>here</strong> is<br />
evidence that <strong>the</strong>re is an association between dust and asthma. Some studies indicate that as<br />
much as 20 percent of <strong>the</strong> incidences of asthma are related to dust. Blowing dust can be severe<br />
enough to necessitate highway closures because of low visibility, which can cause vehicle<br />
accidents. The risk rating for dust or wind erosion is relatively low for <strong>the</strong> planning area.<br />
Location<br />
Soil Erosion and Dust is a concern for <strong>the</strong> planning area. During periods of drought and wind<br />
events, soil erosion and dust can aggravate allergies and asthma, deplete farmland of vital top<br />
soil, disperse cropland seeds, and cause revenue losses due to clogged machinery and crop<br />
loss. Soil Erosion also affects all <strong>the</strong> counties in <strong>the</strong> planning area, as <strong>the</strong>y all border major<br />
rivers.<br />
3.230
Figure 3.74. Locations of Excessive Erosion of Farmland, 1997<br />
Source: Kansas Hazard Mitigation Plan, 2007<br />
Legend<br />
Red: 5,000 acres of highly erodible land<br />
Yellow: 5,000 acres of non-highly erodible land with excessive erosion above <strong>the</strong> tolerable soil erosion<br />
rate.<br />
Previous Occurrences<br />
No prior occurrences are on record for this region. Because <strong>the</strong> effects of soil erosion and dust<br />
are normally cumulative it is difficult to gauge when or if it has happened.<br />
Extent<br />
Magnitude: Negligible. Less than 10% of property is severely damaged. The effects of soil<br />
erosion and dust are generally realized over a period of time. The affects of single affects are<br />
negligible, however cumulatively <strong>the</strong>y can impact agricultural production, and raise health<br />
concerns.<br />
Probability of Future Events<br />
T<strong>here</strong> are no solid historical events that can give a good probability, which resulted in <strong>the</strong><br />
planning committee rating this hazard as “Possible” within <strong>the</strong> next five years.<br />
3.231
Impact and Vulnerability<br />
T<strong>here</strong> have not been any regional or state-wide studies to estimate <strong>the</strong> dollar value of top soil<br />
lost to soil erosion and dust. However, Table 3.144 shows <strong>the</strong> historical estimates for tons per<br />
acres soil lost annually for cultivated cropland, non-cultivated cropland, conservation Reserve<br />
Program (CRP) land and pastureland, for <strong>the</strong> State of Kansas.<br />
Table 3.144. Kansas Average Wind Erosion in Tons/Acre/Year by Broad Cover/Use and<br />
Year<br />
Broad Cover/Use 1982 1987 1992 1997 2002 2007<br />
Cultivated Cropland 2.747 2.963 2.062 1.482 1.463 1.734<br />
Noncultivated<br />
Cropland .907 .830 .887 .339 .413 .501<br />
CRP Land n/a 10.478 .640 .328 .394 .860<br />
Pastureland .009 .016 .022 .015 .019 .034<br />
Source: 2007 National Resources Inventory, http://www.ks.nrcs.usda.gov/technical/ks_nri.html, dated April 22, 2010<br />
Note: Estimated average annual wind erosion is tons per acre per year with margins of error.<br />
The impact of this hazard on <strong>the</strong> Region would be difficult to detect to <strong>the</strong> time factor involved<br />
before noticeable differences in loss of soil were apparent. Wind erosion can cause crop loss,<br />
fertility loss, moisture loss and loss of valuable top soil. Blowing soil causes dirt clouds, drifting<br />
sand and hard feelings between neighbors. Blowing soil cuts off growing crops, covers fences,<br />
closes roads and gives rural and urban communities a bad perception of farmers.<br />
Agricultural land, bridges, and roads are <strong>the</strong> most susceptible to soil erosion and dust. Flood<br />
waters are <strong>the</strong> main culprit to <strong>the</strong>se commodities, as <strong>the</strong> water erodes <strong>the</strong> soil by washing it out.<br />
Dust is exacerbated during drought conditions and can cause havoc on agricultural fields and<br />
can potential be a health hazard for individuals suffering from pulmonary disease.<br />
Local Mitigation Concerns<br />
• The main mitigation concern for this hazard, in <strong>the</strong> planning area, is <strong>the</strong> structural<br />
integrity of <strong>the</strong> bridges and roads as soil erosion occurs. During periods of heavy rains,<br />
soil erosion can wash <strong>the</strong> ground anchor away from <strong>the</strong> support structure causing <strong>the</strong>m<br />
to collapse. This, in turn, puts lives in danger along with property loss.<br />
Development in Hazard Prone Areas<br />
Buildings and infrastructure are generally not affected by dust. Buildings and infrastructure can<br />
be affected by soil erosion if <strong>the</strong> erosion creates an unstable building, bridge or infrastructure.<br />
3.232
Johnson County<br />
Table 3.145. Johnson County CPRI: Soil Erosion and Dust<br />
Hazard Type Probability Magnitude<br />
Warning<br />
Time Duration CPRI<br />
Planning<br />
Significance<br />
Johnson County<br />
Soil Erosion and Dust 2 1 1 4 1.75 Low<br />
Leavenworth County<br />
Table 3.146. Leavenworth County CPRI: Soil Erosion and Dust<br />
Hazard Type Probability Magnitude<br />
Warning<br />
Time Duration CPRI<br />
Planning<br />
Significance<br />
Leavenworth County<br />
Soil Erosion and Dust 2 1 1 4 1.75 Low<br />
Wyandotte County<br />
Table 3.147. Wyandotte County CPRI: Soil Erosion and Dust<br />
Hazard Type Probability Magnitude<br />
Warning<br />
Time Duration CPRI<br />
Planning<br />
Significance<br />
Wyandotte County<br />
Soil Erosion and Dust 2 1 1 4 1.75 Low<br />
Consequence (Impact) Analysis<br />
Wind erosion can cause crop loss, fertility loss, moisture loss and loss of valuable top soil.<br />
Blowing soil causes dirt clouds, drifting sand and hard feelings between neighbors. Blowing soil<br />
cuts off growing crops, covers fences, closes roads and gives rural and urban communities a<br />
bad perception of farmers.<br />
The information in Table 3.148 provides <strong>the</strong> Consequence Analysis of Potential for Detrimental<br />
Impacts of Hazards done for accreditation with <strong>the</strong> Emergency Management Accreditation<br />
Program (EMAP).<br />
Table 3.148. EMAP Consequence Analysis: Soil Erosion and Dust<br />
Subject Ranking Impacts/Soil Erosion and Dust<br />
Health and Safety of Persons<br />
in <strong>the</strong> Area of <strong>the</strong> Incident Minimal<br />
Impact tends to be agricultural; however, dust can be a danger<br />
to susceptible individuals in <strong>the</strong> form of air pollutants (minimal).<br />
Responders<br />
Minimal<br />
With proper preparedness and protection, impact to <strong>the</strong><br />
responders is expected to be minimal.<br />
Continuity of Operations Minimal Minimal expectation for utilization of <strong>the</strong> COOP.<br />
Property, Facilities, and Minimal to Impact to property, facilities, and infrastructure could be severe,<br />
3.233
Subject Ranking Impacts/Soil Erosion and Dust<br />
Infrastructure Moderate depending on <strong>the</strong> site of <strong>the</strong> soil erosion. This could adversely<br />
affect utility poles/lines, and facilities. Dust can also adversely<br />
affect machinery, air conditioners, etc.<br />
Delivery of Services<br />
Minimal<br />
Impact on <strong>the</strong> delivery of services should be non-existent to<br />
minimal, unless roads and utilities are affected.<br />
Environment<br />
Severe<br />
The impact to <strong>the</strong> environment could be severe. Soil erosion<br />
and dust can severely affect farming, ranching, wildlife and<br />
plants due to production losses and habitat changes.<br />
Impacts to <strong>the</strong> economy will be dependent on how extreme <strong>the</strong><br />
soil erosion and dust are. Potentially it could severely affect<br />
crop yield and productivity. Seedling survival and growth is<br />
stressed by erosion and dust, as is <strong>the</strong> top soil which agriculture<br />
Economic Conditions<br />
Public Confidence in<br />
Jurisdiction’s Governance<br />
Minimal<br />
Minimal<br />
is dependent on.<br />
Planning, response, and recovery may be questioned if not<br />
timely and effective (minimal).<br />
3.234
3.2.18 Terrorism/Agro-terrorism<br />
Calculated Priority Risk Index Planning Significance<br />
2.65 Moderate<br />
Description<br />
The Federal Bureau of Investigation defines terrorism as “<strong>the</strong> unlawful use of force or violence<br />
against persons or property to intimidate or coerce a government, <strong>the</strong> civilian population, or any<br />
segment <strong>the</strong>reof, in fur<strong>the</strong>rance of political or social objectives.” The threat of terrorism, both<br />
international and domestic, is ever present, and an attack is likely to occur when least expected.<br />
The Sou<strong>the</strong>rn Poverty Law Center reported that in 2012, <strong>the</strong>re were three active hate groups in<br />
Kansas: one neo-Nazi group (National Socialist Movement in Lansing), one racist skinhead<br />
group (Midland Hammerskins in Wichita), and one anti-gay group (Westboro Baptist Church in<br />
Topeka). O<strong>the</strong>r groups, such as <strong>the</strong> Animal Liberation Front (ALF), Earth Liberation Front (ELF),<br />
and People for <strong>the</strong> Ethical Treatment of Animal (PETA) have sympathizers in <strong>the</strong> state.<br />
Although no major terrorist acts have been attributed to any of <strong>the</strong>se latter groups, <strong>the</strong>ir<br />
involvement in violent acts is meant to disrupt governmental functions and cannot be<br />
discounted.<br />
Agro-terrorism consists of acts to intentionally contaminate, ruin, or o<strong>the</strong>rwise make agricultural<br />
products unfit or dangerous for consumption or fur<strong>the</strong>r use. Agriculture is an important industry<br />
in Kansas. The introduction of a biological agent into <strong>the</strong> population of 6.4 million cattle or <strong>the</strong><br />
nearly 10 million acres of wheat would be financially devastating and would have a major impact<br />
on <strong>the</strong> food supply of <strong>the</strong> state and <strong>the</strong> nation. A major attack involving <strong>the</strong> nation’s food supply<br />
could be launched in a rural area that has little capacity to respond. Potential terrorists’ targets<br />
for livestock disease introduction would be concentration points, such as <strong>the</strong> state’s licensed<br />
feedlots livestock markets. Additionally, Kansas has over 120 agricultural crop-dusters, many of<br />
which are configured for chemical spraying.<br />
Location<br />
The planning area is susceptible to terrorism of any ideology due to <strong>the</strong> large population base,<br />
and <strong>the</strong> available transportation nodes. Terrorist tend to strike w<strong>here</strong> large venues of people<br />
are likely to be, such as malls, Kansas Speedway, Sprint Center, and o<strong>the</strong>r entertainment<br />
venues. Densely populated areas also facilitate terrorist being able to blend in better so <strong>the</strong>y<br />
can strike with as little warning as possible. The transportation corridor within <strong>the</strong> Region is<br />
attractive for <strong>the</strong>ir escape, should a terrorism campaign be successful. Ano<strong>the</strong>r attraction for<br />
terrorist in <strong>the</strong> planning area is <strong>the</strong> Missouri and Kansas River, which could also aid in <strong>the</strong>ir<br />
initial campaign and <strong>the</strong>ir exit strategy.<br />
Agro-terrorism is a concern across <strong>the</strong> state, as well as in Region L. All three counties have an<br />
agricultural footprint that could facilitate an agro-terrorism event that would affect many people.<br />
3.235
Previous Occurrences<br />
No previous terrorist or agro-terrorism events have been noted in <strong>the</strong> planning area. However,<br />
<strong>the</strong>re are sympathies for terrorist groups.<br />
Extent<br />
• January 2009, according to <strong>the</strong> Kansas City Tribune, a chapter of <strong>the</strong> Muslin American<br />
Society (MAS-KC), held a rally in support of Hamas, a group that <strong>the</strong> United States has<br />
cited as being a terrorist group.<br />
• 1989 at a Kansas City auditorium, a masked man described in Arabic <strong>the</strong> ‘oceans of<br />
blood’ spilled in Hamas’ armed attacks on Israeli soldiers and civilians, thanking two<br />
nonprofit organizations for being allies.<br />
• May 2005, Daveed Gartenstein-Ross stated in an interview in The Weekly Standard<br />
that, “MAS is a U.S. front group for <strong>the</strong> Muslim Bro<strong>the</strong>rhood, which was a claim<br />
supported by a Chicago Tribune story that ran in 2004. Their goal is to see sharia law<br />
as <strong>the</strong> law of <strong>the</strong> United States. In 2007 MAS’s ties to <strong>the</strong> Bro<strong>the</strong>rhood were confirmed<br />
as reported by <strong>the</strong> Investigative Project on Terrorism.<br />
While <strong>the</strong>re have not been any terrorist events in <strong>the</strong> planning area, should a worse case<br />
scenario occur <strong>the</strong> planning committee has determined that extent could potentially be<br />
Catastrophic. Event could result in multiple deaths, a complete shutdown of facilities for more<br />
than 30 days, and more than 50% of property could be severely damaged.<br />
Probability of Future Events<br />
Region L could potentially be attractive to a Terrorist Cell due to its central location in <strong>the</strong> United<br />
States, its large population base, and <strong>the</strong> transportation nodes. It is also an area that is full of<br />
historical and cultural buildings, with a military presence. Based on <strong>the</strong> three historical events,<br />
of which none were violent, <strong>the</strong> probability of this hazard affecting <strong>the</strong> planning area with <strong>the</strong><br />
next 10 years is “Unlikely”.<br />
Impact and Vulnerability<br />
The impact to <strong>the</strong> planning area could potentially include all infrastructure, critical facilities,<br />
crops, humans and animals. The degree of impact would be directly related to <strong>the</strong> type of<br />
incident and <strong>the</strong> target. Potential losses could include cost of repair or replacement of damaged<br />
facilities, lost economic opportunities for businesses, loss of human life, injuries to persons, loss<br />
of food supplies, disruption of <strong>the</strong> food supply chain, and immediate damage to <strong>the</strong> surrounding<br />
environment. Secondary effects of infrastructure failure could include public safety hazards,<br />
spread of disease, increased morbidity and mortality among <strong>the</strong> local and distant populations,<br />
public panic and long-lasting damage to <strong>the</strong> environment. Terrorism events are rare<br />
occurrences and specific amounts of estimated losses for previous occurrences are not<br />
available due to <strong>the</strong> complexity and multiple variables associated with <strong>the</strong>se types of hazards.<br />
3.236
In some instances, information about <strong>the</strong>se events is secure and unavailable to <strong>the</strong> public in<br />
order to maintain national security and prevent future attacks.<br />
As discussed previously, it is difficult to quantify potential losses in terms of <strong>the</strong> jurisdictions<br />
most threatened by CBRNE (chemical, biological, radiological, nuclear, and high yield<br />
explosive) attack events due to <strong>the</strong> many variables and human element. T<strong>here</strong>fore, for <strong>the</strong><br />
purposes of this plan, <strong>the</strong> loss estimates will take into account several hypo<strong>the</strong>tical scenarios.<br />
Please note that <strong>the</strong>se hypo<strong>the</strong>tical scenarios are included to provide a sample methodology for<br />
local jurisdictions to estimate potential losses. The hypo<strong>the</strong>tical scenarios include: a chemical<br />
attack, a biological attack, an improvised explosive device (IED) attack, and a radiological<br />
attack. For comparative purposes, <strong>the</strong>se hypo<strong>the</strong>tical attack scenarios will all be staged at <strong>the</strong><br />
same venue, a college football stadium in <strong>the</strong> planning area during a home football game. The<br />
hypo<strong>the</strong>tical stadium is situated on less than one square mile in an urban area and has a<br />
seating capacity of approximately 35,000 persons. Surface area and parking structures are<br />
located adjacent to <strong>the</strong> stadium.<br />
Analysis of vulnerable populations is aided by a program developed by Johns Hopkins<br />
University in 2006 called Electronic Mass Casualty Assessment and `Planning Scenarios<br />
(EMCAPS) http://www.hopkins-cepar.org/EMCAPS/EMCAPS.html which utilizes scenarios<br />
developed by <strong>the</strong> Department of Homeland Security.<br />
****THE FOLLOWING HYPOTHETICAL SCENARIOS ARE FOR INSTRUCTIONAL AND<br />
ILLUSTRATIVE PURPOSES ONLY****<br />
Chemical Attack – Mustard Gas<br />
Scenario Overview: Mustard gas is released from a light aircraft onto <strong>the</strong> stadium during a<br />
home football game. The agent directly contaminates <strong>the</strong> stadium and <strong>the</strong> immediate<br />
surrounding area. This particular type of attack would cause harm to humans and could render<br />
portions of <strong>the</strong> stadium unusable for a short time period in order to allow for a costly clean-up.<br />
T<strong>here</strong> might also be a fear by <strong>the</strong> public of long-term contamination of <strong>the</strong> stadium and<br />
subsequent boycott of games resulting in a loss of revenue and tourism dollars.<br />
Assumptions: (1) The population density at <strong>the</strong> stadium on game day is high – approximately<br />
93 percent of <strong>the</strong> seats, 33,250 are filled and an additional 5,000 persons remain outside <strong>the</strong><br />
stadium in <strong>the</strong> adjacent parking areas. (2) Sulphur mustards are extremely toxic and may<br />
damage eyes, skin and respiratory tract. Death sometimes results from secondary respiratory<br />
infections. (3) The rate of “worried well” is equal to 9 times <strong>the</strong> number of infected cases.<br />
Described Losses:<br />
Severe Eye Injuries (1-2 hours)<br />
Severe Airway Injuries (1-2 hours)<br />
Severe Skin Injuries (2 hrs to days)<br />
Total “Worried Well” Cases (9 times <strong>the</strong> number of affected cases)<br />
Deaths<br />
28,688 persons<br />
28,688 persons<br />
34,425 persons<br />
309,825 persons<br />
765 persons<br />
3.237
Cost of Decontamination @ $12/person (assumes all persons with skin $ 784,896<br />
injuries will require decontamination and approximately 1/10 of <strong>the</strong> worried<br />
well will demand to be decontaminated) - total persons = 65,408<br />
Notes: Victims will require decontamination and both long and short term treatment. Services may need to be suspended at <strong>the</strong><br />
area until all investigations are conducted.<br />
Biological Attack – Pneumonic Plague<br />
Scenario Overview: Canisters containing aerosolized pneumonic plague bacteria are opened<br />
in public bathrooms. Each release location will directly infect 110 people; hence, <strong>the</strong> number of<br />
release locations dictates <strong>the</strong> initial infected population. The secondary infection rate is used to<br />
calculate <strong>the</strong> total infected population. This particular weapon of mass destruction (WMD) attack<br />
method would not cause damages to buildings or o<strong>the</strong>r infrastructure, only to human<br />
populations.<br />
Assumptions: (1) The population density at <strong>the</strong> stadium on game day is high. (2) The<br />
population density of <strong>the</strong> stadium city is high (5,572 persons / sq mile – assumes that <strong>the</strong><br />
normal population is doubled on game day). (3) The number of dispersion devices is 30.<br />
Devices are assumed to be placed in crowded seating areas. (4) Pneumonic plague has a 1-15<br />
percent mortality rate in treated cases and a 40-60 percent mortality rate in untreated cases. (5)<br />
The rate of “worried well” is equal to 9 times <strong>the</strong> number of infected cases.<br />
Described Losses:<br />
Initial Infected Populations<br />
Secondary Infected Population<br />
Total Plague Cases<br />
Total Deaths (Treated Cases 7%)<br />
Total “Worried Well” Cases (9 times <strong>the</strong> number of infected cases)<br />
3,300 persons<br />
6,623 persons<br />
9,923 persons<br />
694 persons<br />
89,307 persons<br />
Improvised Explosive Device Attack – ANFO<br />
Scenario Overview: An Improvised Explosive Device (IED) utilizing an ammonium nitrate/fuel<br />
oil (ANFO) mixture is carried in a panel van to a parking area during a time when stadium<br />
patrons are leaving <strong>the</strong>ir cars and entering <strong>the</strong> stadium and detonated. Potential losses with this<br />
type of scenario include both human and structural assets.<br />
Assumptions: (1) The population density in <strong>the</strong> parking lot during <strong>the</strong> beginning and ending of<br />
<strong>the</strong> games is high, at least 1 person /25 square feet. (2) The quantity of ANFO used is 4,000 lbs,<br />
similar to that used by Timothy McVeigh in <strong>the</strong> Oklahoma City bombing. (3) The Lethal Air Blast<br />
Range for such a vehicle is 200 feet according to <strong>the</strong> Bureau of Alcohol, Tobacco, Firearms and<br />
Explosives (BATF) Standards. (4) The Falling Glass Hazard distance is 2,750 feet according to<br />
BATF Explosive Standards.<br />
Described Losses:<br />
3.238
Total Dead<br />
Total Traumatic Injuries<br />
Total Urgent Care Injuries<br />
Injuries not Requiring Hospitalization<br />
Structures and O<strong>the</strong>r Physical Assets<br />
(Damages would certainly occur to vehicles and<br />
depending on <strong>the</strong> proximity of o<strong>the</strong>r structures, damages<br />
would occur to <strong>the</strong> stadium complex itself. The exact<br />
amount of <strong>the</strong>se damages is difficult to predict because<br />
of <strong>the</strong> large numbers of factors, including <strong>the</strong> type of<br />
structures nearby and <strong>the</strong> amount of insurance held by<br />
vehicle owners. )<br />
1,391 persons<br />
2,438 persons<br />
11,935 persons<br />
4,467 persons<br />
Vehicles –<br />
Replacement cost for approximately 100 vehicles @<br />
$15,000 per vehicle inside <strong>the</strong> 200 ft BATF described<br />
Lethal Air Blast range = $ 150,000<br />
Repair / repainting cost for approximately 500 vehicles<br />
@ $ 4,000 per vehicle inside <strong>the</strong> BATF described Falling<br />
Glass Hazard = $2,000,000<br />
Radiological Dispersion Device – Dirty Bomb Attack<br />
Scenario Overview: An Improvised Explosive Device (IED) utilizing an ammonium nitrate/fuel<br />
oil (ANFO) mixture is carried in a panel van to a parking area during a time when stadium<br />
patrons are leaving <strong>the</strong>ir cars and entering <strong>the</strong> stadium and detonated. Potential losses with this<br />
type of scenario include both human and structural assets. The bomb also contains 2,700<br />
Curies of Cesium-137 (Cs-137).<br />
Assumptions: (1) The population density in <strong>the</strong> parking lot during <strong>the</strong> beginning and ending of<br />
<strong>the</strong> games is high, at least 1 person /25 square feet. (2) The quantity of ANFO used is 4,000 lbs,<br />
similar to that used by Timothy McVeigh in <strong>the</strong> Oklahoma City bombing. (3) The Lethal Air Blast<br />
Range for such a vehicle is 200 feet according to <strong>the</strong> Bureau of Alcohol, Tobacco, Firearms and<br />
Explosives (BATF) Standards. (4) The Falling Glass Hazard distance is 2,750 feet according to<br />
BATF Explosive Standards.<br />
Described Losses:<br />
Total Dead<br />
Total Traumatic Injuries<br />
Total Urgent Care Injuries<br />
Injuries not Requiring Hospitalization<br />
Radiological Poisoning Injuries that Need Aggressive<br />
Treatment<br />
Radiological Poisoning Injuries that Need Non-Critical<br />
Treatment<br />
Radiological Poisoning Injuries that could Self Medicate<br />
with Proper Public Information<br />
Structures and O<strong>the</strong>r Physical Assets<br />
(Damages would certainly occur to vehicles and<br />
depending on <strong>the</strong> proximity of o<strong>the</strong>r structures, damages<br />
would occur to <strong>the</strong> stadium complex itself. The exact<br />
amount of <strong>the</strong>se damages is difficult to predict because<br />
of <strong>the</strong> large numbers of factors, including <strong>the</strong> type of<br />
structures nearby and <strong>the</strong> amount of insurance held by<br />
vehicle owners. )<br />
1,391 persons<br />
2,438 persons<br />
11,935 persons<br />
4,467 persons<br />
13<br />
440<br />
62,378<br />
Vehicles –<br />
Replacement cost for approximately 100 vehicles @<br />
$15,000 per vehicle inside <strong>the</strong> 200 ft BATF described<br />
Lethal Air Blast range = $ 150,000<br />
Repair / repainting cost for approximately 500 vehicles<br />
@ $ 4,000 per vehicle inside <strong>the</strong> BATF described Falling<br />
Glass Hazard = $2,000,000<br />
3.239
The vulnerability of <strong>the</strong> planning area to a terrorism or agro-terrorism event is low. However,<br />
<strong>the</strong> planning significance is moderate in order to be better prepared should this man made<br />
hazard occur. Leavenworth, Johnson, and Wyandotte counties have thousands of small<br />
businesses, along with national and international corporations that, if interrupted by an event,<br />
could potentially cause significant economic loss. The loss of life because of <strong>the</strong> densely<br />
populated area would be catastrophic, and if <strong>the</strong> transportation nodes were targeted could result<br />
in more lives and economic loss as freight does not reach its intended destination. The<br />
resulting paranoia and fear after an attack could set <strong>the</strong> Region back, much as <strong>the</strong> country was<br />
set back after 911. Some of <strong>the</strong> interest in Region L that could be at risk of a terrorist attack,<br />
include:<br />
• Dense Population<br />
• Active Military installation at Fort Leavenworth<br />
• Close vicinity to a nationwide telecommunication provider<br />
• Venues for large amounts of people to congregate<br />
While agri-terrorism is not as huge of a concern in <strong>the</strong> planning area as many areas of <strong>the</strong> state<br />
are, it is still a high visibility area due to its close proximity to large amounts of people and<br />
marketplaces.<br />
A strategic nuclear, biological, or chemical attack on <strong>the</strong> United States could have <strong>the</strong> most<br />
devastating and far-reaching consequences. The use of <strong>the</strong>se weapons against <strong>the</strong> United<br />
States is unlikely. Unfortunately, however, as long as such weapons exist, <strong>the</strong>re is always a<br />
chance that <strong>the</strong>y could be used. The potential for traditional war-related attacks, using<br />
conventional weapons, is a scenario that is more likely to occur, based on currently available<br />
information, however even attacks of that variety are rare. Attackers are likely to have ei<strong>the</strong>r<br />
very specific targets such as Women’s clinics, or desire large publicity from <strong>the</strong> attacks.<br />
It is expected that <strong>the</strong> likelihood of attack is directly related to population density or more likely<br />
to an event that is occurring or to a specific location of importance to <strong>the</strong> attacker. For example,<br />
a large venue event, such as a sporting event attended by tens of thousands of people might be<br />
considered a desirable target. Most large public venues occur in densely populated areas since<br />
those areas are able to provide <strong>the</strong> infrastructure support (hotels, eateries, etc) for large<br />
numbers of people.<br />
Summary<br />
Dense populations, quickly accessible transportation modes, large venues for people, i.e.,<br />
concerts, active military installations, and an industrial and agricultural foothold are all entities<br />
that are attractive to terrorist. All of <strong>the</strong>se entities are provided in Region L, making it vulnerable<br />
to a terrorist/agri-terrorist attack. While this is unlikely to occur, <strong>the</strong> planning significance is<br />
moderate in order to prepare for an event in case it should happen.<br />
3.240
Local Mitigation Concerns<br />
• Because <strong>the</strong> Region is bordered by <strong>the</strong> Missouri River and Kansas River, <strong>the</strong> concern of<br />
waterway access for terrorist is greater. These are also major sources of <strong>the</strong> water<br />
supply for agriculture and drinking water and should <strong>the</strong>se rivers be disrupted due to a<br />
chemical release <strong>the</strong> entire region could potentially be at risk to sickness, death, or<br />
disruption. These rivers also provide electricity to <strong>the</strong> Region and should a terrorist take<br />
out <strong>the</strong> plants it could throw <strong>the</strong> region into economic, sustainment, and personal havoc.<br />
• The location of <strong>the</strong> region in <strong>the</strong> United States is of concern. To hit <strong>the</strong> middle of <strong>the</strong><br />
United States would be a bold move by any terrorist, but it would make <strong>the</strong> point that no<br />
one or place is safe. While this is a difficult concept to mitigate, extra vigilance could<br />
help stop any attack.<br />
• Leavenworth County is rated in <strong>the</strong> top 10 counties in Kansas for <strong>the</strong> number of farms.<br />
Agricultural terrorism is a concern, not only for <strong>the</strong> economy, but also for <strong>the</strong> lives that<br />
depend on <strong>the</strong> agricultural product. Should terrorist use chemicals on <strong>the</strong> crops and<br />
<strong>the</strong>y make it to tables, loss of life could be huge. Tainting <strong>the</strong> livestock feedlots could<br />
also cause a severe disruption in <strong>the</strong> food chain. By hitting Region L with agricultural<br />
terrorism, terrorist could access a lot of people with half <strong>the</strong> work. This is a big concern.<br />
• Of concern for Region L is <strong>the</strong> new Burlington Nor<strong>the</strong>rn and Santa Fe Intermodel that<br />
introduces risk for terrorism.<br />
Development in Hazard Prone Areas<br />
As more and more large public events are held in Region L, more potential may exist for <strong>the</strong>se<br />
venues to become targets of attack. With human-caused hazards such as this that can have<br />
multiple variables involved, increases in development are not necessarily always factors in<br />
determining risk, although <strong>the</strong> physical cost of <strong>the</strong> event may increase with <strong>the</strong> increased or<br />
newly developed areas.<br />
Johnson County<br />
Table 3.149. Johnson County CPRI: Terrorism/Agro-terrorism<br />
Hazard Type Probability Magnitude<br />
Warning<br />
Time Duration CPRI<br />
Planning<br />
Significance<br />
Johnson County<br />
Terrorism/Agro-terrorism 1 4 4 4 2.65 Moderate<br />
3.241
Leavenworth County<br />
Table 3.150. Leavenworth County CPRI: Terrorism/Agro-terrorism<br />
Hazard Type Probability Magnitude<br />
Warning<br />
Time Duration CPRI<br />
Planning<br />
Significance<br />
Leavenworth County<br />
Terrorism/Agro-terrorism 1 4 4 4 2.65 Moderate<br />
Wyandotte County<br />
Table 3.151. Wyandotte County CPRI: Terrorism/Agro-terrorism<br />
Hazard Type Probability Magnitude<br />
Warning<br />
Time Duration CPRI<br />
Planning<br />
Significance<br />
Wyandotte County<br />
Terrorism/Agro-terrorism 1 4 4 4 2.65 Moderate<br />
Consequence (Impact) Analysis<br />
Table 3.152. EMAP Impact Analysis: Terrorism/ Agri-terrorism<br />
Subject Ranking Impacts/Terrorism/Agri-Terrorism<br />
Health and Safety of Persons in<br />
<strong>the</strong> Area of <strong>the</strong> Incident<br />
Severe<br />
Impact could be severe for persons in <strong>the</strong><br />
incident area.<br />
Responders Minimal to Severe Impact to responders could be severe if not<br />
trained and properly equipped. Responders<br />
that are properly trained and equipped will<br />
have a low to moderate impact.<br />
Continuity of Operations Minimal to Severe Depending on damage to facilities/personnel<br />
in <strong>the</strong> incident area, re-location may be<br />
necessary and lines of succession execution<br />
(minimal to severe).<br />
Property, Facilities, and<br />
Infrastructure<br />
Severe<br />
Impact within <strong>the</strong> incident area could be<br />
severe for explosion, moderate to low for<br />
Hazmat.<br />
Delivery of Services Minimal to Severe Delivery of services could be affected within<br />
and around <strong>the</strong> affected area especially if<br />
communications, road and railways, and<br />
facilities incur damage (minimal to severe).<br />
Environment Minimal to Severe Localized impact within <strong>the</strong> incident area could<br />
be severe depending on <strong>the</strong> type of human<br />
caused incident.<br />
Economic Conditions Minimal to Severe Economic conditions could be adversely<br />
affected and dependent upon time and length<br />
of clean up and investigation (minimal to<br />
severe).<br />
Public Confidence in Jurisdiction’s<br />
Governance<br />
Minimal to Severe<br />
Impact will be dependent on whe<strong>the</strong>r or not<br />
<strong>the</strong> incident could have been avoided by<br />
government or non-government entities,<br />
clean-up and investigation times, and<br />
outcomes. (minimal to severe)<br />
3.242
3.2.19 Tornado<br />
Calculated Priority Risk Index<br />
3.70 High<br />
Planning Significance<br />
Description<br />
The National Wea<strong>the</strong>r Service defines a tornado as “a violently rotating column of air extending<br />
from a thunderstorm to <strong>the</strong> ground.” Tornadoes are <strong>the</strong> most violent of all atmospheric storms<br />
and are capable of tremendous destruction. Wind speeds can exceed 250 mph, and damage<br />
paths can be more than one mile wide and 50 miles long. In an average year, more than 900<br />
tornadoes are reported in <strong>the</strong> United States, resulting in approximately 80 deaths and more than<br />
1,500 injuries. High winds not associated with tornadoes are profiled separately in this<br />
document in Section 3.2.21 Windstorm.<br />
Although tornadoes have been documented on every continent, <strong>the</strong>y occur most frequently in<br />
<strong>the</strong> United States east of <strong>the</strong> Rocky Mountains. Kansas is situated in an area that is generally<br />
known as “Tornado Alley.” Climatologically conditions are such that warm and cold air masses<br />
meet in <strong>the</strong> center of <strong>the</strong> country to create conditions of great instability and fast-moving air at<br />
high pressure that can ultimately result in <strong>the</strong> formation of tornado funnels.<br />
Most tornadoes and tornado-related deaths and injuries occur during <strong>the</strong> months of April, May,<br />
and June. However, tornadoes have struck in every month. Similarly, while most tornadoes<br />
occur between 3:00 and 9:00 p.m., a tornado can strike at any time.<br />
Location<br />
Tornadoes can happen anyw<strong>here</strong> in <strong>the</strong> planning area. Figure 3.75 shows <strong>the</strong> tornado activity<br />
in <strong>the</strong> United States. Region L shows 5 – 10 recorded EF3 – EF5 tornadoes between <strong>the</strong> years<br />
1950 and 2006.<br />
3.243
Figure 3.75. Tornado Activity in <strong>the</strong> United States<br />
Source: FEMA 320, Taking Shelter from <strong>the</strong> Storm, 3rd edition<br />
Figure 3.76 shows <strong>the</strong> Wind Zones in <strong>the</strong> United States, with Region L being in Zone IV (250<br />
mph).<br />
3.244
Figure 3.76. Wind Zones in <strong>the</strong> United States<br />
Previous Occurrences<br />
T<strong>here</strong> have been no tornadoes of a catastrophic nature in <strong>the</strong> planning area since <strong>the</strong> last plan.<br />
However, <strong>the</strong>re have been several strong systems that have spawned funnel clouds and EF0<br />
and EF1 tornadoes, resulting in property damage.<br />
• June 2008 - Brief EF0 tornado touchdown on open country near 166th and Kansas<br />
Avenue at 1905CST. No damage reported.<br />
• September 2008 - Several small severe thunderstorms, spawned several brief tornadoes<br />
over parts of east central Kansas, during <strong>the</strong> late afternoon and early evening hours of<br />
Friday, September 12, 2008. Most of <strong>the</strong> tornadoes were observed in open country and<br />
caused no damage. However, one did cause some minor house damage near Desoto<br />
Kansas. All of <strong>the</strong> tornadoes were classified as EF0. Heavy rains also caused flash<br />
flooding in Leavenworth county.<br />
• April 2009 - An Ef1 tornado touched down at 1735 CST near <strong>the</strong> intersection of 238th<br />
Street and Loring Street. The tornado crossed Interstate 70, and <strong>the</strong>n remained nearly<br />
parallel to <strong>the</strong> Interstate, before lifting at 1750 CST, near <strong>the</strong> intersection of Metro<br />
Avenue and 190th Street. Two homes sustained major damage and several barns were<br />
destroyed. Numerous trees were uprooted and several outbuildings were damaged.<br />
3.245
• May 2012 – two tornadoes reported in Ola<strong>the</strong>, KS. This system brought thunderstorms, heavy<br />
rain, and hail to <strong>the</strong> area.<br />
Extent<br />
Tornadoes are classified according to <strong>the</strong> EF- Scale (<strong>the</strong> original F – Scale was developed by<br />
Dr. Theodore Fujita, a renowned severe storm researcher). The Enhanced F- Scale (see Table<br />
3.153) attempts to rank tornadoes according to wind speed based on <strong>the</strong> damage caused. This<br />
update to <strong>the</strong> original F scale was implemented in <strong>the</strong> U.S. on February 1, 2007.<br />
Table 3.153. Enhanced Fujita Scale with Potential Damage<br />
Enhanced Fujita Scale<br />
Scale<br />
Wind Speed<br />
(MPH)<br />
Relative<br />
Frequency<br />
Potential Damage<br />
EF0 65 – 85 53.5% Light. Peels surface off some roofs; some damage to gutters or siding;<br />
branches broken off trees; shallow-rooted trees pushed over.<br />
Confirmed tornadoes with no reported damage (i.e. those that remain<br />
in open fields) are always rated EF0).<br />
EF1 86 – 110 31.6% Moderate. Roofs severely stripped; mobile homes overturned or badly<br />
damaged; loss of exterior doors; windows and o<strong>the</strong>r glass broken.<br />
EF2 111 – 135 10.7% Considerable. Roofs torn off well constructed houses; <strong>found</strong>ations of<br />
frame homes shifted; mobile homes complete destroyed; large trees<br />
snapped or uprooted; light object missiles generated; cars lifted off<br />
ground.<br />
EF3 136 – 165 3.4% Severe. Entire stores of well-constructed houses destroyed; severe<br />
damage to large buildings such as shopping malls; trains overturned;<br />
trees debarked; heavy cars lifted off <strong>the</strong> ground and thrown;<br />
structures with weak <strong>found</strong>ations blown away some distance.<br />
EF4 166 – 200 0.7% Devastating. Well-constructed houses and whole frame houses<br />
completely leveled; cars thrown and small missiles generated.<br />
EF5 >200
2003 was rated as an EF2. Total damages to property were reported as $7.023 million, with 2<br />
injuries during <strong>the</strong> EF2 event.<br />
Between <strong>the</strong> years 2000 and 2012, Wyandotte County had a total of 3 tornado events. Two<br />
were rated as EF0s, and one on 4 May 2002 was rated an EF4. This tornado caused $15.5<br />
million in property damage and resulted in 2 deaths and 30 injuries.<br />
Because it was determined that Region L is in Zone IV due to potential wind speeds, and due to<br />
historic events, <strong>the</strong> planning committee determined that <strong>the</strong> planning area could experience an<br />
EF5 tornado. The magnitude of a tornado this size would be catastrophic. It could result in<br />
multiple deaths, and more than 50% of property could be severely damaged.<br />
Probability of Future Events<br />
All of Kansas is susceptible to tornadoes, and Region L is no exception. While <strong>the</strong>re have not<br />
been any tornadoes greater than an EF1 since <strong>the</strong> last plan, <strong>the</strong> probability remains “Highly<br />
Likely” that an event of any size will occur within <strong>the</strong> next three years.<br />
• Johnson County has had 9 tornado events within <strong>the</strong> last 12 years, resulting in a 75%<br />
chance of this occurring in a given year.<br />
• Leavenworth County has had 10 tornado events within <strong>the</strong> last 12 years, resulting in an<br />
83% chance of a tornado occurring in any given year.<br />
• Wyandotte County has had 3 tornadoes within <strong>the</strong> last 12 years, resulting in a 25%<br />
chance of <strong>the</strong> county having ano<strong>the</strong>r tornado within <strong>the</strong> year.<br />
Impact and Vulnerability<br />
When Figures 3.75 and 3.76 above are compared, it is apparent that Region L is in a high<br />
tornado activity area. Region L resides in Zone IV, which is <strong>the</strong> highest wind zone <strong>the</strong>re is, and<br />
is a good indicator of <strong>the</strong> potential for tornadoes.<br />
Table 3.154 shows <strong>the</strong> incidence of tornadoes and statistics in <strong>the</strong> Region from 1952 – 2011.<br />
Table 3.154. Tornado Statistics for <strong>the</strong> Planning Area, 1952 – 2011<br />
County Tornadoes Fatalities Injuries Longest Path Widest Path<br />
Johnson 38 44 224 69 miles 440 yards<br />
Leavenworth 32 2 63 66 miles 880 yards<br />
Wyandotte 10 2 50 26 miles 500 yards<br />
Source: Tornado Project, http://www.tornadoproject.com/<br />
Insured Crop Loss Data<br />
According to <strong>the</strong> USDA Risk Management Agency, insured crop losses for Region L as a result<br />
of tornado damage for <strong>the</strong> ten year period of 2002-2011 totaled $0.00 as shown in Table 3.155.<br />
3.247
Table 3.155. Crop Insurance Paid for Tornado Damages by Year, 2002-2011<br />
County<br />
Crop Loss<br />
Insurance Paid<br />
Annualized Crop<br />
Loss Insurance<br />
Paid<br />
Johnson $0 $0<br />
Leavenworth $0 $0<br />
Wyandotte $0 $0<br />
Subtotal $0 $0<br />
Source: USDA Risk Management Agency<br />
To determine potential financial loss estimates to tornadoes in <strong>the</strong> planning area, <strong>the</strong> available<br />
historical loss data was annualized to determine future potential losses. The planning team<br />
obtained loss data for <strong>the</strong> National Climatic Data Center (NCDC) storm events (1993 – 2012).<br />
Table 3.156 shows <strong>the</strong> estimates financial loss for each county in Region L.<br />
Table 3.156. Potential Financial Loss Estimates for Tornadoes in Region L<br />
County<br />
Potential Financial Loss (estimated)<br />
Johnson $25,900<br />
Leavenworth $389,100<br />
Wyandotte $775,000<br />
Total $1,190,000<br />
Source: State Hazard Mitigation Plan<br />
Tornadoes have a warning time of approximately 30 minutes or less. They can change paths<br />
quickly, which limits <strong>the</strong> time in which to take shelter. Tornadoes are very difficult to see at<br />
night, and during intense rain and hail, often give very little or no warning of when a tornado is<br />
on <strong>the</strong> ground.<br />
To refine and access <strong>the</strong> relative vulnerability of each of Region L’s counties to tornadoes,<br />
assigned ratings to pertinent factors were examined at <strong>the</strong> county level. These factors are:<br />
social vulnerability index, prior events, prior annualized property damage, building exposure<br />
valuation, population density, crop exposure and annualized crop loss. Then a rating value of 1-<br />
10 was assigned to <strong>the</strong> data obtained for each factor and <strong>the</strong>n weighted equally and factored<br />
toge<strong>the</strong>r to obtain overall vulnerability scores for comparison and to determine <strong>the</strong> most<br />
vulnerable counties.<br />
Tornados that touch-down can create a unique path of destruction unlike a wide-spread winter<br />
storm event that can affect entire regions of <strong>the</strong> State. So using <strong>the</strong> prior events as a factor can<br />
give <strong>the</strong> perception that a county has a higher overall vulnerability to tornadoes.<br />
The following are <strong>the</strong> data sources for <strong>the</strong> rating factors: Social Vulnerability Index for Kansas<br />
counties from <strong>the</strong> Hazards and Vulnerability Research Institute at <strong>the</strong> University of South<br />
3.248
Carolina, National Climatic Data Center (NCDC) storm events (2006 – 2012), U.S. Census<br />
Bureau (2010), USDA’s Census of Agriculture (2007) and USDA Risk Management Agency<br />
(2002 – 2011). It was determined that for tornado, historical events and property damages are<br />
needed back to 1993 to adequately describe <strong>the</strong> tornado hazard in <strong>the</strong> planning area.<br />
Table 3.157 below provides <strong>the</strong> factor’s amount per county that are considered for tornado<br />
vulnerability.<br />
3.249
Table 3.157. Vulnerability of Region L Counties Factor Amounts for Tornadoes<br />
SoVI Rating<br />
(1-5)<br />
Prior Events<br />
1993-2012<br />
Property<br />
Damages<br />
Annualized<br />
Property Damage<br />
Total Building<br />
Exposure ($000)<br />
Population<br />
Density<br />
Crop Exposure<br />
Crop Loss<br />
Insurance Paid<br />
Annualized Crop<br />
Loss Insurance<br />
Paid<br />
County<br />
Mitigation Planning Region L<br />
Johnson 1 8 $518,000 $25,900 $43,871,468 1,149.60 $29,472,000 $0 $0<br />
Leavenworth 1 15 $7,782,000 $389,100 $4,877,783 164.7 $20,983,000 $0 $0<br />
Wyandotte 3 3 $15,500,000 $775,000 $12,066,666 1,039.00 $0 $0 $0<br />
Total 26 $23,800,000 $1,190,000 $60,815,917 $50,455,000 $0 $0<br />
Note: The Census of Agriculture did not publish crop exposure in Wyandotte County to avoid disclosure of individual operations.<br />
3.250
The following are <strong>the</strong> 1 – 10 ranges for <strong>the</strong> tornado vulnerability factor ratings. The Social<br />
Vulnerability Index is in a range of 1- 5. To give Social Vulnerability Index <strong>the</strong> same weight as<br />
<strong>the</strong> o<strong>the</strong>r factors, <strong>the</strong> numbers were multiplied by two.<br />
Table 3.158. Ranges for Tornado Vulnerability Factor Ratings<br />
Ratings<br />
Social<br />
Vulnerability<br />
Prior Events<br />
Annualized<br />
Property<br />
Damage<br />
1 3 - 7<br />
$500 -<br />
$500,000<br />
$500,001 -<br />
2 1 8 - 12 $1,000,000<br />
$1,000,001 -<br />
3 13 - 17 $1,300,000<br />
$1,300,001 -<br />
4 2 18 - 22 $2,000,000<br />
$2,000,001 -<br />
5 23 - 27 $3,000,000<br />
$3,000,001 -<br />
6 3 28 - 32 $4,000,000<br />
$4,000,001 -<br />
7 33 - 37 $7,000,000<br />
$8,000,001 -<br />
8 4 38 - 42 $11,000,000<br />
$11,000,001 -<br />
9 43 - 47 $13,000,000<br />
Above<br />
10 5 48 - 54 $13,000,001<br />
Source: State Hazard Mitigation Plan<br />
Building<br />
Exposure<br />
Valuation<br />
$117,421 -<br />
$4,492,825<br />
$4,492,826 -<br />
$8,868,229<br />
$8,868,230 -<br />
$13,243,634<br />
$13,243,635 -<br />
$17,619,039<br />
$17,619,040 -<br />
$21,994,444<br />
$21,994,445 -<br />
$26,369,848<br />
$26,369,849 -<br />
$30,745,253<br />
$30,745,254 -<br />
$35,120,658<br />
$35,120,659 -<br />
$39,496,062<br />
$39,496,063 -<br />
$43,871,468<br />
Population<br />
Density *<br />
Crop Exposure<br />
Annualized<br />
Crop Loss<br />
Insurance Paid<br />
1.6 -<br />
116.3 0 - $18,548,500 $0 - $1,000<br />
116.4 - $18,548,501 -<br />
231.1 $32,126,000 $1,001 - $2,000<br />
231.2 - $32,126,001 -<br />
345.9 $45,703,500 $2,001 - $3,000<br />
346 - $45,703,501 -<br />
460.7 $59,281,000 $3,001 - $4,000<br />
460.8 - $59,281,001 -<br />
575.5 $72,858,500 $4,0001- $5,000<br />
575.6 - $72,858,501 -<br />
690.3 $86,436,000 $5,001 - $6,000<br />
690.4 - $86,436,001 -<br />
805.1 $100,013,500 $6,001 - $7,000<br />
805.2 - $100,031,501 -<br />
919.9 $113,591,000 $7,001 - $8,000<br />
920- $113,591,001 -<br />
1,034.7 $127,168,500 $8,001 - $9,000<br />
1,034.8 - $127,168,501 -<br />
1,149.6 $140,746,000 $9,001 and up<br />
Table 3.159 provides <strong>the</strong> calculated ranges applied to determine <strong>the</strong> Medium, Medium-High and<br />
High vulnerable counties and Table 3.160 provides <strong>the</strong> seven rating values assigned that were<br />
considered in determining overall vulnerability to tornadoes. The entire Region is vulnerable to<br />
tornadoes so <strong>the</strong> overall ranges started with Medium and goes higher.<br />
Table 3.159. Ranges for Overall tornado Vulnerability<br />
Ranges Medium Medium-High High<br />
9 - 19 20 – 29 30 - 40<br />
Source: State Hazard Mitigation Plan<br />
3.251
Table 3.160. Vulnerability of Kansas Counties to Tornadoes<br />
SoVI Converted<br />
Rating<br />
Prior Event<br />
Rating<br />
Annualized<br />
Property Damage<br />
Rating<br />
Bldg Exposure<br />
Valuation Rating<br />
Population<br />
Density Rating<br />
Crop Exposure<br />
Rating<br />
Annualized Crop<br />
Insurance Rating<br />
Overall<br />
Vulnerability<br />
Rating<br />
County<br />
M i t i g a t i o n P l a n n i n g R e g i o n L<br />
Johnson 2 2 1 10 1 0 2 1 2 8 Medium-High<br />
Leavenworth 2 3 1 2 2 2 1 1 3 Medium<br />
Wyandotte 6 1 2 3 1 0 1 1 2 4 Medium-High<br />
Source: State Hazard Mitigation Plan<br />
Winter Storm<br />
Vulnerability<br />
Table 3.161 lists <strong>the</strong> top 10 vulnerable counties in Kansas relative to each o<strong>the</strong>r concerning<br />
tornadoes. The one EF5 destructive tornado in Greensburg, Kiowa County was deemed a<br />
statistical outlier and was not included in this analysis. O<strong>the</strong>rwise, Kiowa County would be <strong>the</strong><br />
highest rated county.<br />
Table 3.161. Top 10 Vulnerable Counties in Kansas for Tornadoes.<br />
Mitigation<br />
Planning Region<br />
Overall<br />
Vulnerability<br />
Rating<br />
Winter Storm<br />
Vulnerability<br />
County<br />
G Sedgwick 34 High<br />
E Barton 32 High<br />
B Rush 30 Medium-High<br />
G Harper 29 Medium-High<br />
A Sherman 28 Medium-High<br />
E Stafford 28 Medium-High<br />
L Johnson 28 Medium-High<br />
A Sheridan 27 Medium-High<br />
B Rooks 27 Medium-High<br />
F Republic 27 Medium-High<br />
Source: State Hazard Mitigation Plan<br />
Mobile Home Vulnerability<br />
Of <strong>the</strong> more than 560 people killed in <strong>the</strong> U.S between 2001 and 2010 by tornadoes, 51 percent<br />
were in mobile homes, according to <strong>the</strong> National Oceanic and Atmospheric Administration.<br />
According to <strong>the</strong> 2012 Kansas Severe Wea<strong>the</strong>r Awareness Week packet, people living in mobile<br />
homes are killed because of tornadoes at a rate 20 times higher than people living in permanent<br />
homes. Only 33 percent of those who died were in permanent structures, and 16 percent were<br />
outside a home.<br />
Yet mobile homes make up only about 7 percent of <strong>the</strong> nation's housing. They represent about<br />
5.2 percent of homes in Kansas, with 65,184 units according to <strong>the</strong> U.S. Census Bureau.<br />
3.252
Table 3.162 provides <strong>the</strong> number of mobile home units per county according to <strong>the</strong> U.S. Census<br />
Bureau American Community Survey 2005 – 2009.<br />
Table 3.162. Number of Mobile Home Units per County<br />
County<br />
Number of Mobile Homes<br />
Johnson 1,392<br />
Leavenworth 873<br />
Wyandotte 1,676<br />
Total 3,941<br />
Source: State Hazard Mitigation Plan<br />
Summary<br />
Johnson, Leavenworth, and Wyandotte Counties are all vulnerable to tornado activity. Johnson<br />
County has had <strong>the</strong> most tornadoes in <strong>the</strong> Region, with a total of 38 reported, and 244 fatalities<br />
in <strong>the</strong> last 60 years. Wyandotte County has had <strong>the</strong> least with 10 reported tornado events. The<br />
vulnerability of this Region is enhanced due to its dense population, housing, and business<br />
industries. In western Kansas people and homes tend to be spread out more than <strong>the</strong>y are in<br />
Region L, so even when an EF1 tornado hits <strong>the</strong> area it can do severe damage due to <strong>the</strong><br />
density of <strong>the</strong> population and <strong>the</strong> close proximity of private and public structures.<br />
Local Mitigation Concerns<br />
• A big concern of a tornado in any region is <strong>the</strong> potential loss of life and destruction of<br />
property. Region L is a densely population area, with housing and buildings in close<br />
proximity to each o<strong>the</strong>r. Even an EF0 tornado has <strong>the</strong> ability to inflict damages when it<br />
is spawned in an urban area.<br />
• Region L has a high industrial and business footprint, nationally and internationally.<br />
Many of <strong>the</strong>se buildings are predominantly windows, which during a tornado event can<br />
inflict damaging personal injury to people inside <strong>the</strong> building and outside of <strong>the</strong> building.<br />
Should a tornado hit <strong>the</strong> business area of any of <strong>the</strong>se counties <strong>the</strong> damage to humans<br />
could be catastrophic due to glass and flying debris.<br />
• The Region recognizes that poor resiliency in existing buildings, particularly residential,<br />
are an issue. Training and Education in structural resiliency for Code Enforcers is an<br />
essential component for ensuring new construction is built to sustain damages.<br />
Development in Hazard Prone Areas<br />
New development anyw<strong>here</strong> in Kansas will be susceptible to tornado impacts. New<br />
manufactured housing development will be most susceptible to damage, particularly if not<br />
anchored properly. The extent of new manufactured housing development is not known.<br />
Of <strong>the</strong> more than 560 people killed in <strong>the</strong> U.S between 2001 and 2010 by tornadoes, 51 percent<br />
were in mobile homes, according to <strong>the</strong> National Oceanic and Atmospheric Administration.<br />
3.253
Folks living in mobile homes die because of tornadoes at a rate 20 times higher than people<br />
living in permanent homes as stated in <strong>the</strong> 2012 Kansas Severe Wea<strong>the</strong>r Awareness Week<br />
packet.<br />
Only 33 percent of those who died were in permanent structures, and 16 percent were outside a<br />
home.<br />
Johnson County<br />
Table 3.163. Johnson County CPRI: Tornado<br />
Hazard Type Probability Magnitude<br />
Warning<br />
Time Duration CPRI<br />
Planning<br />
Significance<br />
Johnson County<br />
Tornado 4 4 4 1 3.70 High<br />
Leavenworth County<br />
Table 3.164. Leavenworth County CPRI: Tornado<br />
Hazard Type Probability Magnitude<br />
Warning<br />
Time Duration CPRI<br />
Planning<br />
Significance<br />
Leavenworth County<br />
Tornado 4 3 4 1 3.40 High<br />
Wyandotte County<br />
Table 3.165. Wyandotte County CPRI: Tornado<br />
Hazard Type Probability Magnitude<br />
Warning<br />
Time Duration CPRI<br />
Planning<br />
Significance<br />
Wyandotte County<br />
Tornado 2 4 4 1 2.80 Moderate<br />
Consequence (Impact) Analysis<br />
The information in Table 3.166 provides <strong>the</strong> Consequence Analysis of Potential for Detrimental<br />
Impacts of Hazards done for accreditation with <strong>the</strong> Emergency Management Accreditation<br />
Program (EMAP).<br />
3.254
Table 3.166. EMAP Consequence Analysis: Tornado<br />
Subject Ranking Impacts/Tornado<br />
Health and Safety of Persons in<br />
<strong>the</strong> Area of <strong>the</strong> Incident<br />
Responders<br />
Continuity of Operations<br />
Property, Facilities, and<br />
Infrastructure<br />
Delivery of Services<br />
Environment<br />
Economic Conditions<br />
Public Confidence in<br />
Jurisdiction’s Governance<br />
Severe<br />
Minimal<br />
Minimal to Severe<br />
Minimal to Severe<br />
Minimal to Severe<br />
Minimal to Severe<br />
Minimal to Severe<br />
Minimal to Severe<br />
Impact of <strong>the</strong> immediate area could be severe depending<br />
on whe<strong>the</strong>r individuals were able to seek shelter and get<br />
out of <strong>the</strong> trajectory of <strong>the</strong> tornado. Casualties are<br />
dependent on warning systems and warning times.<br />
Impact to responders is expected to be minimal unless<br />
responders live within <strong>the</strong> affected area.<br />
Temporary/Permanent relocation may be necessary if<br />
government facilities experience damage (minimal to<br />
severe).<br />
Localized impact could be severe in <strong>the</strong> trajectory path.<br />
Roads, buildings, and communications could be adversely<br />
affected. Damage could be severe.<br />
Delivery of services could be affected if <strong>the</strong>re is any<br />
disruption to <strong>the</strong> roads and/or utilities due to damages<br />
sustained. Depending on <strong>the</strong> incident size <strong>the</strong> damage<br />
could be severe.<br />
Impact will be severe for <strong>the</strong> immediate impacted area.<br />
Impact will lessen as distance increases from <strong>the</strong><br />
immediate incident area.<br />
Impacts to <strong>the</strong> economy will greatly depend on <strong>the</strong><br />
trajectory of <strong>the</strong> tornado. If a jurisdiction takes a direct hit<br />
<strong>the</strong>n <strong>the</strong> economic conditions will be severe. With an<br />
indirect hit <strong>the</strong> impact could still be anyw<strong>here</strong> from low to<br />
severe.<br />
Response and recovery will be in question if not timely<br />
and effective. Warning systems and warning time will also<br />
be questioned (minimal to severe)<br />
3.255
3.2.20 Utility/Infrastructure Failure<br />
Calculated Priority Risk Index<br />
3.00 High<br />
Planning Significance<br />
Description<br />
Critical infrastructure involves several different types of facilities and systems including: electric<br />
power, transportation routes, natural gas and oil pipelines, water and sewer systems, storage<br />
networks, and internet/telecommunications systems. Failure of utilities or o<strong>the</strong>r components of<br />
<strong>the</strong> infrastructure in <strong>the</strong> planning area can seriously impact public health, functioning of<br />
communities and <strong>the</strong> economy. Disruption of any of <strong>the</strong>se services could result from <strong>the</strong><br />
majority of <strong>the</strong> natural, technological, and manmade hazards described in this plan. In addition<br />
to a secondary or cascading impact from ano<strong>the</strong>r primary hazard, utilities and infrastructure can<br />
fail as a result of faulty equipment, lack of maintenance, degradation over time, or accidental<br />
damage such as damage to buried lines or pipes during excavation.<br />
Electric Power<br />
Disruption of electric power supply can be a cascading impact of several o<strong>the</strong>r hazards. The<br />
most common hazards analyzed in this plan that disrupt power supply are: flood, tornado,<br />
windstorm, and winter wea<strong>the</strong>r as <strong>the</strong>se hazards can cause major damage to power<br />
infrastructure. To a lesser extent, extreme temperatures, dam and levee failure, lightning, and<br />
terrorism can disrupt power. Extreme heat can disrupt power supply when air conditioning use<br />
spikes during heat waves which can cause brownouts. Dam and levee failure, are similar to<br />
flood in that infrastructure can be damaged or made inaccessible by water. Lightning strikes<br />
can damage substations and transformers, but is usually isolated to small areas of outage.<br />
Many forms of terrorism could impact power supply ei<strong>the</strong>r by direct damage to infrastructure or<br />
through cyber-terrorism targeting power supply networks.<br />
The largest electric utility providers in Region L are Kansas City Power & Light, Westar Energy,<br />
City of Gardner, and Leavenworth-Jefferson Elec. Coop., Inc.<br />
Figure 3.77, Figure 3.78, and Figure 3.79 show <strong>the</strong> location of <strong>the</strong> electric lines for Johnson,<br />
Leavenworth, and Wyandotte Counties, respectively.<br />
3.256
Figure 3.77. Map of Johnson County Electric Lines<br />
3.257
Figure 3.78. Map of Leavenworth County Electric Line<br />
3.258
Figure 3.79. Map of Wyandotte County Electric Lines<br />
3.259
Transportation Routes<br />
Transportation routes can also be impacted by many of <strong>the</strong> hazards discussed in this plan. The<br />
primary hazards that impact transportation are: Flood, Hazardous Materials, and Winter<br />
Wea<strong>the</strong>r. Flood events, both riverine and flash flood can make roads and bridges impassible<br />
due to high water. Flood waters can also erode or scour road beds and bridge abutments.<br />
Highway and railroad accidents that involve hazardous <strong>material</strong>s can impact transportation<br />
routes as road and railroad closures, as well as evacuations may be necessary. Winter<br />
Wea<strong>the</strong>r frequently impacts transportation as roads become treacherous or impassible due to<br />
ice and snow. Secondary hazards that impact transportation routes include: dam and levee<br />
failure if routes are in inundation areas, extreme temperatures can cause damage to pavement<br />
(especially asphalt), land subsidence can damage roads/railroads if subsidence area is near <strong>the</strong><br />
route, landslide can cause debris and rock falls onto roadways, terrorism can target routes,<br />
tornado can directly damage infrastructure or deposit debris in routes, wildfire can cause<br />
decreased visibility on transportation routes due to smoke, and windstorm can cause vehicle<br />
accidents or overturning (particularly cargo vans).<br />
Natural Gas and Oil Pipelines<br />
Primary hazards that can impact natural gas and oil pipelines are earthquake, expansive soils,<br />
land subsidence, landslide, and terrorism.<br />
Water and Sewer Systems<br />
The primary hazards that can impact water supply systems are: drought, flood, hazardous<br />
<strong>material</strong>s, and terrorism. The primary hazard that impacts sewer systems is flood.<br />
Storage Networks<br />
If damaged, storage networks and infrastructure can disrupt government and business<br />
functions. All state government and most local governments and businesses utilize redundant<br />
systems to decrease vulnerability to outages. All hazards that can disrupt electric power can<br />
also impact storage networks as electricity is required to power <strong>the</strong> infrastructure. In addition,<br />
<strong>the</strong> networks <strong>the</strong>mselves can be damaged if <strong>the</strong> hazard impacts <strong>the</strong> facility w<strong>here</strong> <strong>the</strong> network is<br />
located. The primary hazards that can cause direct damage are: flood, lightning, terrorism, and<br />
tornado.<br />
Internet/Telecommunications<br />
Internet and telecommunications infrastructure can be impacted by a number of hazards as<br />
well. The types of hazards and impacts to internet and telecommunications infrastructure are<br />
very similar to electric power supply. Land line phone lines often utilize <strong>the</strong> same poles as<br />
electric lines. So, when wea<strong>the</strong>r events such as windstorm or winter wea<strong>the</strong>r cause lines to<br />
break, both electricity and telephone services experience outages. With <strong>the</strong> increasing<br />
utilization of cellular phones, hazard events such as tornado that can damage cellular repeaters<br />
can cause outages. In addition, during any hazard event, internet and telecommunications<br />
systems can become overwhelmed due to <strong>the</strong> surge in call/usage volume.<br />
3.260
Location<br />
The entire planning area in Region L is vulnerable to Utility/Infrastructure Failure due to<br />
equipment or maintenance failure, or as a secondary hazard when <strong>the</strong> primary hazard is a<br />
Tornado, Winter Storm, Wind Storm, Lightning, Terrorism, expansive soil, drought, etc. All of<br />
<strong>the</strong>se have <strong>the</strong> capacity to directly hit <strong>the</strong> utility and infrastructure of <strong>the</strong> planning area, or<br />
indirectly such as with earth movement during a drought or expansive soil, or flood event.<br />
Previous Occurrences<br />
Extent<br />
• FEMA-4035-DR: Flooding—September 23, 2011: Four counties in nor<strong>the</strong>ast Kansas<br />
were declared for flooding that occurred from June 1 to August 1, 2011 along <strong>the</strong><br />
Missouri River. The counties included are Atchison, Doniphan, Leavenworth, and<br />
Wyandotte. Damages as a result of this event were estimated to be nearly $7.4 Billion<br />
and primarily involved damages to roads and bridges.<br />
• FEMA-1741-DR—February, 2008 (December 6-19, 2007): An ice storm caused<br />
numerous power outages and approximately 130,000 Kansas customers were without<br />
power. Specifically, Kansas Rural Electric Cooperatives reported 49,000 customers<br />
without power, Westar reported 76,000 customers, Kansas City Power & Light reported<br />
4,300 customers, and Kansas City, Kansas Board of Public Utilities reported 800<br />
customers without power. FEMA’s Public Assistance costs were $355,651,857 for this<br />
disaster.<br />
Magnitude: Negligible. Event is not expected to severely damage more than 10% of property,<br />
or closure of critical facilities for more than 24 hours. Injuries and illnesses would be treatable<br />
with first aid.<br />
Probability of Future Events<br />
Utitlity/Infrstructure failure are normally tied to o<strong>the</strong>r wea<strong>the</strong>r hazards such as tornadoes, winter<br />
storms, and high winds. Region L has a high propensity for wea<strong>the</strong>r that is conducive to <strong>the</strong>se<br />
hazards, which in turn makes <strong>the</strong> possibility of a utility/infrastructure failure a high reality. The<br />
planning committee has determined that this event is Highly Likely during <strong>the</strong> calendar year.<br />
Impact and Vulnerability<br />
Since utility/infrastructure failure is generally a cascading impact of o<strong>the</strong>r hazards, it is not<br />
possible to quantify estimated potential losses specific to this hazard due to <strong>the</strong> variables<br />
associated with affected population, duration of outages, etc...<br />
Although <strong>the</strong> limitless variables make it difficult to estimate future losses on a statewide basis,<br />
FEMA has developed standard loss of use estimates in conjunction with <strong>the</strong>ir Benefit-Cost<br />
Analysis methodologies to estimate <strong>the</strong> cost of lost utilities on a per-person, per-use basis (See<br />
Table 3.167.<br />
3.261
Table 3.167. FEMA Standard Values for Loss of Service for Utilities and Roads/Bridges<br />
Loss of Electric Power<br />
Total Economic Impact<br />
Loss of Potable Water<br />
Total Economic Impact<br />
Loss of Wastewater<br />
Total Economic Impact<br />
Loss of Road/Bridge<br />
Vehicle Delay Detour<br />
Vehicle Delay Mileage<br />
Source: State Hazard Mitigation Plan and FEMA.gov.<br />
Cost of Complete Loss<br />
$126 per person per<br />
Cost of Complete Loss<br />
$93 per person per<br />
Cost of Complete Loss<br />
$41 per person per<br />
Cost of Complete Loss<br />
$38.15 per vehicle per<br />
$0.55 per mile (or<br />
The impact of a major utility/infrastructure event would be dependent on time of year, location,<br />
and event length. If a major event happened in <strong>the</strong> middle or summer or winter during extreme<br />
temperatures than <strong>the</strong> elderly and very young population could be at risk as <strong>the</strong>y try to stay cool<br />
or warm. If a major transportation node collapsed due to expansive soil, lives could be lost and<br />
services could be disrupted. The whole population could be effected if <strong>the</strong> event went on for a<br />
considerable length of time.<br />
While every community in <strong>the</strong> State is at risk to utility/infrastructure failure, <strong>the</strong> vulnerability is<br />
somewhat elevated in <strong>the</strong> nor<strong>the</strong>ast area of <strong>the</strong> State due to <strong>the</strong> higher population density,<br />
development, and economic activities of <strong>the</strong> Kansas City Metropolitan Area that would be<br />
disrupted by a major infrastructure failure event.<br />
In recent years, regional electric power grid system failures in <strong>the</strong> western and nor<strong>the</strong>astern<br />
United States have demonstrated that similar failures could happen in Kansas. This vulnerability<br />
is most appropriately addressed on a multi-state regional or national basis.<br />
Summary<br />
Region L is vulnerable to this hazard, mainly as a secondary repercussion from o<strong>the</strong>r hazards<br />
that occur in <strong>the</strong> area. Tornadoes, Winter Storms, Floods, Expansive Soils, Extreme<br />
Temperatures, Drought, and many more play a role I <strong>the</strong> integrity of <strong>the</strong> utility/infrastructure<br />
arena. While most events of utility or infrastructure failure only last for 3 to 5 days, it can be<br />
detrimental to <strong>the</strong> safety of people, property and structural integrity. Because it is a highly<br />
urbanized region, a glitch or failure in utilities/infrastructure could upset everyday life, seamless<br />
travel, and <strong>the</strong> ability to survive, especially within our vulnerable populations.<br />
Local Mitigation Concerns<br />
• Utility/Infrastructure Failure is often times associated with ano<strong>the</strong>r hazard which<br />
compounds <strong>the</strong> issue. Should a major blackout affect <strong>the</strong> Region, it could potentially<br />
affect up to a million people with responders trying to find shelter and food to sustain<br />
<strong>the</strong>se lives, regardless of <strong>the</strong> extreme temperature caveat. Roads and Bridges could be<br />
damaged which hurt <strong>the</strong> supply routes, as well as any people traveling on <strong>the</strong>m at <strong>the</strong><br />
time.<br />
3.262
• The vulnerable population is a particular concern during a utility/infrastructure failure<br />
event. They are not always able to get around on <strong>the</strong>ir own and rely on mobile food<br />
banks for sustenance. Any disruption in service could potentially put <strong>the</strong>se lives in<br />
danger.<br />
• Rolling blackouts could see an increase in <strong>the</strong>ft and violence, particularly in <strong>the</strong> urban<br />
areas. The economy could suffer as a result, as well as <strong>the</strong> community’s confidence in<br />
<strong>the</strong>ir officials to keep <strong>the</strong>m safe.<br />
• Ano<strong>the</strong>r potential issue is <strong>the</strong> occurrence of unmapped utility lines. Wyandotte County<br />
discovered unmapped fiber optic lines that went from <strong>the</strong>ir county into Leavenworth that<br />
belonged to <strong>the</strong> Department of Homeland Security. This discovery came about by<br />
accident due to <strong>the</strong> lack of communication. Regardless of whe<strong>the</strong>r a county owns <strong>the</strong><br />
lines or not, it is imperative that <strong>the</strong>y know what is buried within <strong>the</strong>ir jurisdiction.<br />
Development in Hazard Prone Areas<br />
Increases in development and population growth in <strong>the</strong> planning area, also increases <strong>the</strong><br />
demand for utilities as well as <strong>the</strong> level of impacts when <strong>the</strong> utilities fail.<br />
Johnson County<br />
Table 3.168. Johnson County CPRI: Utility/Infrastructure Failure<br />
Hazard Type Probability Magnitude<br />
Warning<br />
Time Duration CPRI<br />
Planning<br />
Significance<br />
Utility/Infrastructure<br />
Failure<br />
Johnson County<br />
3 2 4 3 2.85 Moderate<br />
Leavenworth County<br />
Table 3.169. Leavenworth County CPRI: Utility/Infrastructure Failure<br />
Hazard Type Probability Magnitude<br />
Warning<br />
Time Duration CPRI<br />
Planning<br />
Significance<br />
Utility/Infrastructure<br />
Failure<br />
Leavenworth County<br />
4 1 4 2 2.90 Moderate<br />
Wyandotte County<br />
3.263
Table 3.170. Wyandotte County CPRI: Utility/Infrastructure Failure<br />
Hazard Type Probability Magnitude<br />
Warning<br />
Time Duration CPRI<br />
Planning<br />
Significance<br />
Utility/Infrastructure<br />
Failure<br />
Wyandotte County<br />
4 1 4 3 3.00 High<br />
Consequence (Impact) Analysis<br />
The information in Table 3.171 provides <strong>the</strong> Consequence Analysis of Potential for Detrimental<br />
Impacts of Hazards done for accreditation with <strong>the</strong> Emergency Management Accreditation<br />
Program (EMAP).<br />
Table 3.171. EMAP Consequence Analysis: Utility/Infrastructure Failure<br />
Subject Ranking Impacts/Utility/Infrastructure Failure<br />
Health and Safety of Persons in<br />
<strong>the</strong> Area of <strong>the</strong> Incident<br />
Moderate to Severe<br />
Localized impact will be moderate to severe for<br />
persons with functional and access needs, and<br />
<strong>the</strong> elderly, depending on length of failure and<br />
time of year.<br />
Responders Minimal Impact to responders will be minimal if properly<br />
trained and equipped.<br />
Continuity of Operations Minimal Due to <strong>the</strong> nature of <strong>the</strong> hazard, <strong>the</strong> COOP plan is<br />
not expected to be activated, however, if <strong>the</strong><br />
recovery time is excessive than temporary<br />
relocation may become necessary (minimal).<br />
Property, Facilities, and<br />
Infrastructure<br />
Minimal<br />
Impact is dependent on <strong>the</strong> nature of <strong>the</strong> incident,<br />
e.g., electric, water, sewage, gas, communication<br />
disruptions). (Minimal)<br />
Delivery of Services Minimal Delivery of services could be affected within and<br />
around <strong>the</strong> affected area (minimal).<br />
Environment Minimal Impact, depending on <strong>the</strong> nature of <strong>the</strong> incident,<br />
should be minimal.<br />
Economic Conditions Minimal Economic conditions could be adversely affected<br />
depending on damages suffered, extent of<br />
damages, etc. (minimal)<br />
Public Confidence in<br />
Jurisdiction’s Governance<br />
Minimal<br />
Impact will be dependent on whe<strong>the</strong>r or not <strong>the</strong><br />
government or non-government entities response,<br />
recovery, and planning were not timely and<br />
effective (minimal).<br />
3.264
3.2.21 Wildfire<br />
Calculated Priority Risk Index<br />
2.80 Moderate<br />
Planning Significance<br />
Description<br />
Wildfires in <strong>the</strong> planning area typically originate in pastures or accidents following <strong>the</strong> ignition of<br />
dry grasses (by natural or human sources). Ranchers and farmers intentionally ignite<br />
vegetation to restore soil nutrients or alter <strong>the</strong> existing vegetation growth. These fires have <strong>the</strong><br />
potential to get out of control and erupt into wildfires. Wildfires are also associated with lightning<br />
and drought conditions, as dry conditions make vegetation more flammable. Wildfires may also<br />
originate, or spread to forested areas, or o<strong>the</strong>r areas with concentrations of woody fuel that can<br />
cause wildfires to increase in intensity and spread. The Eastern Red Cedar is of particular<br />
concern in <strong>the</strong> planning area. This invasive evergreen species can take over fence rows and<br />
un-planted fields, adding to wildfire fuel and risk. Additionally, this type of fuel, as well as o<strong>the</strong>r<br />
tree plantings near structures can cause structures to be consumed by wildfires, putting<br />
inhabitants at risk.<br />
Wildfires tend to peak in March and April when people are conducting controlled burns in<br />
grassland and fields When conditions green up later in <strong>the</strong> summer and <strong>the</strong> humidity is higher,<br />
<strong>the</strong> risk of wildfires is generally lower. This trend, however, does not continue in years of<br />
extreme drought when hot and dry wea<strong>the</strong>r prevail.<br />
The wild land/urban interface is <strong>the</strong> area w<strong>here</strong> human improvements such as homes, ranches<br />
and farms come in contact with <strong>the</strong> wild lands. Urban expansion has driven <strong>the</strong> increased<br />
building of homes in wild land areas. W<strong>here</strong>ver people are living in or adjacent to wild land<br />
areas, <strong>the</strong> threat of wildfire exists. As <strong>the</strong> rural population increases, so does <strong>the</strong> risk to life and<br />
property from wildfire.<br />
Location<br />
The entire planning area is susceptible to wildfire events. The wildfire risk in Region L is of a<br />
higher concern than its western county counterparts. This is largely because of <strong>the</strong> population<br />
growth in <strong>the</strong> eastern part of <strong>the</strong> State resulting in increasing encroachment into <strong>the</strong><br />
wildland/urban interface. Additionally, <strong>the</strong> effects of smoke emissions from wildfires are more of<br />
a concern in <strong>the</strong> more urban eastern counties due to higher populations in those areas.<br />
According to <strong>the</strong> 2011 Kansas Forest Action Plan, with <strong>the</strong> exception of Eastern Red<br />
cedar/hardwood, most forest types in <strong>the</strong> region do not pose significant fire management issues.<br />
However, grasslands are a different story. These areas and <strong>the</strong> wild land-urban interface w<strong>here</strong><br />
development has occurred are <strong>the</strong> focus of wild land fire management issues in <strong>the</strong> area.<br />
3.265
Previous Occurrences<br />
Extent<br />
• 8 August 2012 – More than 100 acres burned when a stolen car was set on fire in a field<br />
that led to <strong>the</strong> blaze. The fire was in <strong>the</strong> vicinity of 183 rd Street and State Line Road, and<br />
187 th Street and Mission Road. A trailer and all-terrain vehicle were also set on fire.<br />
Firefighters stopped <strong>the</strong> fires from damaging any homes.<br />
• 19 August 2012 – 5 grass fires were ultimately put out in Johnson County in <strong>the</strong> cities of<br />
Ola<strong>the</strong> (2), Lenexa, Mize and Shawnee. No buildings were damaged.<br />
• 2012 – Wyandotte county saw a fire that began at 57 th Street and I70 spreading toward<br />
Muncie Drive. Fire Crews stopped <strong>the</strong> fire about 100 feet from four or five homes in <strong>the</strong><br />
rural, wooded area.<br />
• 21 August 2012 – three grass fires in Leavenworth County, one begin near Tonganoxie<br />
were put out after burning 50 acres and 7 acres and <strong>the</strong> o<strong>the</strong>r of undetermined acreage.<br />
The seven acre fire near Tonganoxie destroyed one mobile home.<br />
In <strong>the</strong> year 2012 alone <strong>the</strong> planning area saw four reported incidents for Wildfire. One mobile<br />
home was destroyed and four homes were threatened. With <strong>the</strong> incidence of drought that has<br />
affected <strong>the</strong> state, as well as <strong>the</strong> rise in average temperatures; <strong>the</strong> extent of wildfires could<br />
potentially be greater. The planning committee has determined that during this planning period<br />
<strong>the</strong> Magnitude is: Negligible. Less than 10% of property is severely damaged and injuries<br />
and/or illnesses are treatable with first aid. Shutdown of critical facilities and services would not<br />
exceed 24 hours.<br />
Probability of Future Events<br />
Historical records for this hazard are difficult to obtain. T<strong>here</strong> is no consistency of when to<br />
report a wildfire, or what criteria should be followed. When a wildfire is located in a city often<br />
times <strong>the</strong> authorities do not report it as a wildfire, even though it may have been present in an<br />
open dry field. However, wildfires do occur on an annual basis in <strong>the</strong> planning area resulting in<br />
this hazard’s probability being “Highly Likely”.<br />
Impact and Vulnerability<br />
According to <strong>the</strong> USDA’s Risk Management Agency on Crop Insurance, no payments have<br />
been made for loss of crops due to wildfire in <strong>the</strong> planning area. However, as seen in previous<br />
occurrences, property loss, although rare in this region, does happen as seen with <strong>the</strong> mobile<br />
home that was burned.<br />
Although some data is available from <strong>the</strong> National Fire Incident Reporting System (NFIRS) in<br />
terms of previous events, this data has limitations in providing useful statistical data for analysis.<br />
The most problematic issues are that not all fire departments report to NFIRS and of those that<br />
report, not all incidents are reported. This current lack of local level, (i.e. fire district or county),<br />
3.266
equirements and a past lack of enforcement of state statutes has led to a lack of fire<br />
occurrence data for both prescribed burns and wildfires being available. Changes in<br />
enforcement of wildfire reporting requirements at <strong>the</strong> state level, as well as prescribed fire<br />
reporting requirements that are part of <strong>the</strong> EPA-mandated Kansas Flint Hills Smoke<br />
Management Plan (approved in 2011), will give <strong>the</strong> Kansas Forest Service a much greater<br />
opportunity to begin using real-time fire occurrence data to assist in making <strong>the</strong> best fire<br />
management decisions.<br />
In light of <strong>the</strong> data limitations associated with available statistics, and with <strong>the</strong> publication of <strong>the</strong><br />
2011 Kansas Forest Action Plan, <strong>the</strong> planning committee determined that <strong>the</strong> best available<br />
data for <strong>the</strong> vulnerability analysis for <strong>the</strong> Wildfire Hazard is <strong>the</strong> ‘Weighted Sum’ analysis that<br />
was completed and utilized to develop a ‘Wildfire Risk’ composite layer as part of <strong>the</strong> Forest<br />
Action Plan.<br />
The ‘Wildfire Risk’ composite layer was developed using a ‘Weighted Sum’ analysis to combine<br />
six data layers produced from a combination of eight separate datasets. In close consultation<br />
with <strong>the</strong> Kansas Forest Service’s Fire Management Coordinator and o<strong>the</strong>r Fire Management<br />
staff six data inputs were developed to represent Wildfire Risk in Kansas. These data inputs<br />
and <strong>the</strong>ir corresponding analysis weight are listed below:<br />
1) Wildland Urban Interface—from 3 data sets (.85)<br />
2) ISO Fire Station Coverage Gaps (.75);<br />
3) Conservation Reserve Program Lands (.60);<br />
4) Eastern Redcedar in Grasslands (.75);<br />
5) ‘Moderate’ Fire Potential risk and (.53);<br />
6) ‘High’ Fire Potential risk (.80).<br />
For more detailed descriptions of <strong>the</strong>se six data layers, see pages 27-28 of <strong>the</strong> Kansas Forest<br />
Action Plan, http://www.kansasforests.org/assessment.shtml. The six data layer inputs were<br />
combined using <strong>the</strong> ‘Weighted sum’ analysis. The resulting raster contains values ranging from<br />
0 to 3.48. The higher <strong>the</strong> numbers (darker shading) indicate higher wildfire risk. Figure 3.80 is<br />
<strong>the</strong> resulting composite map. Figure 3.81 that follows provides a map indicating <strong>the</strong> mean score<br />
for each county. Then Table 3.168 provides a table of <strong>the</strong> mean score for each county.<br />
3.267
Figure 3.80. Issues that Create Wildfire Risk—Composite Map<br />
Source: Kansas Forest Service, Kansas Forest Action Plan, 2011<br />
3.268
Figure 3.81. Wildfire Risk (by Mean County Score)<br />
Source: Kansas Forest Service<br />
3.269
Table 3.168. Mean Wildfire Risk Score for Kansas Counties by Mitigation Planning<br />
Region<br />
County<br />
Mean Wildfire Risk Score<br />
Mitigation Planning Region L<br />
Johnson 0.52408075333<br />
Leavenworth 0.41779085994<br />
Wyandotte 0.28411415219<br />
Planning Region Average 0.40866192182<br />
Source: State Mitigation Plan 2013<br />
When <strong>the</strong> mean wildfire risk score is compared to all <strong>the</strong> counties in Kansas, Region L did not<br />
rate in <strong>the</strong> Top 10.<br />
Community Wildfire Protection Plans<br />
One way for communities at risk to wildfire to reduce <strong>the</strong>ir overall vulnerability is development of<br />
Community Wildfire Protection Plans (CWPP) to identify specific areas at risk and actions that<br />
can be taken to reduce risk. The Healthy Forests Restoration Act (HFRA) provided<br />
communities with an opportunity to influence w<strong>here</strong> and how federal agencies implement fuel<br />
reduction projects on federal lands. A CWPP is <strong>the</strong> most effective way to take advantage of this<br />
opportunity. Additionally, communities with Community Wildfire Protection Plans in place are<br />
given priority for funding of HFRA hazardous fuels reduction projects.<br />
CWPPs can take a variety of forms, based on <strong>the</strong> needs of <strong>the</strong> people involved in <strong>the</strong>ir<br />
development. They may address issues such as wildfire response, hazard mitigation,<br />
community preparedness, or structure protection—or all of <strong>the</strong> above. The three main<br />
components of a CWPP are:<br />
1) Collaboration between all affected or potentially affected jurisdictions,<br />
2) Assessment of <strong>the</strong> wildfire hazards in an area that leads to recommendation for prioritized<br />
fuel reduction, and<br />
3) A section on recommendations towards reducing structural ignitability.<br />
In Kansas, <strong>the</strong> Kansas Forest Service coordinated with several Local Hazard Mitigation<br />
Planning efforts to integrate a Community Wildfire Hazard Assessment into Local Hazard<br />
Mitigation Plans. By doing so, <strong>the</strong> requirements of <strong>the</strong> main components of <strong>the</strong> CWPP have<br />
been met. The language in <strong>the</strong> HFRA provides maximum flexibility for communities to<br />
determine <strong>the</strong> substance and detail of <strong>the</strong>ir plans and <strong>the</strong> procedures <strong>the</strong>y use to develop <strong>the</strong>m.<br />
Table 3.169 shows <strong>the</strong> counties in <strong>the</strong> Region and <strong>the</strong>ir status into <strong>the</strong> Community wildfire<br />
Protection Plan, and as a Firewise Community.Wyandotte’s CWPP is pending, while Johnson<br />
County’s CWPP has been approved. Leavenworth has not begun <strong>the</strong> process at <strong>the</strong> writing of<br />
this plan.<br />
3.270
Table 3.169. Participation in CWPP and Firewise<br />
County Community Wildfire Protection Plan Firewise<br />
No Pending Approved C it<br />
Johnson X No<br />
Leavenworth X No<br />
Wyandotte X No<br />
Firewise Communities<br />
Taking steps to become a Firewise Community is ano<strong>the</strong>r way communities with wildfire risk<br />
can reduce <strong>the</strong>ir wildfire vulnerability. The five steps of Firewise recognition<br />
http://www.firewise.org/communities/usa-recognition-program/program-criteria.aspx<br />
• Obtain a wildfire risk assessment as a written document from your state forestry agency or<br />
fire department.<br />
• Form a board or committee, and create an action plan based on <strong>the</strong> assessment.<br />
• Conduct a “Firewise Day” event.<br />
• Invest a minimum of $2 per capita in local Firewise actions for <strong>the</strong> year.<br />
• Submit an application to your state Firewise liaison<br />
Currently no county in Region L is a Firewise Community. However, whe<strong>the</strong>r or not<br />
communities have a CWPP or have taken steps to become a Firewise Community, many have<br />
adopted burn ban ordinances or placed specific bans on burning during conditions favorable to<br />
wildfire, such as drought.<br />
Summary<br />
Wildfires have been, currently are, and will be an issue for <strong>the</strong> planning area. Whe<strong>the</strong>r through<br />
natural means, or human caused, wildfires have <strong>the</strong> potential to put lives and property in<br />
danger. While <strong>the</strong>re are many causes of wildfires, lightning and human caused top <strong>the</strong> list.<br />
Once an area has had a wildfire, and <strong>the</strong> land resides on a slope of any etiology, <strong>the</strong> chance of<br />
a landslide and soil erosion is increased. The planning area is known for its hill elevations and<br />
<strong>the</strong> construction that has been done for residences and businesses on <strong>the</strong>se slopes. T<strong>here</strong> is<br />
also marked presence of open land in <strong>the</strong> area that is also prone to wildfires. These types of<br />
fires can spread quickly, especially during drought conditions, endangering homes, businesses,<br />
crops, livestock, and property.<br />
Local Mitigation Concerns<br />
• The wind in Kansas normally blows in an eastwardly direction, so that when wildfires are<br />
present outside of <strong>the</strong> planning area, <strong>the</strong> smoke blows into <strong>the</strong>ir Region. This could be a<br />
health concern for all of <strong>the</strong> population, but specifically <strong>the</strong> vulnerable population that are<br />
elderly, young, and/or have health issues such as asthma, emphysema, etc.<br />
• Wildfires in <strong>the</strong> Region can be a contributor to landslides and soil erosion. When a<br />
wildfire burns off all <strong>the</strong> grass it takes <strong>the</strong> ‘anchor’ for <strong>the</strong> soil. Subsequently, when it<br />
3.271
ains this soil is easily washed away. When on a slope it could potentially result in a<br />
landslide.<br />
• Because it is a densely population region with residences and buildings in close<br />
proximity to each o<strong>the</strong>r, a wildfire in <strong>the</strong> area could be catastrophic to home and<br />
business owners. A fire in a region like Region L would have no problem jumping from<br />
structure to structure.<br />
• The more urban an area is, <strong>the</strong> more diversity in <strong>the</strong> population. Individuals who have<br />
not been trained in wildfire prevention are more prevalent, increasing <strong>the</strong> incidence of<br />
fires that can spread to wildfire proportions.<br />
• Wild fire suppression in <strong>the</strong> rural areas is a concern due to lack of an expanded water<br />
supply.<br />
• Large grass fires could cause power outages and high water use demands causing<br />
water suppliers to have limited drinking water supply as well as limited water storage for<br />
fire protection.<br />
Development of Hazard Prone Areas<br />
Agricultural and wildlands have a higher risk for wildfires than urban areas. However, <strong>the</strong><br />
wildland/urban interface is a high risk area as <strong>the</strong> counties in Region L see population growth<br />
and a subsequent growth in housing construction encroach more and more into what used to be<br />
wildland.<br />
Johnson County<br />
Table 3.170. Johnson County CPRI: Wildfire<br />
Hazard Type Probability Magnitude<br />
Warning<br />
Time Duration CPRI<br />
Planning<br />
Significance<br />
Johnson County<br />
Wildfire 4 1 4 2 2.90 Moderate<br />
Leavenworth County<br />
Table 3.171. Leavenworth County CPRI: Wildfire<br />
Hazard Type Probability Magnitude<br />
Warning<br />
Time Duration CPRI<br />
Planning<br />
Significance<br />
Leavenworth County<br />
Wildfire 4 1 4 1 2.80 Moderate<br />
3.272
Wyandotte County<br />
Table 3.172. Wyandotte County CPRI: Wildfire<br />
Hazard Type Probability Magnitude<br />
Warning<br />
Time Duration CPRI<br />
Planning<br />
Significance<br />
Wyandotte County<br />
Wildfire 4 1 4 1 2.80 Moderate<br />
Consequence (Impact) Analysis<br />
The information in Table 3.173 provides <strong>the</strong> Consequence Analysis of Potential for Detrimental<br />
Impacts of Hazards done for accreditation with <strong>the</strong> Emergency Management Accreditation<br />
Program (EMAP).<br />
Table 3.173. EMAP Consequence Analysis: Wildfire<br />
Subject Ranking Impacts/Wildfire<br />
Health and Safety of Persons in <strong>the</strong><br />
Area of <strong>the</strong> Incident<br />
Severe<br />
Impact of <strong>the</strong> immediate area could be<br />
severe for affected areas and moderate to<br />
light for o<strong>the</strong>r less affected areas.<br />
Responders Minimal to Severe Impact to responders is could be severe<br />
depending on <strong>the</strong> size and scope of <strong>the</strong><br />
fire, especially for fire fighters. Impact will<br />
be low to moderate for support<br />
responders with <strong>the</strong> main threat being<br />
smoke inhalation.<br />
Continuity of Operations Minimal to Severe Temporary relocation may be necessary if<br />
government facilities experience damage<br />
(minimal to severe).<br />
Property, Facilities, and<br />
Infrastructure<br />
Severe<br />
Localized impact could be severe to<br />
facilities and infrastructure in <strong>the</strong> incident<br />
area. Property, Facilities, and<br />
infrastructure are all vulnerable to<br />
destruction by wildfire.<br />
Delivery of Services Minimal to Severe Delivery of services could be affected if<br />
<strong>the</strong>re is any disruption to <strong>the</strong> roads and/or<br />
utilities due to damages sustained<br />
(minimal to severe).<br />
Environment Severe Impact will be severe for <strong>the</strong> immediate<br />
impacted area with regards to trees,<br />
bushes, animals, crops, etc. Impact will<br />
lessen as distance increases from <strong>the</strong><br />
immediate incident area.<br />
Economic Conditions Minimal to Moderate Impacts to <strong>the</strong> economy could be<br />
moderate in <strong>the</strong> immediate area.<br />
Public Confidence in Jurisdiction’s<br />
Governance<br />
Minimal to Severe<br />
Response and recovery will be in question<br />
if not timely and effective. Evacuation<br />
orders, shelters availability could be called<br />
in to question (minimal to severe).<br />
3.273
3.2.22 Windstorm<br />
Calculated Priority Risk Index<br />
3.05 High<br />
Planning Significance<br />
Description<br />
Relatively frequent strong winds are a wea<strong>the</strong>r characteristic of Kansas. Kansas is located<br />
within wind zones III and IV, <strong>the</strong> highest inland categories. High winds, often accompanying<br />
severe thunderstorms, can cause significant property and crop damage, threaten public safety<br />
and have adverse economic impacts from business closures and power loss.<br />
Straight-line winds are generally any thunderstorm wind that is not associated with rotation (i.e.,<br />
is not a tornado). It is <strong>the</strong>se winds, which can exceed 100 mph that represent <strong>the</strong> most common<br />
type of severe wea<strong>the</strong>r and are responsible for most wind damage related to thunderstorms.<br />
Since thunderstorms do not have narrow tracks like tornadoes, <strong>the</strong> associated wind damage<br />
can be extensive and affect entire (and multiple) counties. Objects like trees, barns,<br />
outbuildings, high-profile vehicles, and power lines/poles can be toppled or destroyed, and<br />
roofs, windows and homes can be damaged as wind speeds increase. One type of straight-line<br />
wind is <strong>the</strong> downburst, which can cause damage equivalent to a strong tornado and can be<br />
extremely dangerous to aviation.<br />
Thunderstorms over <strong>the</strong> planning area typically happen between late April and early September,<br />
but, given <strong>the</strong> right conditions, <strong>the</strong>y can develop as early as March. They are usually produced<br />
by super cell thunderstorms or a line of thunderstorms that typically develop on hot and humid<br />
days.<br />
Location<br />
The entire planning region is susceptible to high wind events. Whe<strong>the</strong>r due to Thunderstorms,<br />
Tornadoes, or solely wind events such as a Derecho, <strong>the</strong> Region can count on high wind<br />
events.<br />
Previous Occurrences<br />
28 February 2012 - A strong cold front, associated with a low pressure system over <strong>the</strong> Central<br />
Plains, moved east nor<strong>the</strong>ast across <strong>the</strong> region, with a broken line of thunderstorms. A few of<br />
<strong>the</strong> storms were severe with damaging winds, during <strong>the</strong> evening hours of February 28, 2012.<br />
Thunderstorm wind gusts were estimated up to 60 mph on Douglas Avenue.<br />
3 August 2012 - Thunderstorm wind gusts were estimated up to 60 mph, at <strong>the</strong> corner of 199th<br />
and Blackbob Road.<br />
6 June 2011 - Scattered severe thunderstorms were observed across extreme eastern Kansas,<br />
during <strong>the</strong> evening hours of June 1, 2011. T<strong>here</strong> were several reports of hail and damaging<br />
3.274
winds. Large trees were snapped off at ground level. A barn was destroyed at 155th Street and<br />
Fairmont Road.<br />
6 April 2010 – Leavenworth - Severe thunderstorms brought large hail and damaging winds to<br />
<strong>the</strong> area, during <strong>the</strong> afternoon hours of April 6, 2010. Thunderstorm winds were estimated up to<br />
60 mph.<br />
7 June 1982 - During <strong>the</strong> pre-dawn hours of Monday, June 7, 1982, a derecho formed over<br />
north central Kansas (KS) and roared eastward causing considerable damage and some<br />
injuries as it crossed nor<strong>the</strong>rn Kansas, central Missouri (MO), and west central Illinois (IL) (Fig.<br />
1). The most intense part of <strong>the</strong> storm occurred along a band from just west of Manhattan, KS<br />
(orange "M" in Fig. 1) through <strong>the</strong> central and nor<strong>the</strong>rn parts of <strong>the</strong> Kansas City metropolitan<br />
area (orange "K" in Fig. 1). Measured peak wind gusts included 62 mph at Manhattan, 78 mph<br />
at Topeka (orange "T" in Fig. 1), 90 mph at Lake Perry, KS (orange "P" in Fig. 1), and 78 mph at<br />
Kansas City International Airport. Gusts were estimated to have reached 90 to 100 mph in<br />
several places, including <strong>the</strong> nor<strong>the</strong>rn Kansas City suburb of Parkville, MO. Along <strong>the</strong> most<br />
intense part of <strong>the</strong> derecho path ("M" to "K"), mobile homes were overturned, buildings were<br />
damaged, planes were overturned at <strong>the</strong> airports in Topeka and Kansas City, and thousands of<br />
trees were damaged or blown down (Fig 1). Six people were injured in <strong>the</strong> overturned mobile<br />
homes. Much of <strong>the</strong> area lost electrical power, including <strong>the</strong> nor<strong>the</strong>rn two-thirds of <strong>the</strong> Kansas<br />
City metropolitan area (noaa.gov).<br />
Source: http://www.spc.noaa.gov/misc/AbtDerechos/casepages/kc1982mem2003pwrpage.htm<br />
The following map depicts <strong>the</strong> area’s that have <strong>the</strong> highest incidence of Derecho’s. Region L<br />
falls in <strong>the</strong> 1 derecho every 1 to 2 year window.<br />
3.275
Figure 3.82. Incidence of Derecho’s<br />
Source: NOAA.gov<br />
Extent<br />
Between <strong>the</strong> years 2000 and 2012, <strong>the</strong> Counties in Region L saw a combined 282 wind events<br />
that were reported. Following is a breakdown by county.<br />
Table 3.174. Wind Events in Region L, 2000-2012<br />
Johnson County<br />
High Wind Wind Associated Deaths Injuries Property Crop Damage<br />
E 8 t<br />
With 126 0 0 D 673K 0.00K<br />
Leavenworth County<br />
9 104 0 0 205.4K 0.00<br />
Wyandotte County<br />
1 34 0 0 238K 0.00<br />
Totals<br />
18 264 0 0 1,116.4M 0.00K<br />
Source: National Climatic Database<br />
Magnitude: “Limited”. Injuries and/or illnesses do not result in permanent disability, and less<br />
than 10 – 25% of property is severely damaged.<br />
3.276
Probability of Future Occurrences<br />
Based on <strong>the</strong> historical data presented of 282 wind events in Region L within <strong>the</strong> last 12 years,<br />
<strong>the</strong> probability that at least one wind event will occur in <strong>the</strong> Region in any given year is 100%.<br />
This hazard’s CPRI probability is “Highly Likely” within a calendar year.<br />
Impact and Vulnerability<br />
To determine potential financial loss estimates to wind in <strong>the</strong> planning area, <strong>the</strong> available<br />
historical loss data was annualized. In <strong>the</strong> case of frequently occurring wea<strong>the</strong>r-related hazards<br />
such as wind, annualized historical loss data is considered to be <strong>the</strong> best resource for<br />
determining future potential losses. The planning team obtained loss data from <strong>the</strong> National<br />
Climatic Data Center (NCDC) storm events (2006 – 2012) and <strong>the</strong> USDA Risk Management<br />
Agency insured crop loss payments (2002 – 2011) since agriculture plays such as important<br />
role in <strong>the</strong> Kansas economy. Following is <strong>the</strong> annualized property losses from wind, 2006 -<br />
2012:<br />
Table 3.175. Annualized Property Losses for Region L, 2006 - 2012<br />
County Annualized Property Loss ($)<br />
Johnson $11,571<br />
Leavenworth $73,307<br />
Wyandotte $21,420<br />
Source: State Hazard Mitigation Plan<br />
All three counties in <strong>the</strong> planning area are vulnerable to windstorms. The statistical analysis<br />
method was used to refine and assess <strong>the</strong> relative vulnerability of each of Region L’s counties<br />
to wind. Ratings were assigned to pertinent factors that were examined at <strong>the</strong> county level.<br />
These factors are: social vulnerability index, prior events, prior annualized property damage,<br />
building exposure valuation, population density, crop exposure and annualized crop loss. Then<br />
a rating value of 1-10 was assigned to <strong>the</strong> data obtained for each factor and <strong>the</strong>n weighted<br />
equally and factored toge<strong>the</strong>r to obtain overall vulnerability scores for comparison and to<br />
determine <strong>the</strong> greatest vulnerable counties.<br />
The following are <strong>the</strong> data sources of <strong>the</strong> factors: Social Vulnerability Index for Kansas counties<br />
from <strong>the</strong> Hazards and Vulnerability Research Institute at <strong>the</strong> University of South Carolina,<br />
National Climatic Data Center (NCDC) storm events (2006 – 2012), U.S. Census Bureau<br />
(2010), USDA’s Census of Agriculture (2007) and USDA Risk Management Agency (2002 –<br />
2011). It was determined that since wind is a common occurrence in Kansas, that using<br />
historical events and property damages from 2006 forward provides adequate events to<br />
describe <strong>the</strong> wind problem in Kansas.<br />
Table 3.176 below provides <strong>the</strong> factor’s amount per county that are considered for wind<br />
vulnerability<br />
3.277
Table 3.176. Vulnerability of Kansas Counties Factor Amounts for Wind<br />
County<br />
SoV1<br />
Rating (1-<br />
5)<br />
Prior<br />
Events<br />
2006 –<br />
2012<br />
Property<br />
Damages<br />
Annualize<br />
d<br />
Property<br />
Damages<br />
Total<br />
Building<br />
Exposure<br />
($1000s)<br />
Populatio<br />
n Density<br />
Crop<br />
Exposure<br />
(2007<br />
Census<br />
of<br />
Agricultur<br />
e)<br />
Crop<br />
Insurance<br />
Paid for<br />
Wind<br />
Annualize<br />
d Crop<br />
Insurance<br />
Paid<br />
Johnson 1 61 $81,000 $11,571 $43,871,468 1,149.60 $29,472,000 $109,685 $10,969<br />
Leavenworth 1 60 $513,500 $73,357 $4,877,783 164.7 $20,983,000 $0 $0<br />
Wyandotte 3 13 $150,000 $21,429 $12,066,666 1,039.00 $0 $0 $0<br />
Total 134 $744,500 $106,357 $60,815,917 $50,455,000 $109,685 $10,969<br />
Note: The Census of Agriculture did not publish crop exposure in Wyandotte County to avoid disclosure of individual operations<br />
3.278
Table 3.177. Ranges for Wind Vulnerability Factor Ratings<br />
Ratings<br />
Social<br />
Vulnerability<br />
NCDC Prior<br />
Events<br />
1 9 - 34<br />
2 1 35 - 56<br />
3 57 - 78<br />
4 2 79 - 100<br />
5 101 - 122<br />
6 3 123 - 144<br />
7 145 - 165<br />
8 4 166 - 187<br />
9 188 - 209<br />
10 5 210 - 232<br />
Annualized<br />
Property<br />
Damage<br />
$0 -<br />
$200,000<br />
$200,001 -<br />
$400,000<br />
$400,001 -<br />
$600,000<br />
$600,001 -<br />
$800,000<br />
$800,001 -<br />
$1,000,000<br />
$1,000,001 -<br />
$3,000,000<br />
$3,000,001 -<br />
$5,000,000<br />
$5,00,001 -<br />
$7,000,000<br />
$7,000,001 -<br />
$9,000,000<br />
$9,000,001 -<br />
$25,460,428<br />
Source: State Hazard Mitigation Plan 2013<br />
Building<br />
Exposure<br />
Valuation<br />
Population<br />
Density *<br />
Crop Exposure<br />
Annualized<br />
Crop Loss<br />
$117,421 -<br />
$4,492,825 1.6 - 116.3 0 - $18,548,500 19 - $40,800<br />
$4,492,826 - 116.4 - $18,548,501 -<br />
$8,868,229 231.1 $32,126,000 $40,801 - $81,576<br />
$8,868,230 - 231.2 - $32,126,001 -<br />
$13,243,634 345.9 $45,703,500 $81,577 - $122,352<br />
$13,243,635 - 346 - $45,703,501 -<br />
$122,353 -<br />
$17,619,039 460.7 $59,281,000<br />
$163,128<br />
$17,619,040 - 460.8 - $59,281,001 -<br />
$163,129 -<br />
$21,994,444 575.5 $72,858,500<br />
$203,904<br />
$21,994,445 - 575.6 - $72,858,501 -<br />
$203,905 -<br />
$26,369,848 690.3 $86,436,000<br />
$244,680<br />
$26,369,849 - 690.4 - $86,436,001 -<br />
$244,681 -<br />
$30,745,253 805.1 $100,013,500<br />
$285,456<br />
$30,745,254 - 805.2 - $100,031,501 -<br />
$285,457 -<br />
$35,120,658 919.9 $113,591,000<br />
$326,232<br />
$35,120,659 - 920- $113,591,001 -<br />
$326,233 -<br />
$39,496,062 1,034.7 $127,168,500<br />
$367,008<br />
$39,496,063 - 1,034.8 - $127,168,501 -<br />
$367,009 -<br />
$43,871,468 1,149.6 $140,746,000<br />
$407,783<br />
Table 3.178 provides <strong>the</strong> calculated ranges applied to determine <strong>the</strong> Low, Medium-Low,<br />
Medium, Medium-High and High vulnerable counties and Table 3.179 provides <strong>the</strong> seven rating<br />
values assigned that were considered in determining overall vulnerability to wind. Table 3.180<br />
that follows provides <strong>the</strong> mapped results of this analysis by county.<br />
Table 3.178. Ranges for Overall Wind Vulnerability<br />
Ranges Low Medium-Low Medium Medium-High High<br />
9 - 14 15 - 19 20 - 24 25 – 29 30 - 34<br />
Source: State Hazard Mitigation Plan 2013<br />
3.279
Table 3.179. Vulnerability of Kansas Counties to Wind<br />
County<br />
SoVi Rating<br />
NCDC Prior<br />
Event Rating<br />
Annualized<br />
Property Damage<br />
Rating<br />
Bldg Exposure<br />
Valuation Rating<br />
Population<br />
Density Rating<br />
Crop Exposure<br />
Rating<br />
Annualized Crop<br />
Loss Rating<br />
Overall<br />
Vulnerability<br />
Rating<br />
Johnson 2 3 1 10 10 2 1 29 Medium-High<br />
Leavenworth 2 3 1 2 2 2 0 12 Low<br />
Wyandotte 6 1 1 3 10 1 0 22 Medium<br />
Wind<br />
Vulnerability<br />
Source: State Hazard Mitigation Plan 2013<br />
Table 3.180 below lists <strong>the</strong> top vulnerable counties in Kansas relative to each o<strong>the</strong>r concerning<br />
wind events.<br />
Tab le 3.180. Top Kansas Counties: Vulnerable to Wind<br />
Mitigation<br />
Planning Region<br />
County<br />
Overall<br />
Vulnerability<br />
Rating<br />
Wind Vulnerability<br />
A Sherman 34 High<br />
G Sedgwick 31 High<br />
C Stanton 29 Medium-High<br />
L Johnson 29 Medium-High<br />
A Cheyenne 27 Medium-High<br />
D Finney 26 Medium-High<br />
A Thomas 25 Medium-High<br />
C Morton 25 Medium-High<br />
D Haskell 25 Medium-High<br />
B Norton 24 Medium<br />
C Greeley 24 Medium<br />
C Stevens 24 Medium<br />
Source: State Hazard Mitigation Plan 2013<br />
Summary<br />
Often it is <strong>the</strong> loss of electrical power that most impacts city dwellers following a strong wind<br />
event, whe<strong>the</strong>r due to thunderstorm winds or a derecho. This loss may be due to falling trees<br />
and tree limbs severing or shorting electrical lines, or to direct destruction of <strong>the</strong> overhead<br />
electrical distribution plant by high winds. Large portions of a metropolitan area may remain<br />
without electrical power for days or even weeks after a major wind event.<br />
Local Mitigation Concerns<br />
• Utility lines are at issue for Region L, specifically lines that provide <strong>the</strong> energy to power<br />
air conditioners or furnaces to <strong>the</strong> vulnerable populations. The population growth in this<br />
area is also seeing a growth in <strong>the</strong> elderly population as <strong>the</strong>y move from rural areas to<br />
urban areas in order to be closer to family and medical services. The elderly population<br />
3.280
growth is expected to continue as <strong>the</strong> baby boomers age, and with this growth is a<br />
growing dependence on electricity. Lives could be at risk during an extreme<br />
temperature event should <strong>the</strong> utilities be out due to high winds.<br />
Development in Hazard Prone Areas<br />
Future development projects should consider windstorm hazard at <strong>the</strong> planning, engineering<br />
and architectural design stage with <strong>the</strong> goal of reducing vulnerability.<br />
Johnson County<br />
Table 3.181. Johnson County CPRI: Windstorm<br />
Hazard Type Probability Magnitude<br />
Warning<br />
Time Duration CPRI<br />
Planning<br />
Significance<br />
Johnson County<br />
Windstorm 4 2 3 2 3.05 High<br />
Leavenworth County<br />
Table 3.182. Leavenworth County CPRI: Windstorm<br />
Hazard Type Probability Magnitude<br />
Warning<br />
Time Duration CPRI<br />
Planning<br />
Significance<br />
Leavenworth County<br />
Windstorm 4 2 3 2 3.05 High<br />
Wyandotte County<br />
Table 3.183. Wyandotte County CPRI: Windstorm<br />
Hazard Type Probability Magnitude<br />
Warning<br />
Time Duration CPRI<br />
Planning<br />
Significance<br />
Wyandotte County<br />
Windstorm 4 2 3 2 3.05 High<br />
Consequence (Impact) Analysis)<br />
The information in Table 3.184 provides <strong>the</strong> Consequence Analysis of Potential for Detrimental<br />
Impacts of Hazards done for accreditation with <strong>the</strong> Emergency Management Accreditation<br />
Program (EMAP).<br />
3.281
Table 3.184. EMAP Consequence Analysis: Windstorm<br />
Subject Ranking Impacts/Windstorm<br />
Health and Safety of Persons in <strong>the</strong><br />
Area of <strong>the</strong> Incident<br />
Minimal to Moderate<br />
Impact of <strong>the</strong> immediate area could be minimal to<br />
moderate for affected areas.<br />
Responders<br />
Minimal<br />
Impact to responders is expected to be minimal<br />
unless responders live within <strong>the</strong> affected area.<br />
Continuity of Operations<br />
Minimal<br />
Temporary relocation may be necessary if<br />
government facilities experience damage (minimal).<br />
Property, Facilities, and<br />
Infrastructure<br />
Minimal to Severe<br />
Localized impact could be minimal to moderate to<br />
facilities and infrastructure in <strong>the</strong> incident area.<br />
Utility lines most affected and could be severe.<br />
Delivery of Services<br />
Minimal<br />
Delivery of services could be affected if <strong>the</strong>re is any<br />
disruption to <strong>the</strong> roads and/or utilities due to<br />
damages sustained (minimal).<br />
Environment<br />
Minimal to Severe<br />
Impact may be severe for <strong>the</strong> immediate impacted<br />
area with regards to trees, bushes, crops, etc.<br />
Impact will lessen as distance increases from <strong>the</strong><br />
immediate incident area (minimal to severe).<br />
Impacts to <strong>the</strong> economy will greatly depend on <strong>the</strong><br />
trajectory of <strong>the</strong> windstorm. Revenue could be<br />
impacted if tourism, businesses are halted due to<br />
structural damages and infrastructure damage<br />
Economic Conditions<br />
Public Confidence in Jurisdiction’s<br />
Governance<br />
Minimal to Severe<br />
Minimal<br />
(minimal to severe).<br />
Response and recovery will be in question if not<br />
timely and effective. Warning systems in place and<br />
<strong>the</strong> timeliness of those warnings could be<br />
questioned (minimal).<br />
3.282
3.23 Winter Storm<br />
Calculated Priority Risk Index<br />
3.30 High<br />
Planning Significance<br />
Description<br />
Winter storms in Kansas usually come in<br />
<strong>the</strong> form of heavy snow or freezing rain (ice<br />
storms). Regardless of <strong>the</strong> form <strong>the</strong>y take,<br />
<strong>the</strong>y can have significant impacts to <strong>the</strong><br />
planning area and its residents for days,<br />
weeks, or even months. They can<br />
immobilize a region, blocking roads and<br />
railways and closing airports, which can<br />
disrupt emergency and medical services,<br />
hamper <strong>the</strong> flow of supplies, and isolate<br />
homes and farms, possibly for days. Heavy<br />
snow can collapse roofs and knock down<br />
trees and power lines. Unprotected<br />
livestock may be lost. Economic impacts include cost of snow removal, damage repair, business<br />
and crop losses, and power failures. It is <strong>the</strong>se impacts that Kansas is most concerned about.<br />
A major winter storm can last for several days and be accompanied by high winds, freezing rain<br />
or sleet, heavy snowfall, and cold temperatures (see Section 3.3.7, Extreme Temperatures).<br />
The National Wea<strong>the</strong>r Service describes different types of winter storm events as follows:<br />
• Blizzard—Winds of 35 mph or more with snow and blowing snow reducing visibility to less<br />
than 1/4 mile for at least three hours.<br />
• Blowing Snow—Wind-driven snow that reduces visibility. Blowing snow may be falling<br />
snow and/or snow on <strong>the</strong> ground picked up by <strong>the</strong> wind.<br />
• Snow Squalls—Brief, intense snow showers accompanied by strong, gusty winds.<br />
Accumulation may be significant.<br />
• Snow Showers—Snow falling at varying intensities for brief periods of time. Some<br />
accumulation is possible.<br />
• Freezing Rain—Measurable rain that falls onto a surface with a temperature below freezing.<br />
This causes it to freeze to surfaces, such as trees, cars, and roads, forming a coating or<br />
glaze of ice. Most freezing-rain events are short lived and occur near sunrise between <strong>the</strong><br />
months of December and March.<br />
• Sleet—Rain drops that freeze into ice pellets before reaching <strong>the</strong> ground. Sleet usually<br />
bounces when hitting a surface and does not stick to objects.<br />
3.283
Heavy accumulations of ice, often <strong>the</strong> result of freezing rain, can bring down trees, utility poles,<br />
and communications towers and disrupt communications and power for days. Even small<br />
accumulations of ice can be extremely dangerous to motorists and pedestrians.<br />
Location<br />
The entire planning area is susceptible to heavy snow and freezing rain. Figure 3.83 shows <strong>the</strong><br />
average snowfalls for <strong>the</strong> planning area.<br />
Figure 3.83. Average Annual Snowfall for Region L.<br />
Source: Kansas State University, Research and Extension, Wea<strong>the</strong>r Data Library,<br />
www.oznet.ksu.edu/wdl/Maps/Climatic/AnnualFreezeMap.asp<br />
The Region sees an average number of 8 – 9 hours per year with freezing rain.<br />
Previous Occurrences<br />
Region L has been in 4 out of eight Presidential Declarations that involved winter storms since<br />
1955 (see Table 3.185).<br />
3.284
Table 3.185. Region L’s Inclusion in Presidential Declarations Involving Winter Storms<br />
Declaratio<br />
n<br />
Number<br />
Declaration<br />
Date*<br />
Major Disaster Declarations<br />
1885<br />
1741<br />
1579<br />
1402<br />
03/09/2010<br />
(12/9/2009-<br />
1/8/2010)<br />
02/01/2008<br />
(12/6-<br />
12/19/2008)<br />
2/8/2005<br />
(1/4-6/2005)<br />
2/6/2002<br />
(1/29-<br />
2/15/2002)<br />
Disaster<br />
Description<br />
Severe Winter<br />
Storms and<br />
Snowstorm<br />
Severe Winter<br />
Storms<br />
Severe Winter<br />
Storm, Heavy<br />
Rains, and<br />
Flooding<br />
Ice Storm<br />
Counties Involved<br />
Allen, Anderson, Atchison, Bourbon, Brown,<br />
Butler, Cherokee, Cheyenne, Clay, Cowley,<br />
Crawford, Decatur, Doniphan, Elk, Franklin, Gove,<br />
Graham, Greenwood, Jackson, Jefferson, Jewell,<br />
Labette, Linn, Logan, Lyon, Marshall, Miami,<br />
Morris, Nemaha, Neosho, Norton, Osage, Phillips,<br />
Pottawatomie, Rawlins, Republic, Riley, Shawnee,<br />
Sheridan, Wabaunsee, Wallace, Washington,<br />
Wilson, Woodson and Wyandotte<br />
Atchison, Barber, Barton, Brown, Butler, Chase,<br />
Cherokee, Clark, Clay, Cloud, Comanche,<br />
Crawford, Dickinson, Doniphan, Edwards, Ellis,<br />
Ellsworth, Ford, Geary, Graham, Gove, Harvey,<br />
Hodgeman, Jackson, Jefferson, Jewell, Kingman,<br />
Kiowa, Labette, Leavenworth, Lincoln, Logan,<br />
Lyon, Marion, Marshall, McPherson, Miami,<br />
Mitchell, Morris, Nemaha, Osage, Osborne,<br />
Ottawa, Pawnee, Phillips, Pottawatomie, Pratt,<br />
Reno, Republic, Rice, Riley, Rooks, Rush,<br />
Russell, Saline, Sedgwick, Shawnee, Sheridan,<br />
Smith, Stafford, Thomas, Wabaunsee, Wallace,<br />
Washington, and Woodson.<br />
Anderson, Atchison, Barber, Brown, Butler,<br />
Chase, Chautauqua, Clark, Coffey, Comanche,<br />
Cowley, Crawford, Douglas, Elk, Franklin,<br />
Greenwood, Harper, Harvey, Jackson, Jefferson,<br />
Kingman, Kiowa, Leavenworth, Lyon, Marion,<br />
McPherson, Morris, Osage, Pratt, Reno, Rice,<br />
Sedgwick, Shawnee, Sumner, Wabaunsee,<br />
Woodson, Wyandotte<br />
Allen, Anderson, Barber, Bourbon, Butler,<br />
Chautauqua, Cherokee, Coffey, Comanche,<br />
Cowley, Crawford, Douglas, Elk, Franklin,<br />
Greenwood, Harper, Jefferson, Johnson,<br />
Kingman, Kiowa, Labette, Leavenworth, Linn,<br />
Lyon, Miami, Montgomery, Neosho, Osage, Pratt,<br />
Sedgwick, Shawnee, Sumner, Wilson, Woodson,<br />
Wyandotte<br />
Sources: http://www.fema.gov/disasters, and Kansas Division of Emergency Management<br />
* Incident dates are in paren<strong>the</strong>ses.<br />
** Disaster costs include Public Assistance and Individual Assistance<br />
Disaster<br />
Cost**<br />
$19,100,658<br />
$359,557,345<br />
$106,873,672<br />
$60,185,754<br />
FEMA-1885-DR—March 9, 2010 (December 21, 2009—January 10, 2010): Beginning<br />
December 22 nd a strong, slow moving storm moved into <strong>the</strong> western Kansas leaving heavy<br />
snow causing icy and snow packed roads in portions of northwestern Kansas. The storm<br />
system continued easterly and continued to significantly impact portions of north central,<br />
nor<strong>the</strong>astern, and sou<strong>the</strong>astern areas of <strong>the</strong> State. This storm system created blizzard<br />
conditions with dangerously high winds causing blowing/drifting snow, treacherous travel<br />
3.285
conditions, and impassable roads. Two fatalities and three injuries occurred in two of <strong>the</strong> more<br />
severe accidents.<br />
FEMA-1741-DR—February, 2008 (December 6-19, 2007): Winter wea<strong>the</strong>r started across<br />
central and sou<strong>the</strong>ast Kansas with two different ice storms that moved across <strong>the</strong> area and<br />
produced significant accumulations. The ice caused numerous power outage and approximately<br />
130,000 Kansas customers were without power. Specifically, Kansas Rural Electric<br />
Cooperatives reported 49,000 customers without power, Westar reported 76,000 customers,<br />
Kansas City Power & Light reported 4,300 customers, and Kansas City, Kansas Board of Public<br />
Utilities reported 800 customers without power. Then a major winter storm moved through<br />
Kansas during <strong>the</strong> evening hours of December 14 th and <strong>the</strong> heaviest snow targeted areas still<br />
suffering from <strong>the</strong> ice storm that hit earlier in <strong>the</strong> week.<br />
FEMA-1579-DR—February 8, 2005 (January 4-6): This was one of <strong>the</strong> worst ice storms on<br />
record to hit central, south central, and sou<strong>the</strong>ast Kansas. Although freezing rain was <strong>the</strong><br />
primary culprit, sleet also played a vital role in coating nearly <strong>the</strong> entire region with one-two<br />
inches of ice, which caused incredible damage to trees, power lines, and power poles. Roads<br />
and highways were blocked by tree debris and downed power poles and lines. Many areas were<br />
without power for more than a week.<br />
FEMA-1402-DR: Ice Storm—February 6, 2002 (January 29–February 15): Beginning on<br />
January 29, a three-day severe winter storm hit 35 Kansas counties in <strong>the</strong> sou<strong>the</strong>ast corner of<br />
<strong>the</strong> State with freezing rain, drizzle, sleet and snow. With one to two inches of ice accumulation,<br />
utility poles and power lines snapped, transportation was treacherous and fallen trees damaged<br />
many structures. The resulting power outages affected nearly <strong>the</strong> entire region and lasted nearly<br />
a week in some areas. Loss of power was particularly problematic for many nursing homes.<br />
T<strong>here</strong> were seven fatalities. This was <strong>the</strong> worst ice storm in <strong>the</strong> metropolitan Kansas City area.<br />
Extent<br />
Winter Storms can severely affect people and property. Normally <strong>the</strong>se storms are associated<br />
with extreme temperatures and wind, along with ice that can take down utility lines for days,<br />
weeks, even months. It is also very hard for people to be transit during <strong>the</strong>se events and when<br />
<strong>the</strong>y last a long time food can be in short supply. Ano<strong>the</strong>r danger of a winter storm is if <strong>the</strong><br />
electricity goes out, <strong>the</strong> heat normally follows, leaving people vulnerable to <strong>the</strong> cold.<br />
• Johnson County had a reported 16 winter storm events between <strong>the</strong> years 2000 and<br />
2012. While <strong>the</strong>re were no deaths, injuries, or property damage reported, <strong>the</strong>re were<br />
minor traffic accidents and school closings.<br />
• Leavenworth County had 16 winter storms between <strong>the</strong> years 2000 and 2012, resulting<br />
in no deaths, injuries or property damage. T<strong>here</strong> were minor accidents and schools<br />
closings.<br />
• Wyandotte County had 15 winter storms between <strong>the</strong> years 2000 and 2012, resulting in<br />
no deaths, injuries, or property damage. As with Johnson and Leavenworth Counties,<br />
<strong>the</strong>re were minor accidents and school closings.<br />
3.286
Because so many variables come into play during a winter storm <strong>the</strong> planning committee has<br />
determined that <strong>the</strong> magnitude is critical. Injuries and illnesses do not result in permanent<br />
disability (normally), a complete shutdown of facilities could last at least two weeks, and 25% –<br />
50% of property could be severely damaged.<br />
Probability<br />
Johnson and Leavenworth County’s had 16 winter storms in 12 years, resulting in a 100%<br />
chance of a winter storm in any given year.<br />
Wyandotte County had 15 winter storms in <strong>the</strong> past 12 years, resulting in a 100% chance of a<br />
winter storm in any given year.<br />
Because Kansas is in a unique position as it relates to <strong>the</strong> United States, in that <strong>the</strong> jet stream<br />
tends to be directly above it or right over it. This brings <strong>the</strong> potential for strong storms, including<br />
winter storms. Based on historical data, <strong>the</strong> probability for this hazard is “Highly Likely” within<br />
<strong>the</strong> next three years.<br />
Impact and Vulnerability<br />
Winter Storms, which include snow and ice, have caused significant damage to <strong>the</strong> planning<br />
area in recent years. To assess <strong>the</strong> vulnerability to this hazard <strong>the</strong> planning committee<br />
assigned ratings to pertinent factors that were examined and <strong>the</strong> county level. These factors<br />
are: social vulnerability index, prior events, prior annualized property damage, building<br />
exposure valuation, population density, crop exposure and annualized crop loss. A rating value<br />
of 2 – 20 was assigned to <strong>the</strong> data obtained for each factor and <strong>the</strong>n weighted equally and<br />
factored toge<strong>the</strong>r to obtain overall vulnerability scores for comparison and to determine <strong>the</strong> most<br />
vulnerable counties.<br />
Following are <strong>the</strong> data sources for <strong>the</strong> rating factors. Social Vulnerability Index for Region L<br />
counties from <strong>the</strong> Hazards and Vulnerability Research Institute at <strong>the</strong> University of South<br />
Carolina, National Climatic Data Center (NCDC) storm events (2006 – 2012), U.S. Census<br />
Bureau (2010), USDA’s Census of Agriculture (2007), and USDA Risk Management Agency<br />
(2002-2011). In order to adequately describe <strong>the</strong> winter storm hazard, it was determined that<br />
winter storm historical events and property damages is needed back to 1993.<br />
Table 3.186 below provides <strong>the</strong> factor’s amount per county in Region L that are considered for<br />
winter storm vulnerability.<br />
Table 3.186. Vulnerability of Region L Counties Factor Amounts for Winter Storm<br />
To determine potential financial loss estimates to winter storms in <strong>the</strong> region, <strong>the</strong> available<br />
historical loss data was annualized to determine future potential losses. As discussed above in<br />
<strong>the</strong> vulnerability overview for winter storm, <strong>the</strong> planning team obtained loss data for <strong>the</strong> National<br />
Climatic Data Center (NCDC) storm events (1993 – 2012). Most of <strong>the</strong> property damages that<br />
3.287
occur as a result of winter storms are a result of loss of power. For additional information<br />
regarding vulnerability to utility failure, see Section 3.3.19, Utility/Infrastructure Failure.<br />
Table 3.186 provides <strong>the</strong> annualized property loss damages per county in <strong>the</strong> region.<br />
3.288
Table 3.186. Annualized Property Loss Damages, 1993 – 2012<br />
County<br />
SoVI Rating<br />
(1-5)<br />
Prior Events<br />
1993-2012<br />
Property<br />
Damages<br />
Annualized<br />
Property Damage<br />
Total Building<br />
Exposure ($000)<br />
Population<br />
Density<br />
Crop Exposure<br />
Crop Loss<br />
Insurance Paid<br />
Annualized Crop<br />
Loss Insurance<br />
Paid<br />
Mitigation Planning Region L<br />
Johnson 1 40 $10,010,000 $500,500 $43,871,468 1,149.60 $29,472,000 $197,938 $19,794<br />
Leavenworth 1 35 $9,770,000 $488,500 $4,877,783 164.7 $20,983,000 $162,813 $16,281<br />
Wyandotte 3 32 $9,760,000 $488,000 $12,066,666 1,039.00 $0 $0 $0<br />
Total 107 $29,540,000 $1,477,000 $60,815,917 $50,455,000 $360,751 $36,075<br />
Source: State Hazard Mitigation Plan 2013<br />
Table 3.187 provides <strong>the</strong> 1 – 10 ranges for <strong>the</strong> winter storm vulnerability factor ratings. The Social Vulnerability Index is in a range of<br />
1- 5. To give Social Vulnerability Index <strong>the</strong> same weight as <strong>the</strong> o<strong>the</strong>r factors, <strong>the</strong> numbers were multiplied by two.<br />
3.289
Table 3.187. Ranges for Winter Storm Vulnerability Factor Ratings<br />
Ratings<br />
Social<br />
Vulnerability<br />
Prior Events<br />
1 14 - 21<br />
2 1 21 - 29<br />
3 30 - 36<br />
4 2 37 - 44<br />
5 45 - 52<br />
6 3 53 - 60<br />
7 61 - 69<br />
8 4 70 - 77<br />
9 78 - 85<br />
10 5 86 - 93<br />
Annualized<br />
Property<br />
Damage<br />
$2,000 -<br />
$50,000<br />
$50,001 -<br />
$100,000<br />
$100,001 -<br />
$300,000<br />
$300,001 -<br />
$500,000<br />
$500,001 -<br />
$700,000<br />
$700,001 -<br />
$900,000<br />
$900,001 -<br />
$1,100,000<br />
$1,100,001 -<br />
$1,700,000<br />
$1,700,001 -<br />
$2,200,000<br />
$2,200,001 -<br />
$2,800,000<br />
* Population density is <strong>the</strong> number of people per square mile.<br />
Source: State Hazard Mitigation Plan 2013<br />
Building<br />
Exposure<br />
Valuation<br />
$117,421 -<br />
$4,492,825<br />
$4,492,826 -<br />
$8,868,229<br />
$8,868,230 -<br />
$13,243,634<br />
$13,243,635 -<br />
$17,619,039<br />
$17,619,040 -<br />
$21,994,444<br />
$21,994,445 -<br />
$26,369,848<br />
$26,369,849 -<br />
$30,745,253<br />
$30,745,254 -<br />
$35,120,658<br />
$35,120,659 -<br />
$39,496,062<br />
$39,496,063 -<br />
$43,871,468<br />
Population<br />
Density *<br />
Crop Exposure<br />
Annualized<br />
Crop Loss<br />
Insurance Paid<br />
1.6 -<br />
116.3 0 - $18,548,500 0 - $200,000<br />
116.4 - $18,548,501 - $200,001 -<br />
231.1 $32,126,000 $400,000<br />
231.2 - $32,126,001 - $400,000 -<br />
345.9 $45,703,500 $600,000<br />
346 - $45,703,501 - $600,001 -<br />
460.7 $59,281,000 $800,000<br />
460.8 - $59,281,001 - $800,001 -<br />
575.5 $72,858,500 $1,000,000<br />
575.6 - $72,858,501 - $1,100,001 -<br />
690.3 $86,436,000 $1,300,000<br />
690.4 - $86,436,001 - $1,300,001 -<br />
805.1 $100,013,500 $1,500,000<br />
805.2 - $100,031,501 - $1,500,001 -<br />
919.9 $113,591,000 $1,700,000<br />
920- $113,591,001 - $1,700,001 -<br />
1,034.7 $127,168,500 $2,700,000<br />
1,034.8 - $127,168,501 - $2,700,001 -<br />
1,149.6 $140,746,000 $3,700,000<br />
Table 3.188 provides <strong>the</strong> calculated ranges applied to determine <strong>the</strong> Low, Medium-Low,<br />
Medium, Medium-High and High vulnerable counties and Table 3.189 provides <strong>the</strong> rating values<br />
determined for each factor that was considered in determining overall vulnerability to winter<br />
storm.<br />
Table 3.188. Ranges for Overall Winter Storm Vulnerability<br />
Ranges Low Medium-Low Medium Medium-High High<br />
13 - 17 18 - 22 23 - 27 28 - 32 33 - 37<br />
Source: State Hazard Mitigation Plan 2013<br />
3.290
Table 3.189. Vulnerability of Region L Counties to Winter Storm<br />
County<br />
SoVI Converted<br />
Rating<br />
Prior Event<br />
Rating<br />
Annualized<br />
Property Damage<br />
Rating<br />
Bldg Exposure<br />
Valuation Rating<br />
Population<br />
Density Rating<br />
Crop Exposure<br />
Rating<br />
Annualized Crop<br />
Insurance Rating<br />
Overall<br />
Vulnerability<br />
Rating<br />
Mitigation Planning Region L<br />
Johnson 2 4 5 10 10 2 1 34 High<br />
Leavenworth 2 3 4 2 2 2 1 16 Low<br />
Wyandotte 6 3 4 3 10 0 1 27 Medium<br />
Source: State Hazard Mitigation Plan 2013<br />
Table 3.190 lists <strong>the</strong> top vulnerable counties in Kansas relative to each o<strong>the</strong>r concerning winter<br />
storm events.<br />
Table 3.190. Top Counties Vulnerable to Winter Storm<br />
Winter Storm<br />
Vulnerability<br />
Mitigation Planning<br />
Region County Overall Vulnerability Rating Winter Storm Vulnerability<br />
G Sedgwick 37 High<br />
G Reno 36 High<br />
F Republic 35 High<br />
K Marshall 34 High<br />
L Johnson 34 High<br />
A Thomas 32 Medium-High<br />
F Cloud 32 Medium-High<br />
F Dickinson 32 Medium-High<br />
A Sheridan 31 Medium-High<br />
A Sherman 31 Medium-High<br />
K Brown 31 Medium-High<br />
K Washington 31 Medium-High<br />
Source: State Hazard Mitigation Plan 2013<br />
To determine potential financial loss estimates to winter storms in Kansas, <strong>the</strong> historical loss<br />
data was annualized to determine future potential losses. Loss data was obtained from <strong>the</strong><br />
NCDC storm events (1993 – 2012). Table 3.191 shows <strong>the</strong> annualized property loss for Region<br />
L by county..<br />
Table 3.191. Annualized Property Loss for Region L<br />
County Property loss ($)<br />
Johnson $500,500<br />
Leavenworth $488,500<br />
Wyandotte $488,000<br />
3.291
Total 1,477,000<br />
Source: State Hazard Mitigation Plan 2013<br />
Mitigation Concerns:<br />
• Region L has a huge diverse population of mature trees, which during a winter storm can<br />
see limbs breaking and downing power lines. This, in turn, takes out <strong>the</strong> electricity which<br />
puts <strong>the</strong> population in peril of extremely cold temperatures. If <strong>the</strong> roads are not<br />
accessible this population runs <strong>the</strong> risk of perishing.<br />
• Heavy snowfall and ice conditions can cause roads to become impassable which results<br />
in <strong>the</strong> population being cut off from emergency services. Medical conditions can be<br />
exasperated without medicine or treatment or access to ei<strong>the</strong>r. Should a fire ensue due<br />
to downed power lines, fire trucks could have a hard time reaching <strong>the</strong> source, again<br />
putting <strong>the</strong> population at risk.<br />
• In <strong>the</strong> planning area, specifically Johnson County, record storms in <strong>the</strong> past five years<br />
have created traffic issues. Lack of early warning and communication to residents is an<br />
area that needs improvement. The lack of early warning and communication to <strong>the</strong><br />
people of <strong>the</strong> planning area hampers emergency response for fire rescue, building<br />
failures, etc.<br />
Development in Hazard Prone Areas<br />
Structural development is not considered to be an issue for future development in <strong>the</strong> planning<br />
area. The biggest vulnerability comes from downed utility lines, transportation accidents, and<br />
exposure of aging infrastructure.<br />
Johnson County<br />
Table 3.192. Johnson County CPRI: Winter Storm<br />
Hazard Type Probability Magnitude<br />
Warning<br />
Time Duration CPRI<br />
Planning<br />
Significance<br />
Johnson County<br />
Winter Storm 4 3 1 3 3.15 High<br />
Leavenworth County<br />
Table 3.193. Leavenworth County CPRI: Winter Storm<br />
Hazard Type Probability Magnitude<br />
Warning<br />
Time Duration CPRI<br />
Planning<br />
Significance<br />
Leavenworth County<br />
Winter Storm 3 3 2 3 2.85 Moderate<br />
3.292
Wyandotte County<br />
Table 3.194. Wyandotte County CPRI: Winter Storm<br />
Hazard Type Probability Magnitude<br />
Warning<br />
Time Duration CPRI<br />
Planning<br />
Significance<br />
Wyandotte County<br />
Winter Storm 3 3 2 3 2.85 Moderate<br />
Consequence Analysis<br />
People, animals and agriculture are adversely affected by winter storms especially when<br />
accompanied by strong winds creating blizzard conditions with blinding wind-driven snow,<br />
severe drifting and dangerous wind chill. Strong winds with <strong>the</strong>se intense storms and cold fronts<br />
can knock down trees, utility poles and power lines. The information contained in Table 3.195<br />
provides <strong>the</strong> Consequence Analysis of Potential for Detrimental Impact of Hazard done for<br />
accreditation with <strong>the</strong> Emergency Management Accreditation Program (EMAP).<br />
Table 3.195. Consequence (Impact) Analysis: Winter Storm<br />
Subject Ranking Impacts/Winter Storm<br />
Impact of <strong>the</strong> immediate area could be severe for<br />
affected areas and moderate to light for o<strong>the</strong>r less<br />
Severe<br />
affected areas.<br />
Health and Safety of Persons in<br />
<strong>the</strong> Area of <strong>the</strong> Incident<br />
Impact to responders could be severe for unprotected<br />
Responders<br />
Minimal<br />
personnel and moderate to light for prepared personnel.<br />
Continuity of Operations Minimal Minimal expectation of execution of <strong>the</strong> COOP.<br />
Property, Facilities, and<br />
Infrastructure<br />
Delivery of Services<br />
Environment<br />
Economic Conditions<br />
Public Confidence in<br />
Jurisdiction’s Governance<br />
Minimal to Severe<br />
Minimal to Severe<br />
Severe<br />
Minimal to Severe<br />
Minimal to Severe<br />
Localized impact to facilities and infrastructure in <strong>the</strong><br />
incident area. Utility lines most affected. (minimal to<br />
severe).<br />
Delivery of services could be affected if <strong>the</strong>re is any<br />
disruption to <strong>the</strong> roads and/or utilities due to damages<br />
sustained. (Minimal to severe)<br />
Greatest impact will be to trees, bushes, foliage, crops,<br />
and wildlife, which could be severe.<br />
Impacts to <strong>the</strong> economy will greatly depend on <strong>the</strong><br />
severity of <strong>the</strong> winter storm, longevity of <strong>the</strong> storm, and<br />
any damages sustained such as utilities and roads.<br />
(Minimal to severe).<br />
Response and recovery will be in question if not timely<br />
and effective. Utility failure could be called in to<br />
question if outages are persistent. (minimal to severe).<br />
3.293
3.24 References<br />
General<br />
Crop Insurance Payments, USDA Risk Management Agency, 2012<br />
Kansas Disaster History. Federal Emergency Management Agency. www.fema.gov/disasters and Kansas Division of<br />
Emergency Management<br />
USDA Declarations, U.S. Department of Agriculture<br />
Mitigation Planning Workshop for Local Governments. Federal Emergency Management Agency. Student Manual.<br />
2004.<br />
National Wea<strong>the</strong>r Service Offices: Dodge City, KS— http://www.crh.noaa.gov/ddc/ Goodland, KS—<br />
http://www.crh.noaa.gov/gld/ Wichita, KS— http://www.crh.noaa.gov/ict/ Topeka, KS— http://www.crh.noaa.gov/top/<br />
Springfield, MO— http://www.crh.noaa.gov/sgf/ Kansas City/Pleasant Hill, MO— http://www.crh.noaa.gov/eax/<br />
Hastings, NE— http://www.crh.noaa.gov/gid/<br />
Storm Events Database. National Climatic Data Center, www4.ncdc.noaa.gov/cgi-win/wwcgi.dll?wwEvent~Storms<br />
2007 Census of Agriculture, U.S. Department of Agriculture, www.agcensus.usda.gov/index.asp<br />
Analysis of State Development Trends<br />
2007 Census of Agriculture, U.S. Department of Agriculture, www.agcensus.usda.gov/index.asp<br />
Exposure of <strong>the</strong> Built Environment Values, HAZUS MH 2.1<br />
Kansas Farm Facts, 2011 U.S. Department of Agriculture National Agricultural Statistics Service:<br />
http://www.nass.usda.gov/Statistics_by_State/Kansas/Publications/Annual_Statistical_Bulletin/ff2011.pdf<br />
Kansas Fact Sheet. U.S. Department of Agriculture Economic Research Service.<br />
www.ers.usda.gov/StateFacts/KS.htm<br />
Kansas Forest Action Plan, Kansas Forest Service/ Kansas State University, Manhattan, Revised October 2011,<br />
http://www.kansasforests.org/assessment.shtml<br />
Kansas Population Projections through 2021. Kansas Division of <strong>the</strong> Budget. http://budget.ks.gov/ecodemo.htm<br />
Social Vulnerability Index. University of South Carolina Department of Geography Hazards and Vulnerability<br />
Research Institute. http://webra.cas.sc.edu/hvri/products/sovi.aspx<br />
U.S. Census Bureau, 2010 Census, www.census.gov<br />
U.S. Census Bureau, Quick Facts, http://quickfacts.census.gov/qfd/states/2000.html<br />
Kansas Hazard Mitigation Plan DRAFT 3.583 2013<br />
3.294
2011 Kansas Crop Insurance profile, Rep. USDA Risk Management Agency, n.d. Web. 5 Mar 2013.<br />
www.rma.usda.gov/pubs/2012/stateprofiles/kansas11.pdf<br />
Kansas Beef Confined Animal Feeding Operations, Kansas Department of Health & Environment, Bureau of Water,<br />
Livestock Waste Management<br />
Kansas Cooperative Plant Disease Survey Report,<br />
http://www.ksda.gov/includes/document_center/plant_protection/Plant_Disease_Reports/2012KSWheatDiseaseLoss<br />
Estimates.pdf, dated August 2012<br />
Kansas Department of Agriculture, Plant Protection and Weed Control Division, 2012<br />
Kansas Sensitive Crops Registry, Kansas Department of Agriculture,<br />
http://www.ksda.gov/pesticides_fertilizer/content/177<br />
USDA, Animal and Plant Health Inspection Service<br />
http://www.aphis.usda.gov/plant_health/plant_pest_info/emerald_ash_b/index.shtml<br />
USDA, National Agricultural Statistics Service, 2007 and 2010<br />
Civil Disorder<br />
Aggieville Riots, http://en.wikipedia.org/wiki/Aggieville_Riots - cite_note-Collegian-3<br />
Electronic Mass Casualty Assessment and `Planning Scenarios (EMCAPS) http://www.hopkinscepar.org/EMCAPS/EMCAPS.html,<br />
Johns Hopkins University, 2006<br />
Inmate Populations, Kansas Department of Corrections<br />
Dam and Levee Failure<br />
Bureau of Reclamation, http://www.usbr.gov/gp/lakes_reservoirs/kansas_lakes.htm<br />
Dam Failure Incidents, Stanford University‘s National Performance of Dams Program, http://ce-npdpserv2.stanford.edu/DamDirectory/DamIncidentQuery/IncidentForm.jsp<br />
DFIRM Status, FEMA RVII<br />
FEMA RVII Mid-term Levee Inventory<br />
Federal Dams, Kansas Water Office and Kansas Department of Agriculture, Division of Water Resources;<br />
*BOR=Bureau of Reclamation, USF&W = U.S. Fish & wildlife Service; USACE= U.S. Army Corps of Engineers<br />
Information on Augusta levee 1998 damages: USACE Tulsa District Office, Project Update,<br />
http://www.swt.usace.army.mil/Portals/41/docs/library/proj-upd/2012-02.pdf<br />
Missouri River Flood Task Force, http://www.nwdmr.usace.army.mil/rcc/MRFTF/docs/20JunListofLeveeRehabsv1.pdf<br />
State Regulated Dams, Kansas Department of Agriculture, Division of Water Resources, Water Structures Program,<br />
2012<br />
―So You Live Behind a Levee‖ (http://content.asce.org/ASCELeveeGuide.html)<br />
Surface Water in Kansas and its Interactions with Groundwater, 2000, www.kgs.ku.edu/HighPlains/atlas/atswqn.htm<br />
U.S. Army Corps of Engineers, Kansas City District, http://www.nwk.usace.army.mil, various damaged levees maps<br />
U.S. Army Corps of Engineers, National Levee Database, http://nld.usace.army.mil/<br />
Kansas Hazard Mitigation Plan DRAFT 3.584 2013<br />
3.295
Drought<br />
Colorado Owes Kansas for Water, Court Rules. Cortez Journal Online. June 12, 2001.<br />
http://cortezjournal.com/archives/1news1405.htm.<br />
Drought Impact Reporter. University of Nebraska–Lincoln National Drought Mitigation Center.<br />
http://droughtreporter.unl.edu.<br />
Drought monitoring and technical assistance, National Drought Mitigation Center, University of Nebraska–Lincoln,<br />
http://www.drought.unl.edu/<br />
Drought Vulnerable Public Water Suppliers Assessment 2007 and 2012, Kansas Water Office<br />
Federal Reservoirs with Water Supply Storage, Kansas Water Office,<br />
www.kwo.org/ReservoirInformation/Map_Federal_Lakes_State_Storage.pdf<br />
Historic Droughts of Kansas. U.S. Geological Survey. 2005. http://ks.water.usgs.gov/Kansas/<br />
waterwatch/drought/historic.html.<br />
Kansas Annual Precipitation Normals, Kansas State Research and Extension. Wea<strong>the</strong>r Data Library,<br />
http://www.ksre.ksu.edu/wdl/AnnualPrecipMaps.asp<br />
Kansas Drought Operations Plan, Governors Drought Team, June 2012<br />
Kansas Drought Resources, Governor‘s Office, http://governor.ks.gov/kansasdrought-resources<br />
Kansas Drought Stage Declarations, Kansas Water Office,<br />
www.kwo.org/Reports%20&%20Publications/Drought/Tbl_drought_declarations_051107_twl.pdf<br />
Kansas Water Plan, 2009 Kansas Water Office.<br />
Major and Minor Aquifers in Kansas, Kansas State Geological Survey, http://www.kgs.ku.edu.<br />
National Integrated Drought Information System, National Oceanic and Atmospheric Administration, http.<br />
United States Supreme Court Rules for Colorado in Republican River Dispute With Kansas. Press Release.<br />
December 7, 2004. www.ago.state.co.us/press_detail.cfm?pressID=53.<br />
U.S. Geological Survey Kansas Water Science Center. U.S. Geological Survey. http://ks.water.usgs.gov/index.shtml.<br />
Earthquake<br />
Earthquakes in Kansas. Kansas Geological Survey. www.kgs.ku.edu/Publications/<br />
GeoRecord/2001/vol7.3/Page1.html.<br />
Earthquake Scenario, HAZUS MH 2.1<br />
HAZUS 99 Estimated Annualized Earthquake Losses for <strong>the</strong> United States. Federal Emergency Management<br />
Agency. FEMA 366. 2001. www.fema.gov/library/index.jsp.<br />
Recent Central US Earthquakes. Center for Earthquake Research and Information. September 7, 2007.<br />
http://folkworm.ceri.memphis.edu/recenteqs/.<br />
U.S. Geological Survey, map generated by National Atlas of <strong>the</strong> United States, www.nationalatlas.gov/<br />
U.S. Geological Survey Earthquake Hazards Program.<br />
http://earthquake.usgs.gov/regional/states/kansas/hazards.php.<br />
Kansas Hazard Mitigation Plan DRAFT 3.585 2013<br />
3.296
Expansive Soils<br />
U.S. Geological Survey publication, http://arcvoid.com/surevoid_web/soil_maps/ks.html<br />
U.S. News and World Report, Aug. 31, 2012<br />
Extreme Temperatures<br />
Extreme Heat. Centers for Disease Control and Prevention. http://www.bt.cdc.gov/disasters/extremeheat/<br />
Heat Index Chart and typical health impacts of extreme heat, National Wea<strong>the</strong>r Service<br />
www.wea<strong>the</strong>r.gov/os/heat/index.shtml<br />
Kansas: Temperature Extremes, Information Please Database, Pearson Education, Inc.<br />
www.infoplease.com/ipa/A0930179.html<br />
Kansas Environmental Public Health Tracking Program, Kansas Department of Health and Environment<br />
Kansas State Plan on Aging Federal Fiscal Years 2010–2013, Kansas Department on Aging and Disability Services,<br />
http://www.kdads.ks.gov/Publications/Publication_Index.html.<br />
Kansas State Research and Extension, Climatic Maps of Kansas, http://www.ksre.ksu.edu/wdl/ClimaticMaps.htm.<br />
National Wea<strong>the</strong>r Service, Goodland, KS http://www.crh.noaa.gov/news/display_cmsarchive.php?wfo=gld<br />
National Wea<strong>the</strong>r Service, Wichita, KS http://www.crh.noaa.gov/ict/scripts/archives.php?reqYear=2012<br />
Wind Chill Chart, National Wea<strong>the</strong>r Service<br />
Winter Wea<strong>the</strong>r, Centers for Disease Control and Prevention. http://www.bt.cdc.gov/disasters/winter/<br />
Flood<br />
HAZUS MH 2.1<br />
Kansas Commission on Emergency Planning and Response, 2011 Annual Report: Managing <strong>the</strong> Risk<br />
Kansas River Basins, USGS Fact Sheet, Water Use in Kansas, 1990-2000 by Joan F. Kenny and Cristi V. Hansaen,<br />
http://pubs.usgs.gov/fs/2004/3133/pdf/fs04_3133.pdf.<br />
K-State Research and Extension, http://www.ksre.ksu.edu/wdl/AnnualPrecipMaps.asp<br />
FEMA‘s Policy and Claim Statistics for Flood Insurance, http://www.fema.gov/policy-claim-statistics-floodinsurance/policy-claim-statistics-flood-insurance/policy-claim-13<br />
Kansas Floodplain Management Newsletter, May 2009<br />
http://www.ksda.gov/includes/document_center/structures/Floodplain/may2009FP.pdf<br />
Repetitive Loss/Severe Repetitive Loss, Flood Insurance Administration<br />
Surface Water in Kansas and its Interactions with Groundwater, 2000,<br />
http://www.kgs.ku.edu/HighPlains/atlas/atswqn.htm<br />
Various Flood Photos, Kansas Division of Emergency Management<br />
Kansas Hazard Mitigation Plan DRAFT 3.586 2013<br />
3.297
Hail<br />
Hail Basics. National Oceanic and Atmospheric Administration National Severe Storm Laboratory.<br />
www.nssl.noaa.gov/primer/hail/hail_basics.html<br />
Hailstorm Intensity Scale, Tornado and Storm Research Organization (TORRO), Department of Geography, Oxford<br />
Brookes University<br />
Hazardous Materials<br />
Hazardous <strong>material</strong>s accidents statistics and top ranked worst case scenario facilities, Kansas Division of Emergency<br />
Management, Technological Hazards Section<br />
Incident and Accident Data. U.S. Department of Transportation Office of Pipeline Safety.<br />
http://primis.phmsa.dot.gov/comm/reports/safety/KS_detail1.html?nocache=3112,<br />
Kansas Department of Health and Environment, Division of Environment<br />
http://www.kdheks.gov/environment/index.html<br />
Kansas gas transmission lines and petroleum pipelines, Kansas Corporation Commission<br />
Kansas transportation routes, Kansas Department of Transportation<br />
National Response Center. www.nrc.uscg.mil.<br />
Pipeline mileage, U.S. Department of Transportation, Pipeline & Hazardous Materials Safety Administration<br />
http://primis.phmsa.dot.gov/comm/reports/safety/KS_detail1.html?nocache=3112#_OuterPanel_tab_6<br />
Superfund National Priorities List Sites in Kansas. U.S. Environmental Protection Agency Superfund.<br />
www.epa.gov/superfund/sites/npl/ks.htm.<br />
Land Subsidence<br />
Aber, S. The Many Uses of Salt from <strong>the</strong> Earth. Emporia State University. 2007. www.geospectra.net/salt.<br />
Croxton, N. Subsidence on 1-70 in Russell County, Kansas Related to Salt Dissolution: A Short History. U.S.<br />
Department of Transportation Federal Highway Administration. 2005.<br />
www.fhwa.dot.gov/engineering/geotech/hazards/mine/workshops/kdot/kansas02.cfm<br />
Kansas Department of Health and Environment Abandoned Mine Land (AML) Program,<br />
http://www.kdheks.gov/mining/emergency.html<br />
Karst Features in Kansas, U.S. Geological Survey, mapped by <strong>the</strong> National Atlas of <strong>the</strong> United States,<br />
www.nationalatlas.gov<br />
Macfarlane, P., M. Townsend, and G. Ohlmacher. Midcontinent Meeting for <strong>the</strong> National Karst Map Project-Field Trip<br />
Notes. Kansas Geological Survey. 2005. www.kgs.ku.edu/Hydro/Publications/2005/OFR05_50/OFR2005_50.pdf.<br />
Subsurface Void Space and Sinkhole/Subsidence Area: Inventory for <strong>the</strong> State of Kansas. Kansas Department of<br />
Health and Environment. 2006, http://www.engg.ksu.edu/CHSR/outreach/tosnac/sites/docs/04.pdf<br />
Using multiple logistic regression and GIS technology to predict landslide hazard in nor<strong>the</strong>ast Kansas, USA,<br />
Ohlmacher, G. C.; Davis, J. C., 2003<br />
WIBW.com: http://www.wibw.com/home/headlines/1233947.html<br />
Kansas Hazard Mitigation Plan DRAFT 3.587 2013<br />
3.298
Landslide<br />
Kansas Geological Survey, http://www.kgs.ku.edu/Publications/AnnRep02/hazards/hazards.html<br />
Ohlmacher, G. Landslides in Kansas. Kansas Geological Survey. 1999.<br />
www.kgs.ku.edu/Publications/pic13/pic13_1.html.<br />
Lightning<br />
U.S. Lightning Fatalities by State, NOAA, http://www.lightningsafety.noaa.gov/stats/59-11_fatalities_rates.pdf<br />
Vaisala, http://www.vaisala.com/en/products/thunderstormandlightningdetectionsystems/Pages/NLDN.aspx<br />
Major Disease Outbreak<br />
Annual Infectious Disease Summaries, Kansas Department of Health & Environment, Bureau of Surveillance and<br />
Epidemiology, http://www.kdheks.gov/epi/index.html.<br />
Influenza health care workers vaccinations, Kansas Healthcare Collaborative<br />
Pandemic Influenza Plan, Kansas Department of Health & Environment<br />
U.S. Centers for Disease Control and Prevention<br />
Radiological<br />
Emergency Planning Zones, Kansas Department of Health and Environment<br />
Soil Erosion and Dust<br />
Federal Public Water Supply Reservoirs in Kansas, Kansas Water Office<br />
Kansas State University‘s Wind Erosion Laboratory<br />
Natural Resources Inventory: 2007 Annual NRI Report—Soil Erosion. Natural Resources Inventory, 2007,<br />
http://www.nrcs.usda.gov/technical/NRI/2007/2007_NRI_Summary.pdf.<br />
Wind Erosion Research Unit, U.S. Department of Agriculture Agricultural Research Service, www.weru.ksu.edu.<br />
USDA‘s Long Term Monitoring of Wind Erosion Induced Changes to Soil Properties in Western Kansas Study,<br />
http://topsoil.nserl.purdue.edu/~flanagan/isele2011/presentations/11113-Tatarko.pdf<br />
Terrorism/ Agri-Terrorism<br />
Electronic Mass Casualty Assessment and Planning Scenarios (EMCAPS), Johns Hopkins University, 2006<br />
http://www.hopkins-cepar.org/EMCAPS/EMCAPS.htmlFederal Bureau of Investigation<br />
Gunman Kills Man in Church. New York Times. March 7, 1988.<br />
Holiday Inn Sniper Remembered 30 Years Later. KSNW-TV. September 5, 2006.<br />
Kansas Hazard Mitigation Plan DRAFT 3.588 2013<br />
3.299
Tornado<br />
2012 Kansas Severe Wea<strong>the</strong>r Awareness Week packet<br />
Enhanced Fujita Scale for Tornado Damage, National Wea<strong>the</strong>r Service, www.spc.noaa.gov/faq/tornado/ef-scale.html<br />
Federal Emergency Management Agency. 2004. Taking Shelter from <strong>the</strong> Storm: Building a Safe Room inside Your<br />
House. Publication 320.<br />
National Oceanic and Atmospheric Administration. National Severe Storms Laboratory. Severe Wea<strong>the</strong>r Primer:<br />
Tornado. www.nssl.noaa.gov/primer/tornado/tor_basics.html.<br />
National Oceanic and Atmospheric Administration. National Wea<strong>the</strong>r Service. Tornadoes.<br />
www.nws.noaa.gov/om/brochures/tornado.shtml.<br />
Mobile home units per county, U.S. Census Bureau American Community Survey 2005 – 2009.<br />
Utility/Infrastructure Failure<br />
Coupler Clatter. Great Plains Dispatcher. September 2006. www.gptm.us/dispatcher/06_09.pdf.<br />
General Information, Kansas Corporation Commission<br />
General Information, Federal Energy Regulatory Commission<br />
Highway Map, Kansas Department of Transportation<br />
Loss of Service for Utilities and roads/Bridges, FEMA BCA Reference Guide, June 2009, Appendix C<br />
Kansas 2009 Energy Report http://kec.kansas.gov/energy_plan/09Plan-Ch8-Section8_1.pdf<br />
Telephone Exchange Areas, Kansas Corporation Commission,<br />
http://www.kcc.state.ks.us/maps/ks_telephone_certified_areas.pdf<br />
Top Ten Lists—Oil and Gas Production. Kansas Geological Survey. May 31, 2007.<br />
www.kgs.ku.edu/PRS/Info/topTen.html.<br />
Water Suppliers, Kansas Water Office,<br />
http://www.kwo.org/Kansas_Water_Plan/KWP_Docs/VolumeIII/Statewide/map_statewide_KWP_PWS_090508_tr.pdf<br />
Wildfire<br />
Firewise Communities, Kansas Firewise Community http://submissions.nfpa.org/firewise/fw_communities_list.php<br />
Kansas Forest Action Plan, Kansas Forest Service/ Kansas State University, Manhattan, Revised October 2011,<br />
http://www.kansasforests.org/assessment.shtml<br />
National Fire Incident Reporting Statistics, Kansas Forest Service<br />
National Interagency Fire Center Predictive Services,<br />
http://www.predictiveservices.nifc.gov/outlooks/monthly_seasonal_outlook.pdf<br />
National Wea<strong>the</strong>r Service. 2007 Kansas Severe Wea<strong>the</strong>r Awareness Week Information Packet. 2007.<br />
www.crh.noaa.gov/Image/top/2007KANSAS.pdf.<br />
Topeka Capital-Journal, http://cjonline.com/news/2012-09-02/wildfire-activity-unique-extreme-dry-kansas-summer<br />
Kansas Hazard Mitigation Plan DRAFT 3.589 2013<br />
Ward, K. 1st Wildfire Prevention Week March 25-31 across Kansas. Kansas State University Agricultural<br />
Experiment Station and Cooperative Extension Service. Press Release. March 15, 2007.<br />
www.oznet.ksu.edu/news/sty/2007/wildfire_prevention031507.htm.<br />
Windstorm<br />
Damaging Winds Basics. National Oceanic and Atmospheric Administration National Severe Storm Laboratory.<br />
www.nssl.noaa.gov/primer/wind/wind_basics.html.<br />
Winter Storm<br />
Average Annual Snowfall, Kansas State University, Research and Extension, Wea<strong>the</strong>r Data Library,<br />
www.oznet.ksu.edu/wdl/Maps/Climatic/AnnualFreezeMap.asp<br />
3.300
―Freezing Rain Events in <strong>the</strong> United States‖. American Meteorological Society,<br />
http://ams.confex.com/ams/pdfpapers/71872.pdf.<br />
Kansas snowfall and snow depths extremes, National Data Climatic Center Snow Climatology,<br />
http://www.ncdc.noaa.gov/ussc/USSCAppController?action=extremes&state=14<br />
Winter Storms: The Deceptive Killers. National Oceanic and Atmospheric Administration. National Wea<strong>the</strong>r Service.<br />
2001. www.nws.noaa.gov/om/winterstorm/winterstorms.pdf.<br />
Winter storm descriptions, National Wea<strong>the</strong>r Service.<br />
3.301
4 Mitigation Strategy<br />
44 CFR Requirement §201.6(c)(3): The plan shall include a mitigation strategy that<br />
provides <strong>the</strong> jurisdiction’s blueprint for reducing <strong>the</strong> potential losses identified in <strong>the</strong> risk<br />
assessment, based on existing authorities, policies, programs and resources, and its<br />
ability to expand on and improve <strong>the</strong>se existing tools.<br />
This section describes <strong>the</strong> mitigation strategy developed by <strong>the</strong> planning committee based on<br />
<strong>the</strong> risk assessment. The mitigation strategy was developed through a group process by <strong>the</strong><br />
counties of Johnson, Leavenworth, and Wyandotte and consists of general goal statements that<br />
are broad in nature. These statements will serve to guide <strong>the</strong> jurisdictions in <strong>the</strong>ir efforts to<br />
lessen, or avoid, <strong>the</strong> impacts brought about by natural disasters. The definitions below are<br />
based on those <strong>found</strong> in <strong>the</strong> 2013 FEMA Local Mitigation Handbook:<br />
• Goals – general guidelines that are usually broad policy-type statements<br />
that are long term. They represent visions for reducing or avoiding losses<br />
from <strong>the</strong> identified hazards.<br />
• Mitigation Actions – Specific projects and activities that help achieve <strong>the</strong><br />
goals.<br />
IAW 44CFR, Requirement §201.6(c)(3)(ii) The mitigation strategy must address <strong>the</strong><br />
jurisdictions participation in <strong>the</strong> NFIP and continued compliance with <strong>the</strong> NFIP<br />
requirement, as appropriate:<br />
The NFIP provides <strong>the</strong> maps and regulatory basis for local floodplain management. It is also<br />
<strong>the</strong> nation’s leading source of insurance protection for flood prone properties. Involvement in<br />
NFIP is based on an agreement between local jurisdictions and FEMA. T<strong>here</strong> are 3 basic<br />
areas:<br />
• Mapping and floodplain identification. Communities are required to adopt <strong>the</strong> flood may<br />
in order to participate in NFIP. This allows for awareness of flood hazards, and <strong>the</strong><br />
statistics needed to manage <strong>the</strong> floodplain program. In addition it is a tool used to rate<br />
new construction for flood insurance purposes.<br />
• Floodplain Management. In order to participate in <strong>the</strong> NFIP, communities must adopt<br />
and enforce minimum floodplain management regulations in order to facilitate mitigation<br />
to reduce, lesson, or eliminate <strong>the</strong> effects of flooding on structures.<br />
• Flood Insurance. The NFIP is a way for property owners to purchase insurance for<br />
protection against flood losses in exchange for State and community floodplain<br />
management regulations.<br />
The NFIP is an agreement between <strong>the</strong> federal government and communities. The home owner<br />
is provided <strong>the</strong> opportunity to purchase flood insurance through <strong>the</strong> NFIP, which standard<br />
4.1
insurance providers do not carry. This NFIP insurance is made available to communities that<br />
regulate development in <strong>the</strong>ir mapped floodplain to reduce <strong>the</strong> risk of flooding. More information<br />
can be <strong>found</strong> in Chapter 3 – Risk Assessment: Flood. This chapter also includes <strong>the</strong><br />
jurisdictions that actively participate in <strong>the</strong> NFIP program.<br />
4.1 Goals<br />
44 CFR Requirement 201.6©(3)(i): The hazard mitigation strategy shall include a<br />
description of mitigation goals to reduce or avoid long-term vulnerabilities to <strong>the</strong><br />
identified hazards.<br />
The planning committee for Region L developed <strong>the</strong> following goals to provide direction for <strong>the</strong><br />
elimination, reduction, and/or avoidance of hazard-related losses.<br />
During <strong>the</strong> second meeting, <strong>the</strong> planning committee looked at <strong>the</strong> goals for <strong>the</strong> three counties of<br />
Johnson, Wyandotte, and Leavenworth as written in <strong>the</strong>ir current plans. These goals were<br />
scrutinized and scrubbed to come up with <strong>the</strong> goals that best define <strong>the</strong> Region in <strong>the</strong>ir effort to<br />
reduce or avoid losses from identified hazards.<br />
Goal 1: Reduce or eliminate risk to <strong>the</strong> people and property of Region L from <strong>the</strong> impacts of <strong>the</strong><br />
identified hazards in this plan.<br />
Goal 2: Strive to protect all vulnerable populations, structures, and critical facilities in Region L<br />
from <strong>the</strong> impacts of <strong>the</strong> identified hazards.<br />
Goal 3: Improve public outreach initiatives to include education, awareness and partnerships<br />
with all entities in order to enhance understanding of <strong>the</strong> risk <strong>the</strong> Region faces due to <strong>the</strong><br />
impacts of <strong>the</strong> identified hazards.<br />
Goal 4: Enhance communication and coordination among all agencies and between agencies<br />
and <strong>the</strong> public.<br />
4.2 Mitigation Actions<br />
Requirement §201.6(c)(3)(ii): [The mitigation strategy shall include a] section that<br />
identifies and analyzes a comprehensive range of specific mitigation actions and<br />
projects being considered to reduce <strong>the</strong> effects of each hazard, with particular emphasis<br />
on new and existing buildings and infrastructure.<br />
During <strong>the</strong> kickoff meetings, <strong>the</strong> committee was provided a worksheet to facilitate <strong>the</strong><br />
development of action ideas. In addition, <strong>the</strong> committee was provided a worksheet on different<br />
types of mitigation actions.<br />
Committee members were asked to <strong>review</strong> <strong>the</strong>ir current mitigation actions and formulate new<br />
key issues identified for each hazard. They were <strong>the</strong>n asked to work with <strong>the</strong>ir jurisdictional<br />
partners to develop specific mitigation action ideas to eliminate, lessen, or avoid disaster<br />
4.2
impacts associated with each hazard. In addition, committee members were also tasked to<br />
update <strong>the</strong> status of each of <strong>the</strong>ir prior actions that were provided via handout. The status that<br />
could be assigned was on-going, deferred, completed, deleted, or merged. This status update<br />
was due at <strong>the</strong> second meeting.<br />
Prior to <strong>the</strong> second meeting each jurisdiction represented in <strong>the</strong> plan submitted new action items<br />
which were consolidated, and w<strong>here</strong> <strong>the</strong>re was duplication <strong>the</strong> actions were merged into one.<br />
The new actions were discussed for <strong>the</strong>ir validity and sustainability to be incorporated into <strong>the</strong><br />
existing action table.<br />
During <strong>the</strong> final meeting, <strong>the</strong> identified actions, new and updated, were presented to <strong>the</strong><br />
committee for <strong>the</strong>ir final <strong>review</strong>. These actions can be viewed in Table 4.1 at <strong>the</strong> end of this<br />
section.<br />
4.3 Implementation of Mitigation Actions<br />
44 CFR Requirement §201.6(c)(3)(ii): The mitigation strategy shall include an action<br />
strategy describing how <strong>the</strong> actions identified in paragraph (c)(2)(ii) will be prioritized,<br />
implemented, and administered by <strong>the</strong> local jurisdiction. Prioritization shall include a<br />
special emphasis on <strong>the</strong> extent to which benefits are maximized according to a cost<br />
benefits <strong>review</strong> of <strong>the</strong> proposed projects and <strong>the</strong>ir associated costs.<br />
In order to prioritize <strong>the</strong> mitigation actions, <strong>the</strong> planning committee elected to discard <strong>the</strong> use of<br />
<strong>the</strong> FEMA recommended STAPLEE criteria. It was decided that STAPLEE does not represent<br />
how <strong>the</strong> jurisdictions accurately prioritize <strong>the</strong> actions that <strong>the</strong>y have ranked as high, medium or<br />
low. As such, each jurisdiction was instructed to write down what <strong>the</strong>y use as <strong>the</strong>ir criteria for<br />
determining an actions high, medium, or low status. As this process unfolded <strong>the</strong> planning<br />
committee came to <strong>the</strong> realization that <strong>the</strong>re is no standard on how each jurisdiction ranks <strong>the</strong>ir<br />
actions. What is a high ranking for a hospital may only be a medium ranking for a county. This<br />
in and of itself has created a new action item for <strong>the</strong> region: to come up with a standardized<br />
ranking system across <strong>the</strong> board. In order to begin <strong>the</strong> process, <strong>the</strong> planning committee came<br />
up with <strong>the</strong> following criteria that is representative of <strong>the</strong> majority of <strong>the</strong> action rankings, albeit<br />
not all inclusive. One element that did stand out with regards to prioritization of <strong>the</strong> actions was<br />
<strong>the</strong> cost benefit <strong>review</strong>. It was agreed that this element would be considered before and during<br />
<strong>the</strong> prioritization and <strong>the</strong> implementation of <strong>the</strong> agreed upon actions. FEMA requires a 1:1 ratio<br />
of cost to benefits, which <strong>the</strong> planning committee felt was necessary to ad<strong>here</strong> to. The actual<br />
implementation of <strong>the</strong> actions by <strong>the</strong> jurisdictions were dependent on funding availability,<br />
however <strong>the</strong> planning committee were in agreement that all policies, regulations, and legal<br />
procedures would be utilized once an action was scheduled for implementation.<br />
High – Immediate danger to critical infrastructure and potential death to parts of <strong>the</strong> population,<br />
with a major loss to economic recovery should a disaster strike.<br />
Medium – Damage to critical infrastructure and injury to <strong>the</strong> population, with medium impact to<br />
<strong>the</strong> economy.<br />
Low – Jurisdictions know that <strong>the</strong> project needs to be addressed. The Population and critical<br />
infrastructure could potentially be affected but it is not imminent. Not a high priority.<br />
4.3
To <strong>the</strong> greatest extent possible this methodology was applied to <strong>the</strong> current and new actions,<br />
however, greater emphasis will be placed on this item as we begin <strong>the</strong> yearly <strong>review</strong>s in 2014.<br />
Ano<strong>the</strong>r important aspect of <strong>the</strong> mitigation strategy is <strong>the</strong> ability for <strong>the</strong> Region and its<br />
communities to implement <strong>the</strong> actions that <strong>the</strong>y have prioritized. The following are available<br />
programs and funding capabilities that can be pursued in order to meet <strong>the</strong> goals of this plan:<br />
The Hazard Mitigation Grant Program (HGMP) – The Hazard Mitigation Grant Program is<br />
authorized by Section 404 of <strong>the</strong> Robert T. Stafford Disaster Relief and Emergency Assistance<br />
Act, as amended (<strong>the</strong> Stafford Act), Title 42, United States Code (U.S.C.) 5170c. The key<br />
purpose of HMGP is to ensure that <strong>the</strong> opportunity to take critical mitigation measures to reduce<br />
<strong>the</strong> risk of loss of life and property from future disasters is not lost during <strong>the</strong> reconstruction<br />
process following a disaster. HMGP is available, when authorized under <strong>the</strong> Presidential Major<br />
Disaster Declaration, in <strong>the</strong> areas of <strong>the</strong> state requested by <strong>the</strong> governor. The amount of HMGP<br />
funding available to <strong>the</strong> applicant is based upon <strong>the</strong> total federal assistance provided by FEMA<br />
for disaster recovery under <strong>the</strong> major disaster declaration.<br />
The Pre‐Disaster Mitigation (PDM) Program - The Pre-Disaster Mitigation program is<br />
authorized by Section 203 of <strong>the</strong> Stafford Act, 42 U.S.C. 5133. The PDM program is designed to<br />
assist states, territories, Indian tribal governments, and local communities to implement a<br />
sustained pre‐disaster natural hazard mitigation program to reduce overall risk to <strong>the</strong> population<br />
and structures from future hazard events, while also reducing reliance on federal funding from<br />
future major disaster declarations.<br />
National Flood Mitigation Fund - The Act (called <strong>the</strong> Biggert-Waters Flood Insurance Reform<br />
Act of 2012, <strong>found</strong> in H.R. 4348) consolidates <strong>the</strong> three of <strong>the</strong> NFIP funded mitigation programs<br />
described below into a single program. The combined National Flood Mitigation Fund is to be<br />
funded at $90 million per year. While <strong>the</strong> old Flood Mitigation Assistance (FMA) and Severe<br />
Repetitive Loss (SRL) program were funded annually at up to $40 million per year each and <strong>the</strong><br />
Repetitive Flood Claims (RFC) program at up to $10 million annually, <strong>the</strong> SRL program was<br />
never fully utilized in part due to its complexity. More Information can be <strong>found</strong> at:<br />
http://www.fema.gov/flood-insurance-reform-act-2012. The new program simplifies and<br />
combines <strong>the</strong> three previous programs and includes <strong>the</strong> following elements:<br />
• Encourages flood mitigation planning to be integrated into a community’s multi-hazard<br />
mitigation plan,<br />
• Adds demolition/ rebuild (mitigation reconstruction) as an allowed mitigation activity<br />
under all programs,<br />
• Caps <strong>the</strong> use of mitigation grant funds for mitigation planning activities at $50,000<br />
(states) and $25,000 (communities),<br />
• Provides for denial of grant funds if not fully obligated in 5 years, and<br />
• Restructures federal share requirement:<br />
4.4
Up to 100% for severe repetitive loss structures (4+ Claims of over $5000 or 2+ claims<br />
Up to 90% for repetitive loss structures (2 claims over 10 years averaging at least 25%<br />
of value of structure)<br />
Up to 75% for o<strong>the</strong>r approved mitigation activities.<br />
Fire Management Assistance Grant Program - This program, which provides a 75 percent<br />
federal share/25 percent state share, is available to states, as well as local and tribal<br />
governments. It provides for <strong>the</strong> mitigation, management, and control of fires on publicly or<br />
privately owned forests or grasslands, which threaten such destruction as would constitute a<br />
major disaster. The process is initiated when <strong>the</strong> state requests federal assistance for an event<br />
w<strong>here</strong> <strong>the</strong> threat of major disaster exists for ei<strong>the</strong>r single fires or numerous small fires.<br />
Kansas Department of Agriculture – Division of Conservation<br />
Multipurpose Small Lakes Program - This program provides state cost-share assistance to a<br />
government entity for <strong>the</strong> construction or renovation of a dam for flood control and water supply<br />
and/or recreational purposes. It requires a general plan of works and a local nonpoint source<br />
pollution control plan.<br />
Nonpoint Source Pollution Control - KDA-DOC distributes funding for implementation of local<br />
nonpoint source pollution management plans and supports <strong>the</strong> installation of best management<br />
practices involving sediment control, abandoned water well plugging, nutrient and pesticide<br />
management, household waste disposal, livestock waste systems, onsite waste systems, dump<br />
site reclamation and chemical containment. The agency provides cost shares to local<br />
landowners for practice implementation, supports local technical assistance and provides<br />
funding for local no till information and education programs<br />
Riparian and Wetland Protection Program - This program is meant to financially assist and<br />
address <strong>the</strong> conservation and management of riparian areas and wetlands. Financial assistance<br />
is provided to implement practices such as tree planting, riparian fencing, wetland enhancement<br />
and o<strong>the</strong>r innovative bioengineering practices.<br />
State Assistance to Watershed Dam Construction - The State provides cost-share<br />
assistance to organized watershed districts and o<strong>the</strong>r special purpose districts for <strong>the</strong><br />
implementation of structural and nonstructural practices that reduce flood damage. Structural<br />
practices must be approved by <strong>the</strong> chief engineer of <strong>the</strong> Division of Water Resources.<br />
Water Quality Buffer Initiative - This program provides additional incentive for participation in<br />
<strong>the</strong> Continuous Sign-Up provision of <strong>the</strong> U.S. Department of Agriculture Conservation Reserve<br />
Program. The program supplements <strong>the</strong> federal rental payments for <strong>the</strong> Conservation Reserve<br />
Program by 30 percent for grass filter strips or 50 percent for riparian forest buffers.<br />
Water Resources Cost Share Program - This program provides state cost-share assistance to<br />
landowners for <strong>the</strong> establishment of enduring water conservation practices to protect and<br />
improve <strong>the</strong> quality and quantity of Kansas water resources. This includes targeting water<br />
4.5
quality funds to address total maximum daily load and o<strong>the</strong>r issues in priority areas, continuing<br />
base level funding to address water resource problems, technical assistance funding to<br />
landowners to implement best practices and maintaining <strong>the</strong> irrigation efficiency focus in<br />
western Kansas.<br />
Water Conservation Program - This program provides financial incentives for voluntary<br />
retirements of private water rights in high priority areas. The Water Transition Assistance<br />
Program (WTAP) and <strong>the</strong> Conservation Reserve Enhancement Program (CREP) are two<br />
projects currently operating in approved target areas. Only those water rights, which can result<br />
in significant water conservation benefits to <strong>the</strong> State’s rivers, streams and aquifers are selected<br />
for <strong>the</strong>se grants.<br />
Watershed Planning Assistance Program - The program provides financial assistance for<br />
engineering and environmental services, general plan development, and o<strong>the</strong>r flood control and<br />
rehabilitation projects in watershed districts.<br />
Water Supply Restoration Program - This program provides financial assistance to renovate<br />
and protect lakes, which are used directly as a source of water for public water supply systems,<br />
w<strong>here</strong> appropriate, and w<strong>here</strong> watershed restoration and protection practices are planned or in<br />
place. Eligible sponsors include any entity with taxing authority and <strong>the</strong> right of eminent domain,<br />
rural water districts and public wholesale water supply districts.<br />
Kansas Department of Agriculture—Division of Water Resources<br />
Community Assistance Program - KDA-DWR participates in FEMA’s Community Assistance<br />
Program, which enhances <strong>the</strong> State’s capability to provide floodplain management information<br />
and technical assistance to help local officials in NFIP and CRS participating communities. It<br />
also encourages nonparticipating communities to join <strong>the</strong> NFIP and CRS.<br />
Floodplain Management Program - KDA-DWR coordinates and provides technical assistance<br />
for local, state and federal floodplain management, including managing <strong>the</strong> NFIP and floodplain<br />
ordinances and regulations adopted by city and county governments.<br />
Levees and Drainage District Program - This program regulates <strong>the</strong> construction of levees<br />
and dikes and <strong>the</strong> formation of drainage districts to address local issues regarding drainage<br />
problems and <strong>the</strong>ir amelioration.<br />
Operations and Technical Services Program - This program provides administrative and<br />
technical support to <strong>the</strong> chief engineer of <strong>the</strong> KDA-DWR. The program addresses interstate<br />
compact administration, GIS, intensive groundwater use control areas, flow meter specifications<br />
and water assurance districts.<br />
Special Management Programs - KDA-DWR is responsible for management of water<br />
resource-related issues, such as <strong>the</strong> Groundwater Management District Act and <strong>the</strong> Intensive<br />
Groundwater Use Control Area. It also monitors <strong>the</strong> observation well network, has designated<br />
4.6
esponsibilities under <strong>the</strong> Water Assurance District Act, and <strong>review</strong>s and approves of water<br />
conservation plans.<br />
Stream Obstructions Program - This program regulates and monitors <strong>the</strong> changes in <strong>the</strong><br />
course, current, or cross section of a stream; processes applications; <strong>review</strong>s and approves<br />
plans; inspects ongoing projects before, during, and after construction; and performs ongoing<br />
safety inspections.<br />
Watershed District Program and Multipurpose Small Lakes Program - These programs<br />
support <strong>the</strong> division’s responsibilities to perform regulatory and supervisory tasks during <strong>the</strong><br />
formation of a watershed district and for projects to be built under <strong>the</strong> Small Lakes Program (see<br />
Kansas Department of Agriculture, Division of Conservation).<br />
Kansas Department of Commerce<br />
Community Service Tax Credit - This incentive program offers Kansas tax credits for<br />
contributions to approved projects. Tax credits for nonprofit organizations allow <strong>the</strong>m to improve<br />
<strong>the</strong>ir ability to undertake major capital fundraising drives. Projects eligible for tax credit awards<br />
include community service, crime prevention and health care<br />
Kansas Partnership Fund - This fund provides low-interest state loans to cities and counties<br />
for infrastructure improvements that support Kansas basic enterprises. Loans are designed to<br />
help city and county governments attract new businesses and expand existing businesses.<br />
Small Cities Community Development Block Grant Program - The department administers<br />
<strong>the</strong> CDBG program, awarding grants in four categories: community improvement, urgent need,<br />
Kansas Small Towns Environment Program and economic development. The CDBG program is<br />
a competitive grant process through which about half of <strong>the</strong> funding goes to support <strong>the</strong><br />
development of community facilities and water and sewer projects.<br />
Kansas Department of Corrections—Capital Improvements and Facilities Maintenance<br />
Mitigation-related responsibilities of <strong>the</strong> Kansas Department of Corrections include public health<br />
and safety services, property repair and rehabilitation and property acquisition.<br />
Kansas Department of Education<br />
The Department oversees <strong>the</strong> education of students in Kansas in grades K-12.<br />
Unified School Districts in Kansas are encouraged to participate in local multi-jurisdictional<br />
hazard mitigation plans and identify mitigation actions. Many mitigation actions include<br />
construction of tornado safe rooms in <strong>the</strong>ir buildings; education on hazards and ongoing<br />
required drills to protected lives during fires, tornadoes, and intruders.<br />
Kansas Department of Health and Environment—Bureau of Environmental Remediation<br />
4.7
Abandoned Mine Land Program - The Surface Mining Section is responsible for <strong>the</strong><br />
reclamation of abandoned coalmines in Kansas and administers federal funds from <strong>the</strong> Office of<br />
Surface Mining Reclamation and Enforcement to address past mining problems that are<br />
hazardous to <strong>the</strong> health, safety, and general welfare of <strong>the</strong> public. Reclamation includes land<br />
clearing, backfilling and grading, erosion and site drainage control, guardrail and fence<br />
installation, demolition and disposal, and revegetation. The Abandoned Land Mine Emergency<br />
Program provides for <strong>the</strong> remediation of sites that are an immediate threat to <strong>the</strong> health and<br />
safety of <strong>the</strong> general public. These problems require prompt action and <strong>the</strong>refore cannot be<br />
reclaimed through ordinary program procedures. Kansas currently has over 350 abandoned<br />
coal mine sites identified with health and safety problems. Typical abatement activities include<br />
backfilling mine subsidence holes in residential areas and near roads and filling subsurface<br />
voids beneath structures and roads with cement grout.<br />
Kansas Brownfields Program - Brownfields are real property, <strong>the</strong> expansion, redevelopment,<br />
or reuse of which may be complicated by <strong>the</strong> presence or potential presence of a hazardous<br />
substance, pollutant, or contaminant. Often <strong>the</strong> potential liability associated with contamination<br />
complicates business development, property transactions, or expansion on <strong>the</strong>se properties.<br />
Cleaning up and redeveloping brownfields properties is necessary to preserve neighborhoods,<br />
reduce urban sprawl, and stop <strong>the</strong> continued development of new industrial and commercial<br />
facilities on farmland. By investigating and cleaning up a brownfields property and taking care of<br />
<strong>the</strong> site's potential health or environmental risks, communities can use local land again -<br />
producing jobs, increasing <strong>the</strong> tax base, or adding o<strong>the</strong>r benefits such as creating a park or<br />
residential area.<br />
Almost every city and county, in both rural and urban areas, has brownfields properties. KDHE<br />
currently has programs to assist communities with <strong>the</strong> redevelopment of brownfields properties.<br />
State Water Plan Contamination Remediation Program - Funding from <strong>the</strong> State Water Plan<br />
Fund is provided for <strong>the</strong> evaluation, monitoring, and remediation of contaminated groundwater<br />
or surface water sites, as well as contamination source areas in Kansas w<strong>here</strong> <strong>the</strong> responsible<br />
party is not known or is unable or unwilling to undertake <strong>the</strong> necessary action. The program also<br />
provides funding to supply alternate water sources as an emergency response action to<br />
residences with contaminated drinking water sources.<br />
Kansas Department of Insurance<br />
The Department provides estimates of storm losses in Kansas since 2002 as a public service<br />
http://www.ksinsurance.org/storms/index.php . The data consists of windstorm, tornado and hail<br />
damage or o<strong>the</strong>r wea<strong>the</strong>r-related claim losses for insured real and personal property. It is<br />
reported for each calendar year and monthly during <strong>the</strong> calendar year. The Department also<br />
promotes flood and earthquake insurance as a pre-mitigation measure.<br />
4.8
Kansas Department of Transportation<br />
Corridor Management Program - The purpose of this program is to balance traffic and access<br />
management with land use management to protect public safety, public investment in <strong>the</strong><br />
highway system, and private investment in property development on adjacent lands. The goal of<br />
corridor management is to create and preserve safe, efficient, and economically viable<br />
transportation corridors.<br />
Transportation Enhancement Program - This is an annual competitive Federal Transportation<br />
Enhancement funded program that can be used for transportation enhancement activities that<br />
include environmental mitigation to address water pollution due to highway runoff or reduce<br />
vehicle-caused wildlife mortality while maintaining habitat connectivity.<br />
Kansas Forest Service<br />
Community Forestry Program - This program provides assistance, education, and support to<br />
communities and municipalities in organizing urban and community forestry programs,<br />
identifying resource needs, setting priorities of work, and training city employees<br />
Rural Forestry Program - Professional foresters provide “on-site” forest management and agro<br />
forestry analysis and recommendations through inventory of forests, woodlands and<br />
windbreaks.<br />
Conservation Tree Planting Program - The tree-planting program provides tree and shrub<br />
seedlings for conservation plantings to establish forests, woodlands and shelterbelts ant to<br />
mitigate loss of forestland.<br />
Environmental Education and Financial Assistance - The Kansas Forest Service provides a<br />
variety of publications, field days and workshops all available on <strong>the</strong> Web at<br />
www.kansasforests.org.The Kansas Forest Service administers <strong>the</strong> Volunteer Fire Assistance<br />
cost-share grant program that provides financial assistance to fire departments. Such programs<br />
as <strong>the</strong> USDA conservation programs provide for incentives to protect and implement forestry<br />
practices through <strong>the</strong> Environmental Quality Incentives Program (EQIP), <strong>the</strong> Cooperative<br />
Conservation Partnership Initiative, <strong>the</strong> Continuous Conservation Reserve Program and o<strong>the</strong>r<br />
programs are available to landowners.<br />
Firewise Program - The Kansas Firewise program offers prevention <strong>material</strong>s for homeowners<br />
to reduce <strong>the</strong> threat of wildland fire in rural and high-risk areas. T<strong>here</strong> is currently only one<br />
Firewise community in Kansas.<br />
Forest Health Program - This program monitors <strong>the</strong> impacts of insects, diseases, drought,<br />
flooding and o<strong>the</strong>r health issues in forests, woodlands, windbreaks and conservation tree<br />
plantings by providing diagnosis and control recommendations and mitigation and planning for<br />
Emerald Ash Borer, Asian Bush Honeysuckles and o<strong>the</strong>r invasive species.<br />
4.9
Forest Stewardship - Develops long-term comprehensive management plans and specific<br />
project plans for tree planting, forest stand improvement, timber harvest and windbreak<br />
establishment and renovation. The program maximizes and mitigates <strong>the</strong> forest and agro<br />
forestry benefits of water quality, clean air, aes<strong>the</strong>tics, wildlife, soil conservation, recreation, and<br />
timber products.<br />
Streamside Forestry Program – Assesses protects and establishes trees adjacent to streams<br />
and rivers with <strong>the</strong> primary objective of improving water quality by stabilizing stream banks and<br />
providing vegetative filters between crop fields and waterways.<br />
Landowner Education - The agency provides information and education to farmers regarding<br />
<strong>the</strong> benefits of good forest management. This includes information about federal cost share<br />
practices including <strong>the</strong> Environmental Quality Incentives Program, Conservation Reserve<br />
Program, and <strong>the</strong> Riparian and Wetland Protection Program.<br />
Rural Fire Protection - The agency provides fire support services to rural fire departments,<br />
including wildfire training, Smokey Bear fire prevention <strong>material</strong>s, and <strong>the</strong> acquisition and<br />
distribution of excess military vehicles for conversion to firefighting units.<br />
Kansas Geological Survey<br />
High Plains Aquifer Information Network (HIPLAIN) - This joint effort between <strong>the</strong> Kansas<br />
Geological Survey and Kansas State University is dedicated to providing information, data, and<br />
resources related to <strong>the</strong> High Plains aquifer.<br />
Information Collection and Dissemination - The Kansas Geological Survey develops and<br />
hosts web-based information retrieval systems to allow access to water-related data<br />
accumulated since 1975.<br />
Ogallala Aquifer Study - The Kansas Geological Survey conducts research on <strong>the</strong> extent and<br />
characteristics of <strong>the</strong> groundwater resources to better plan to meet future water needs.<br />
Surface Water Groundwater Interactions - This program develops integrated computer<br />
models for surface water and groundwater hydrology, develops hydraulic characterizations of<br />
<strong>the</strong> stream-aquifer interface, and studies <strong>the</strong> physical and chemical processes of stream-aquifer<br />
interactions in <strong>the</strong> middle Arkansas River sub basin and <strong>the</strong> Walnut River basin.<br />
Kansas Highway Patrol<br />
Federal Preparedness Grant Program - Through this program, <strong>the</strong> Department of Homeland<br />
Security/FEMA provides funding to states to prevent, respond to, and recover from acts of<br />
terrorism by enhancing and sustaining capabilities. This program has been ongoing since<br />
federal fiscal year 1999 and <strong>the</strong> funding level varies each year.<br />
Kansas State Fire Marshal’s Office<br />
4.10
Fire Prevention Program - This program focuses on structural inspection to ensure compliance<br />
with <strong>the</strong> Kansas Fire Prevention Code. The Kansas State Fire Marshal’s Office works with local<br />
jurisdictional authorities. In addition, <strong>the</strong> Fire Prevention Division regulates <strong>the</strong> storage of highly<br />
flammable <strong>material</strong>s; oversees businesses involved in selling fire extinguishers, alarms, and<br />
sprinkler systems; and regulates fireworks manufacturers and displays. The division also tracks<br />
annual school fire and tornado drills.<br />
Hazardous Materials Program - The Hazardous Materials Division is charged with developing,<br />
training, equipping, and supporting 12 regional hazardous <strong>material</strong>s/weapons of mass<br />
destruction (WMD) response teams across <strong>the</strong> State. These teams support local first<br />
responders in hazardous <strong>material</strong>s incidents, accidents, and acts of terrorism. They provide<br />
training, planning, and analysis related to hazardous <strong>material</strong>s accidents/incidents and WMD<br />
events to help local facilities and local, state, and federal agencies before an event occur. These<br />
teams are trained in <strong>the</strong> Incident Command System, facility pre-planning (which includes<br />
performing vulnerability analyses), and coordination among local, state, and federal agencies.<br />
Many of <strong>the</strong>se trained personnel serve on local emergency planning committees, providing<br />
expertise and assistance to numerous communities. The division coordinates with o<strong>the</strong>r state<br />
agencies for training and actual hazardous <strong>material</strong>s/terrorism response.<br />
Kansas Water Office<br />
Assessment and Evaluation - The Kansas Water Office assesses water resource conditions<br />
and assists in identification of priority areas to target state financial and technical assistance and<br />
to provide a baseline, against which progress in meeting objectives can be measured.<br />
Drought Monitoring - The Kansas Water Office, with <strong>the</strong> approval of <strong>the</strong> Kansas Water<br />
Authority, develops guidelines which indicate when drought conditions exist in <strong>the</strong> state.<br />
Conditions are routinely monitored and when drought conditions exist, <strong>the</strong> Kansas Water Office<br />
informs <strong>the</strong> Governor and recommends assembly of <strong>the</strong> Governor’s Drought Response Team. A<br />
periodic Kansas Drought Report is prepared and posted on <strong>the</strong> website of <strong>the</strong> Kansas Water<br />
Office.<br />
Governor’s Drought Response Team - This team, chaired by <strong>the</strong> Kansas Water Office, is<br />
responsible for implementing an interagency state response to drought that is properly<br />
coordinated with local and federal response activities at all drought stages. The team is<br />
consulted on drought status declarations and responses.<br />
Drought Operations Plan - An operations plan spelling out team membership, leadership, and<br />
procedures was updated and approved by <strong>the</strong> Governor in June 2012. It identifies individual<br />
agency responsibilities at three drought stages. This operations plan outlines a phased<br />
approach to drought response keyed to three county drought stages declared by <strong>the</strong> Governor:<br />
watch, warning and emergency. Specific agency actions to be taken at each stage are<br />
identified. The Kansas Water Office developed <strong>the</strong> operations plan with input from state and<br />
federal agency members of <strong>the</strong> response team.<br />
4.11
Kansas State Water Plan - The Kansas Water Office develops and maintains a comprehensive<br />
state water plan, which is approved by <strong>the</strong> Kansas Water Authority. The Kansas Water Plan<br />
addresses <strong>the</strong> management, conservation, and development of <strong>the</strong> water resources of <strong>the</strong> state.<br />
It involves all water-related agencies and is organized into policy and basin sections. Twelve<br />
basin advisory committees provide advice to <strong>the</strong> director and <strong>the</strong> Kansas Water Authority in this<br />
regard. The State Water Plan Fund is dedicated to implementing recommendations made in <strong>the</strong><br />
Kansas Water Plan.<br />
Public Information and Education - This public education program provides information on<br />
water resource issues to <strong>the</strong> general public through publication of articles, pamphlets, news<br />
reports, etc. It also provides support for environmental education and local leadership<br />
development programs.<br />
Stream Gauging Program - State financial assistance is provided for <strong>the</strong> operation of selected<br />
gauging stations operated by <strong>the</strong> U.S. Geological Survey. These gages provide real-time stream<br />
flow data to facilitate decision making regarding water rights, minimum desirable stream flows,<br />
flood monitoring, reservoir management, and water quality monitoring and analysis.<br />
Technical Assistance to Water Users - This program provides technical assistance to<br />
municipalities, irrigators, and o<strong>the</strong>r groups to assist in <strong>the</strong> reduction of water use and improve<br />
water use efficiency.<br />
Water Assurance Program - This program augments stream flow during periods of low flow<br />
through releases from water supply storage in federal reservoirs to satisfy downstream<br />
municipal and industrial water rights during drought conditions. The authorizing legislation<br />
allows municipal and industrial water right holders to form assurance districts and contract with<br />
<strong>the</strong> state for storage space in <strong>the</strong> federal reservoirs. Three water assurance districts have been<br />
formed by water users on <strong>the</strong> Kansas River, Marais des Cygnes River, and <strong>the</strong> Neosho-<br />
Cottonwood Rivers.<br />
Water Conservation Program - The Kansas Water Office develops guidelines for irrigation and<br />
municipal water conservation plans and practices. Municipal guidelines, revised in 2007,<br />
address drought response in addition to long-term water conservation.<br />
Water Marketing Program - Through this program, <strong>the</strong> state sells water to municipal and<br />
industrial water users from state-owned water storage facilities in 13 federal reservoirs.<br />
Revenues repay <strong>the</strong> costs of <strong>the</strong> water supply storage space, operations, and maintenance to<br />
<strong>the</strong> federal government. The Kansas Water Office contracts with municipal and industrial water<br />
users wishing to obtain water from this storage. Contracts are approved by <strong>the</strong> Kansas Water<br />
Authority. T<strong>here</strong> are presently 32 contracts for water from this storage. Some users have more<br />
than one contract and some sell treated water at wholesale prices to o<strong>the</strong>r water systems.<br />
Water Supply and Demand Estimates - These estimates provide a consistent set of longrange<br />
population and water demand projections for planning purposes. Since 2006, supply and<br />
demand projections have been made for all basins that have access to federal storage.<br />
4.12
Projections by county and public water supplier were made in 1998 by decade out to 2040;<br />
<strong>the</strong>se are being updated on an as needed basis for specific projects.<br />
Kansas Wildlife, Parks and Tourism<br />
State Wildlife Grants Private Lands Program - This program provides cost-share to private<br />
landowners for <strong>the</strong> construction, establishment, and enhancement of grasslands, wetlands and<br />
riparian habitat. Request for proposals are announced annually and funds are awarded based<br />
on ecological priorities.<br />
Project Review Program - This program provides technical assistance to project sponsors to<br />
mitigate impacts to grassland, wetland, and stream habitat as a result of development projects.<br />
Staff works with development sponsors to avoid and minimize impacts through native habitat<br />
restoration measures and natural stream design techniques.<br />
Stream Survey and Assessment Program - The purpose of this program is to document <strong>the</strong><br />
current range and distribution of aquatic species, including aquatic nuisance species. O<strong>the</strong>r<br />
objectives include establishing baseline data and monitoring fish kill and o<strong>the</strong>r natural resource<br />
damage assessments.<br />
FEMA Risk Mapping, Assessment, and Planning (Risk Map)<br />
In fiscal year 2009, FEMA began transitioning from Flood Map Modernization to Risk MAP. The<br />
Risk MAP strategy incorporates floodplain management with hazard mitigation by using tools<br />
such as DFIRMS, HAZUS reports, and risk assessment data to deliver quality data that<br />
increases public awareness and leads to action to reduce risk to life and property.<br />
National Oceanic and Atmospheric Administration StormReady Program<br />
StormReady is a voluntary program that was developed by <strong>the</strong> National Oceanic and<br />
Atmospheric Administration (NOAA) National Wea<strong>the</strong>r Service (NWS) to help communities<br />
better prepare for and mitigate effects of all types of severe wea<strong>the</strong>r—from tornadoes to<br />
flooding. The program encourages communities to take a new, proactive approach to improving<br />
local hazardous wea<strong>the</strong>r operations by providing emergency managers with clear-cut guidelines<br />
on how to improve <strong>the</strong>ir hazardous wea<strong>the</strong>r operations. StormReady is designed to help<br />
community leaders and emergency managers streng<strong>the</strong>n local safety programs. To be officially<br />
StormReady, a community must:<br />
• Establish a 24-hour warning point and emergency operations center,<br />
• Have more than one way to receive severe wea<strong>the</strong>r warnings and forecasts and to alert<br />
<strong>the</strong> public,<br />
• Create a system that monitors wea<strong>the</strong>r conditions locally,<br />
• Promote <strong>the</strong> importance of public readiness through community seminars, and<br />
4.13
• Develop a formal hazardous wea<strong>the</strong>r plan, which includes training severe wea<strong>the</strong>r<br />
spotters and holding emergency exercises.<br />
In Kansas, <strong>the</strong>re are 27 counties, nine communities, two military sites, two universities and one<br />
commercial site that are recognized as StormReady.<br />
U.S. Army Corps of Engineers<br />
T<strong>here</strong> are several relevant U.S. Army Corps of Engineers (USACE) Civil Works programs that<br />
are mitigation related in Kansas and overlap with <strong>the</strong> Kansas Hazard Mitigation Team. Those<br />
programs include: floodplain management services, planning assistance to <strong>the</strong> states,<br />
Continuing Authority Program (Section 14, Section 205, Section 208; or known as Emergency<br />
Streambank Protection Projects, Small Flood Control Projects, Snagging and Clearing for Flood<br />
Control Projects), general investigations (planning studies), construction flood projects,<br />
inspection of completed works, and rehabilitation and inspection program.<br />
Silver Jackets - This is <strong>the</strong> USACE Civil Works program enabling participation in <strong>the</strong> KHMT.<br />
Some of <strong>the</strong> states use <strong>the</strong> name Silver Jackets, however, many of <strong>the</strong> teams have existed<br />
longer than <strong>the</strong> inception of Silver Jackets around 2009. The Lead Silver Jackets Coordinator<br />
for Kansas directly participates on <strong>the</strong> KHMT, representing all <strong>the</strong> USACE districts within <strong>the</strong><br />
State at <strong>the</strong> team’s regular meetings. The lead coordinator provides regular status updates,<br />
available on request. The status updates provide detail information on active USACE projects<br />
and programs, including specific project information that is useful during <strong>the</strong> FEMA Risk MAP<br />
Discovery Phases. The Silver Jackets Coordinator participates in <strong>the</strong> FEMA Risk MAP<br />
Resiliency Meeting.<br />
Regional State Risk Management Team - This is <strong>the</strong> hazard mitigation teams in <strong>the</strong> four<br />
stateregion of Kansas, Iowa, Missouri, and Nebraska, with a focus on <strong>the</strong> Missouri River. The<br />
team is primarily composed of <strong>the</strong> state agency officials directing those state teams and<br />
representatives from <strong>the</strong> local USACE Districts. The KHMT co-leads are one of <strong>the</strong> four states<br />
leading this broader team.<br />
Levee Safety Program - The KHMT gets periodic updates on this USACE Civil Works program.<br />
Note <strong>the</strong> USACE is not responsible for all levees in <strong>the</strong> Nation, and <strong>the</strong> Kansas Department of<br />
Agriculture, Division of Water Resources already has an active levee program. The USACE<br />
Levee Safety Program activities have complemented KHMT work and have included<br />
establishing a National Levee Database, inspecting levees, communicating risks, taking steps to<br />
reduce risks, and establishing a levee safety portfolio internally at USACE for prioritizing levee<br />
work.<br />
Dam Safety Program - This USACE program complements <strong>the</strong> Kansas Department of<br />
Agriculture, Division of Water Resources work with state dams. The USACE Dam Safety<br />
Program focuses on <strong>the</strong> large reservoirs, many of which are multipurpose. Reservoirs act<br />
toge<strong>the</strong>r with levees and o<strong>the</strong>r infrastructure to reduce impacts of floods, and <strong>the</strong> reservoirs may<br />
4.14
also maintain flows for navigation downstream. The program is a little older than <strong>the</strong> program on<br />
levee safety and also has a risk portfolio for prioritizing dam work.<br />
Emergency Management - This USACE Civil Works program addresses flood fighting and <strong>the</strong><br />
rehabilitation of damaged infrastructure, such as levees or dams. In addition, major disasters<br />
and emergencies are also coordinated through this program.<br />
Missouri River Basin Water Management - The flows of <strong>the</strong> Missouri River are managed by<br />
<strong>the</strong> USACE Northwestern Division. Eight authorized purposes must be addressed, including<br />
flood risk management. Flows from <strong>the</strong> Kansas River are part of <strong>the</strong> Missouri River Basin, and<br />
<strong>the</strong> Kansas City District Water Management handles this. In sou<strong>the</strong>rn Kansas, <strong>the</strong> Tulsa District<br />
does water control for Arkansas River as part of <strong>the</strong> USACE Southwestern Division. The Water<br />
Control staff manages <strong>the</strong> following reservoirs: Big Hill, Council Grove, El Dorado, Elk City, Fall<br />
River, John Redmond, Marion, and Toronto lake projects.<br />
Kansas Water, Wastewater, Gas and Electric Utility Mutual Aid Program (KSMAP)<br />
KSMAP has been developed to serve as <strong>the</strong> mutual aid program for Kansas utilities. The project<br />
is a joint effort of Kansas Municipal Utilities, Kansas Rural Water Association, <strong>the</strong> Kansas<br />
Section – American Water Works Association, <strong>the</strong> Kansas Water Environment Association,<br />
Kansas Corporation Commission, Kansas Department of Health & Environment and <strong>the</strong> Kansas<br />
Division of Emergency Management. The organizations participating in KSMAP stand ready to<br />
help with inter-utility assistance of equipment, <strong>material</strong>s and personnel to assist in <strong>the</strong><br />
restoration and continuation of utility service for those utilities needing assistance (source:<br />
http://ksmap.org/general/KSMAPProgram.pdf).<br />
Watershed Restoration and Protection Strategy<br />
The Kansas Watershed Restoration and Protection Strategy (WRAPS), http://www.kswraps.org/<br />
offers a framework that engages citizens and o<strong>the</strong>r stakeholders in a teamwork environment<br />
aimed at protecting and restoring Kansas watersheds. The WRAPS framework consists of<br />
identifying watershed restoration and protection needs, establishing watershed goals, creating<br />
cost-effective action plans to achieve established goals, and implementing <strong>the</strong> action plans.<br />
Each watershed served by a WRAPS team completing <strong>the</strong> program framework is eligible for<br />
WRAPS grant funding. The WRAPS funds are administered by <strong>the</strong> Kansas Water Office in<br />
collaboration with an interagency Work Group, which consists of representatives from a number<br />
of state and federal agencies.<br />
4.15
Mitigation Actions Region L<br />
Red = deleted or merged with o<strong>the</strong>r actions to form a new combined action.<br />
Blue = New Action since last plan<br />
Green = Completed<br />
Black = Action from last plan that has been carried forward to <strong>the</strong> new plan<br />
Table 4.1 Region L Mitigation Actions (new, old, updated, and completed)<br />
Action ID Action/Description Priority Goal(s)<br />
Addressed<br />
Reg 1 Continue Training Responders to<br />
Hazardous & Radiological<br />
<strong>material</strong> spills<br />
Reg 2<br />
Reg 3<br />
Reg 4<br />
Continue Participation with <strong>the</strong><br />
Kansas City Regional Terrorism<br />
Early Warning Group (TEW)<br />
Increase public & fire dept.<br />
training on wildland urban<br />
interface fires.<br />
Create a standardized ranking<br />
system for action items in <strong>the</strong><br />
Mitigation Plan. Currently each<br />
jurisdiction ranks <strong>the</strong>ir actions<br />
without any standard criteria. By<br />
implementing High, Medium, and<br />
Low criteria for ranking actions,<br />
<strong>the</strong> whole region will be on <strong>the</strong><br />
same page.<br />
M 3 Hazardous Materials<br />
& Radiological<br />
Materials<br />
Region L<br />
Hazard Addressed Status Responsible Entity Estimated cost, Funding Source,<br />
and Completion Date<br />
New: Ongoing/Open<br />
Emergency Managers for Cost:<br />
Region L<br />
Funding:<br />
Ended<br />
Completion Date: Open Ended<br />
M 3 Terrorism New: Ongoing/Open<br />
Ended<br />
L 3 Wildfire New: Ongoing/Open<br />
Ended<br />
Emergency Managers for<br />
Region L<br />
Fire Chiefs within Region L<br />
L 1,2,3,4 All Hazards New Emergency Managers for<br />
Johnson, Leavenworth, and<br />
Wyandotte Counties.<br />
Participation by Planning<br />
Committee.<br />
Cost:<br />
Funding:<br />
Completion Date: Open Ended<br />
Cost:<br />
Funding:<br />
Completion Date: Open Ended<br />
Cost: Free<br />
Funding: NA<br />
Completion Date: August 2014<br />
4.16
Johnson County<br />
Action<br />
ID<br />
Co. 1<br />
Co. 2<br />
Co. 3<br />
Co. 4<br />
Co. 5<br />
Co. 5a<br />
NEW<br />
Action/Description Priority Goal(s)<br />
Addressed<br />
Active Building code enforcement to<br />
align with <strong>the</strong> national level.<br />
Johnson County believes in active<br />
code enforcement and follows<br />
national standards regarding all<br />
building codes. In <strong>the</strong> past we have<br />
adopted, within a reasonable time,<br />
all code enhancements as deemed<br />
applicable and useful in <strong>the</strong><br />
unincorporated areas of <strong>the</strong> county.<br />
NFIP – Continued regulatory<br />
compliance and floodplain<br />
management. Current minimum<br />
federal requirements allow fill in <strong>the</strong><br />
floodplain and rising of <strong>the</strong> water<br />
surface elevation. Restrict/eliminate<br />
development in <strong>the</strong> existing and<br />
future conditions floodplains and<br />
acquire land if necessary<br />
Acquisition/Demolition of flood<br />
prone properties. Many habitable<br />
buildings are located in <strong>the</strong><br />
floodplain and/or are subject to<br />
flooding. Identify habitable<br />
buildings in <strong>the</strong> floodplain and/or<br />
are subject to flooding, prioritize<br />
locations, and purchase buildings<br />
as funding becomes available.<br />
Educate public on impacts of major<br />
disease outbreak by working with<br />
health care providers, government<br />
agencies, and <strong>the</strong> public to monitor,<br />
educate, and promote <strong>the</strong><br />
mitigation of a major disease<br />
outbreak.<br />
Educate <strong>the</strong> impacts of winter<br />
storms including power outages via<br />
web based education, presentations,<br />
and participation with regional<br />
partners.<br />
Educate <strong>the</strong> public on <strong>the</strong> impacts<br />
of all hazards through all means<br />
Johnson County<br />
Hazard Addressed Status Responsible Entity Estimated cost, Funding Source, and<br />
Completion Date<br />
Johnson Co. Planning<br />
Cost: Unknown<br />
Building Official will <strong>review</strong> all Funding: County funding, and federal<br />
enhancements to building codes as identified<br />
on <strong>the</strong> national level and<br />
Completion Date: Open Ended<br />
consider adopting those as<br />
appropriate based on <strong>the</strong><br />
agreement of<br />
<strong>the</strong> Board of County<br />
Commissioners.<br />
H 1,2 All Hazards Ongoing/Open<br />
Ended<br />
H 1,2 Flood Ongoing/Open<br />
Ended<br />
Johnson County Public Works,<br />
Flood Plain Manager<br />
H 1 Flood On-going Johnson County Public Works,<br />
Acting Director<br />
H 3 Major Disease Outbreak Deleted –<br />
merged in<br />
County 5a<br />
H 3 Winter Storms Deleted –<br />
merged in<br />
County 5a<br />
H 3 All Hazards New – Ongoing/Open<br />
Johnson County Emergency<br />
Management<br />
Johnson County Emergency<br />
Management<br />
Johnson County Emergency<br />
Management, Assistant Director<br />
Cost: Unknown,<br />
Funding: State and Federal Sources<br />
Completion Date: Open Ended<br />
Cost: Unknown<br />
Funding: Stormwater Management<br />
Program, State and Federal agencies<br />
Completion Date<br />
Cost: Unknown,<br />
Funding: State of Kansas and<br />
Federal Sources<br />
Completion Date:: Merged<br />
Cost: Unknown,<br />
Funding: State of Kansas and<br />
Federal Sources<br />
Completion Date: Merged<br />
Cost: Unknown<br />
Funding: State of Kansas and Federal<br />
4.17
Co. 6<br />
Co. 7<br />
Co. 8<br />
necessary including with regional<br />
partners, state and federal partners<br />
in order to facilitate mitigation<br />
techniques to reduce <strong>the</strong> impacts of<br />
hazards.<br />
Safe Rooms in all future buildings<br />
built by <strong>the</strong> County. Kansas was <strong>the</strong><br />
highest rated state for <strong>the</strong> number<br />
of tornadoes in 2008 at 168. In<br />
addition, <strong>the</strong> area is often battered<br />
by high wind events that cause<br />
extensive damage. The County has<br />
plans to <strong>review</strong> <strong>the</strong> concept of<br />
adding a tornado refuge built to<br />
FEMA standards in all new<br />
construction because of this issue.<br />
Johnson County government will<br />
<strong>review</strong> all future building plans and<br />
<strong>review</strong> <strong>the</strong> ability to add a safe room<br />
for citizens and employees in<br />
buildings such as libraries, public<br />
safety buildings, general use<br />
buildings and o<strong>the</strong>r buildings as<br />
appropriate. They will seek federal<br />
funding to assist with <strong>the</strong> building of<br />
<strong>the</strong> safe room.<br />
All-Hazard education for mitigation,<br />
preparedness, response, & recovery<br />
Johnson County has many<br />
identified hazards that <strong>the</strong> public<br />
needs to be educated how<br />
to mitigate, prepare for, respond to<br />
and recover from to ensure that all<br />
citizens and businesses are as<br />
prepared as possible. Johnson<br />
County will give public<br />
presentations, use of web 2.0<br />
resources, multimedia, and print<br />
publications. The County will work<br />
with all citizens and businesses to<br />
help <strong>the</strong>m understand <strong>the</strong> hazards<br />
and how to prepare <strong>the</strong>mselves as<br />
well as how to mitigate hazards if<br />
possible<br />
Improve flood hazard areas through<br />
<strong>the</strong> use of conveyance system<br />
structural improvement.<br />
Conveyance system structural<br />
improvements can be an effective<br />
means for flood damage reduction.<br />
H 1 Tornado Ongoing/Open<br />
Ended<br />
H 3 All Hazards Ongoing/Open<br />
Ended<br />
H 1 Flood Ongoing/Open<br />
Ended<br />
Ended Community Preparedness Sources<br />
Completion Date: Open Ended<br />
Johnson County Facilities,<br />
Director<br />
Johnson County Emergency<br />
management, Asst. Director<br />
Community Preparedness<br />
Johnson County Public Works,<br />
Acting Director<br />
Cost: Unknown<br />
Funding: County funding, Federal as<br />
identified<br />
Completion Date: Open ended<br />
Cost: $10,000 per year,<br />
Funding: county funding, federal as<br />
identified<br />
Completion Date: On-going/Open<br />
Ended<br />
Cost: Unknown<br />
Funding: Stormwater Management<br />
Program, state and federal agencies<br />
Completion Date: Open Ended<br />
4.18
Prioritize locations w<strong>here</strong> flood<br />
damages have/may occur and<br />
design/construct improvements as<br />
funding becomes available.<br />
Co. 9 Educate <strong>the</strong> impacts of lightning M 3 Lightning Deleted –<br />
merged in<br />
County 5a<br />
Co. 10<br />
Co. 11<br />
Co. 12<br />
Co. 13<br />
Low-water crossing elimination<br />
based on risk and traffic count.<br />
Numerous low-water crossings exist<br />
in <strong>the</strong> county that are a threat to <strong>the</strong><br />
traveling public. Prioritize low-water<br />
crossings based on risk and traffic<br />
count. Eliminate crossings as<br />
funding becomes available.<br />
Flood warning system<br />
implementation. Provide <strong>the</strong> ability<br />
to warn residents and <strong>the</strong> traveling<br />
public about potential/actual<br />
flooding that threatens people,<br />
property and travel.<br />
Additional outdoor warning sirens<br />
with a computer based digital<br />
monitoring system so that defects or<br />
maintenance issues will be reported<br />
immediately as <strong>the</strong>y occur. As new<br />
development is created in <strong>the</strong><br />
County, additional outdoor warning<br />
sirens will be needed. Purchase<br />
and install additional emergency<br />
warning sirens along with a<br />
computer based digital monitoring<br />
system so that defects or<br />
maintenance issues will be reported<br />
immediately as <strong>the</strong>y occur.<br />
Promote Private Insurance.<br />
Johnson County will promote<br />
private insurance for Hail & Fog,<br />
Lightening, Expansive soils, land<br />
subsidence, landslides, earthquake<br />
that causes of personal injury,<br />
damage to <strong>found</strong>ations and roofs,<br />
loss in inventory (car lots), & auto<br />
damage from wrecks. Johnson<br />
County experienced a hail storm in<br />
1996 that caused an estimated $10<br />
million dollars in insured and<br />
uninsured losses. The County<br />
experiences many hail events as<br />
M 1 Flood Ongoing/Open<br />
Ended<br />
M 4 Flood Ongoing/Open<br />
Ended<br />
M 4 Tornado, Windstorm Ongoing/Open<br />
Ended<br />
M 3 All Hazards Ongoing/Open<br />
Ended<br />
Johnson County Emergency<br />
Management<br />
Johnson County Public Works,<br />
Acting Director<br />
Johnson County Public Works and<br />
Johnson County Emergency<br />
Management, Asst. Director of<br />
Operations<br />
Johnson County Emergency<br />
Management, Asst Director of<br />
Operations<br />
Johnson County Emergency<br />
Management, Asst. Director of<br />
Community Preparedness<br />
Cost: Unknown<br />
Funding: State of Kansas, federal<br />
sources<br />
Completion Date: NA<br />
Cost: Unknown<br />
Funding: Stormwater Management<br />
Program, State and federal agencies<br />
Completion Date: Open Ended<br />
Cost: Unknown<br />
Funding: Stormwater Management<br />
Program, state and federal agencies<br />
Completion Date: Open Ended<br />
Cost: Unknown<br />
Funding: Annual Budget and HMGP<br />
grants.<br />
Completion Date: Open Ended<br />
Cost: Unknown<br />
Funding: State of Kansas, federal<br />
sources<br />
Completion Date: Open Ended<br />
4.19
Co. 14<br />
Co.15<br />
MultiJ 1<br />
MultiJ 2<br />
MultiJ 3<br />
well as auto damage during <strong>the</strong><br />
course of a year. In addition, house<br />
settling causes impacts to building /<br />
house <strong>found</strong>ations.<br />
Promote Crops Insurance. County<br />
will work with KSU Extension to<br />
promote crop insurance in <strong>the</strong><br />
County – to insure against natural<br />
hazards such as agricultural<br />
infestation, soil erosion, extreme<br />
temperatures, wildfire, windstorm,<br />
winter storm, tornado, flooding &<br />
drought.<br />
Flood proof Buildings. Many<br />
buildings are located in <strong>the</strong><br />
floodplain and/or are subject to<br />
flooding. If buyout is not an option,<br />
installing/completing flood proofing<br />
techniques can minimize <strong>the</strong><br />
potential for loss of life and property<br />
damage. Identify habitable buildings<br />
in <strong>the</strong> floodplain and/or are subject<br />
to flooding, prioritize locations,<br />
install/complete flood proofing<br />
techniques for buildings as funding<br />
becomes<br />
available if buyout is not an option.<br />
Safe Rooms in Private Non-Profit<br />
Schools. Kansas was <strong>the</strong> highest<br />
rated state for <strong>the</strong> number of<br />
tornadoes in 2008 at 168. In<br />
addition, <strong>the</strong> area is often battered<br />
by high wind events that cause<br />
extensive damage. Private nonprofit<br />
schools in Johnson County<br />
will <strong>review</strong> <strong>the</strong> concept of adding a<br />
tornado refuge built to FEMA<br />
standards in all new construction.<br />
Build safe rooms/”hardened” room<br />
in private non-profit school<br />
attendance centers in accordance<br />
with FEMA publication #361,<br />
“Design and Construction Guidance<br />
for Community Shelters”.<br />
Continue Training Responders to<br />
Hazardous & Radiological <strong>material</strong><br />
spills<br />
Continue Participation with <strong>the</strong><br />
Kansas City Regional Terrorism Early<br />
Warning Group (TEW)<br />
L 3 Agricultural Infestation,<br />
Dam and Levee Failure,<br />
Drought, Extreme Heat,<br />
Flood, Soil Erosion and<br />
Dust, Wildfire, Windstorm,<br />
Tornado, Winter Storm<br />
Ongoing/Open<br />
Ended<br />
L 1,2 Flood Ongoing/Open<br />
Ended<br />
H 1 Tornado Ongoing/Open<br />
Ended<br />
M 3 Hazardous Materials &<br />
Radiological Materials<br />
Deleted –<br />
moved to<br />
Reg 1<br />
M 3 Terrorism Deleted –<br />
moved to<br />
Reg 2<br />
Johnson County Emergency<br />
Management & KSU Extension<br />
Office<br />
Johnson County Public Works,<br />
Acting Director<br />
Private Non-Profit Schools, Asst.<br />
Director Planning<br />
Fire Departments<br />
Johnson County and City law<br />
enforcement agencies<br />
Cost: Unknown<br />
Funding: State of Kansas, federal<br />
sources<br />
Completion Date: Open Ended<br />
Cost: Unknown<br />
Funding: State and federal agencies<br />
Completion Date: Open Ended<br />
Cost:<br />
Funding: Private Funds<br />
Completion Date: Open Ended<br />
Cost: Unknown<br />
Funding:<br />
Completion Date:<br />
Cost: Unknown<br />
Funding: Mid-America Regional<br />
Council<br />
4.20
MultiJ 4<br />
MultiJ 5<br />
MultiJ 6<br />
Increase public & fire dept. training<br />
on wildland urban interface fires.<br />
Provide Homeowner Education on<br />
wildfire mitigation in wildland-urban<br />
interface. Before times and<br />
conditions of wildfire danger occur<br />
homeowners living in <strong>the</strong><br />
wildland/urban interface need to<br />
have <strong>the</strong> knowledge to prepare <strong>the</strong>ir<br />
homes and property to be as safe<br />
and defendable as possible.<br />
Educational workshops to be put on<br />
for homeowners associations<br />
and/or in rural communities to<br />
provide homeowners with property<br />
in <strong>the</strong> wildland/urban interface<br />
information on steps that <strong>the</strong>y can<br />
take on <strong>the</strong>ir own to defend <strong>the</strong>ir<br />
property from wildfire. Existing<br />
programs such as <strong>the</strong> FIREWISE<br />
Communities USA program could<br />
be used to supplement local<br />
knowledge and expertise provided<br />
by <strong>the</strong> local fire departments and<br />
<strong>the</strong> Kansas Forest Service in<br />
providing <strong>the</strong> needed information at<br />
<strong>the</strong>se workshop<br />
Reduce hazards fuels in prioritized<br />
wildfire risk areas. Past experience<br />
has shown that <strong>the</strong>re is a threat of<br />
having wildland/urban interface fire<br />
problems in this area. The Wildland<br />
Urban Interface (WUI) is any<br />
location w<strong>here</strong> a fire can spread<br />
from vegetation (wildland fuels) to<br />
man-made (urban fuels). As part of<br />
<strong>the</strong> planning process a wildfire<br />
hazard assessment has been<br />
conducted to begin to identify<br />
those locations that might be in<br />
need of some hazard fuel reduction<br />
work. In those areas that have been<br />
prioritized as posing a threat for<br />
wildland/urban interface fires, fuel<br />
reduction will be used to create fuel<br />
breaks between <strong>the</strong> wildland fuels<br />
L 3 Wildfire Deleted –<br />
moved to<br />
Reg 3<br />
L 1,2 Wildfire Ongoing/Open<br />
Ended<br />
L 1,2 Wildfire Ongoing/Open<br />
Ended<br />
Kansas Forest Service<br />
Kansas Forest Service and Local<br />
Fire Departments Chiefs<br />
Kansas Forest Service and Local<br />
Fire Departments Chiefs<br />
Completion Date:<br />
Cost: $30.00 per student per training<br />
opportunity.<br />
Funding: Kansas Forest Service, State<br />
and federal partners<br />
Completion Date:<br />
Cost: $500 per workshop.<br />
Funding: Kansas Forest service and<br />
federal grants<br />
Completion Date: Open Ended<br />
Cost: $85 a course for hazardous fuel<br />
reduction projects.<br />
Funding: Kansas Forest Service,<br />
federal WUI grant<br />
Completion Date: Open Ended<br />
4.21
and <strong>the</strong> urban environment.<br />
Methods used will be mechanical<br />
removal of fuel, mechanical<br />
thinning of fuel, and/or prescribed<br />
fire.<br />
Action<br />
ID<br />
DeSoto<br />
1<br />
DeSoto<br />
2<br />
DeSoto<br />
3<br />
Johnson County – City of De Soto<br />
Hazard Addressed Status Responsible Entity Estimated cost and Funding Source<br />
Action/Description Priority Goal(s)<br />
Addressed<br />
Flood Control Projects H 1,2 Flood, Soil Erosion & Dust On-going De Soto Engineering<br />
Division<br />
Back-up generators for Fire Station and<br />
<strong>the</strong> EOC<br />
Fire Station Windstorm Damage<br />
Mitigation<br />
H 2 Lightning, Tornado,<br />
Utility/Infrastructure<br />
Failure, Winter Storm<br />
Cost: Unknown<br />
Funding: City and County General<br />
Funds, HMGP Grants and Special<br />
Benefit Districts<br />
Completion Date:<br />
On-going City of De Soto Cost: $55,000,<br />
Funding: city funds, Grants, Bonds,<br />
and CIP<br />
Completion Date:<br />
H 2 Wind Storm On-going City of De Soto Cost: $65,000.<br />
Funding: Budget, Bonds or Mitigation<br />
Grant funds<br />
Completion Date:<br />
Johnson County – City of Edgerton<br />
Action ID Action/Description Priority Goal(s)<br />
Hazard Addressed Status Responsible Entity Estimated Cost and funding Source<br />
Addressed<br />
Edgerton 1 NFIP – continued compliance H 1,2 Flood On-going City of Edgerton Cost: Unknown<br />
Funding: City funds<br />
Completion Date:<br />
Edgerton 2<br />
Edgerton Storm Shelter , currently<br />
this is no shelter<br />
Edgerton 3 Portable Electric Generators M 1,2 Lightning, Tornado,<br />
Utility/Infrastructure<br />
Failure, Winter Storm, Wind<br />
Storm<br />
Edgerton 4<br />
Edgerton Strom Siren System<br />
Expansion<br />
M 1 Tornado On-going City of Edgerton Cost: Unknown<br />
Funding: HMGP<br />
Completion Date:<br />
On-going City of Edgerton Cost: $14,400 - $157,000<br />
Funding: Potential grant<br />
Completion Date:<br />
M 4 Windstorm, Tornado On-going City of Edgerton Cost: $21,000<br />
Funding: City’s capital reserve funds<br />
with matching grant<br />
Completion Date:<br />
Edgerton 5 207 th Street Grade Separation H 1,2 All Hazards On-going City of Edgerton, Johnson<br />
county<br />
Cost: $10 - $15 million<br />
Funding: Federal and State Highway<br />
4.22
Edgerton 6<br />
Edgerton 7<br />
Edgerton Marias des Cygnes<br />
Watershed Storm water<br />
Infrastructure<br />
Dam Infrastructure Repair and<br />
Upgrade at Edgerton and South<br />
Lakes.<br />
Programs, Federal and State Rail<br />
Crossing Programs, and o<strong>the</strong>r<br />
unidentified sources<br />
Completion Date:<br />
L 1,2 Flood On-going City of Edgerton Cost: $679,200.<br />
Funding: Johnson County SMAC,<br />
FEMA programs, and <strong>the</strong> City’s capital<br />
reserve fund<br />
Completion Date:<br />
L 1,2 Dam and Levee Failure,<br />
Flood<br />
On-going City of Edgerton Cost: Unknown<br />
Funding: City’s Capital reserve funds<br />
with match<br />
Completion Date:<br />
Action ID Action/Description Priority Goal(s)<br />
Addressed<br />
Fairway 1 Public Education of City<br />
businesses, home owners, and<br />
residents to be pro-active vs<br />
reactive in surviving and recovering<br />
from disasters.<br />
Fairway 2<br />
Fairway 3<br />
NFIP continued regulatory<br />
compliance<br />
Flood control Projects and Storm<br />
Sewer Upgrades. 42 buildings are<br />
within <strong>the</strong> FEMA 1% floodplain.<br />
O<strong>the</strong>r structures flood due to<br />
drainage issues.<br />
Johnson County – City of Fairway<br />
Hazard Addressed Status Responsible Entity Estimated Cost and funding Source<br />
H 3 All Hazards On-going Police Department Chief Cost: $20,000<br />
Funding: FEMA/State Mitigation<br />
grants. City Fairway would provide<br />
matching cost share<br />
Completion Date:<br />
H 1,2 Flood On-going Codes Department, City of<br />
Fairway Bldg<br />
Inspector/Codes Officer<br />
H 1,2 Flood On-going Fairway 3 Public Works<br />
Director<br />
Cost: Unknown<br />
Funding: City funds<br />
Completion Date:<br />
Cost: Vary<br />
Funding: FEMA mitigation and<br />
repetitive loss grants. JOCO Storm<br />
Water Management Program. CARS,<br />
Federal, State, City funding from<br />
Stormwater Utility Fund. Private<br />
contributions<br />
Completion Date:<br />
Fairway 4<br />
Trailer-mounted, portable<br />
generator for Police Station.<br />
M 2 Lightning, tornado,<br />
utility/infrastructure failure,<br />
winter storm, windstorm<br />
On-going Police Department Chief Cost: $40,000<br />
Funding: Disaster Contingency Funds<br />
with a matching cost share<br />
Completion Date:<br />
4.23
Action ID Action/Description Priority Goal(s)<br />
Addressed<br />
Gardner 1 Storm Watershed Master Plan<br />
Study which identifies stream<br />
buffer policies, detention<br />
requirements, grading plan<br />
requirements, and minimum<br />
development standards for<br />
stormwater. The CIP list identifies<br />
areas of potential flooding and<br />
concerns, recommended<br />
improvements, and a dedicated<br />
funding stream for stormwater is<br />
available.<br />
Gardner 2 Flood control Projects –<br />
Doublegate Culvert Replacement<br />
Project w<strong>here</strong> 11 houses are within<br />
<strong>the</strong> 1% floodplain. Also, 20 houses<br />
that could be affected by <strong>the</strong> same<br />
1% event flooding.<br />
Gardner 3 Generator project due to growth<br />
has resulted in several critical<br />
facilities within <strong>the</strong> community.<br />
Gardner 4<br />
Gardner 5<br />
National Flood Insurance Program<br />
– continued regulatory compliance<br />
Tornado Sirens to service a growth<br />
in <strong>the</strong> Garner population. Also,<br />
upgrades are needed to replace<br />
aged sirens<br />
Johnson County – City of Gardner<br />
Hazard Addressed Status Responsible Entity Estimated Cost and funding Source<br />
H 1,3,4 Flood On-going Public Works, Engineering<br />
Division<br />
H 2 Flood On-going Public Works, Engineering<br />
Division<br />
M 2 Lightning, tornado,<br />
Utility/Infrastructure<br />
Failure, Winter Storm,<br />
windstorm<br />
M 1,2 Flood On-going Public Works, Engineering<br />
Division<br />
Cost: $400,000+<br />
Funding: SMAC, General Fund,<br />
Stormwater Utility fund and property<br />
owner contributions<br />
Completion Date:<br />
Cost: $1.2Million<br />
Funding: FEMA mitigation repetitive<br />
loss grants, SMAC and City funds from<br />
<strong>the</strong> Stormwater Utility fund<br />
Completion Date:<br />
On-going Gardner Public Safety Cost: $50,000 per generator<br />
w/installation<br />
Funding: State and Federal agencies<br />
Completion Date:<br />
Cost: Unknown<br />
Funding:<br />
Completion Date:<br />
M 4 All Hazards On-going Gardner Public Safety Cost: $22,000 per siren<br />
Funding: State and Federal agencies<br />
Completion Date:<br />
Action ID Action/Description Priority Goal(s)<br />
Addressed<br />
LQuivira 1 Emergency Evacuation Exit for<br />
gated residential community that<br />
houses over 400 homes. Located<br />
adjacent to <strong>the</strong> BNSF Mainline<br />
Railway, <strong>the</strong> easement currently<br />
exists for an exit on <strong>the</strong> West side<br />
Johnson County – City of Lake Quivira<br />
Hazard Addressed Status Responsible Entity Estimated Cost and funding Source<br />
H 1 Hazardous Materials On-going Emergency Preparedness,<br />
Fire Chief<br />
Cost: $60,000 for initial construction,<br />
$100,000 with road base update<br />
Funding: City of Lake Quivira<br />
Quivira Inc., FEMA<br />
Completion Date:<br />
4.24
LQuivira 2<br />
of <strong>the</strong> community but was<br />
abandoned in <strong>the</strong> early 1980s.<br />
Should <strong>the</strong>re be a hazardous spill<br />
on <strong>the</strong> BNSF near <strong>the</strong> community it<br />
could potentially block <strong>the</strong> only<br />
evacuation route.<br />
Emergency Power Back-up<br />
Generator for City Hall Facility that<br />
houses <strong>the</strong> Fire, Police, and<br />
administration departments.<br />
Westar Energy’s western<br />
substation increases <strong>the</strong> incidences<br />
of power outages in <strong>the</strong> are.<br />
H 2 Lightning, tornado,<br />
utility/infrastructure failure,<br />
winter storm, windstorm<br />
On-going<br />
City of Lake Quivira Police<br />
Department<br />
Cost: $25,000<br />
Funding: City of Lake Quivira and<br />
FEMA<br />
Completion Date:<br />
Action ID Action/Description Priority Goal(s)<br />
Addressed<br />
Leawood 1 NFIP – continued regulatory<br />
compliance and pursue CRS<br />
membership<br />
Leawood 2<br />
Leawood 3<br />
Natural Resource protection for<br />
flooding along Indian Creek west of<br />
state line road. The drainage<br />
waterway that runs into <strong>the</strong><br />
business park, spills into Indian<br />
Creek from <strong>the</strong> North. This causes<br />
repetitive flooding at a commercial<br />
building park.<br />
Natural Resource Protection of<br />
Tomahawk & Indian Creeks<br />
resulting from flooding over <strong>the</strong><br />
years that has severely eroded this<br />
area. Areas adjacent to <strong>the</strong> creeks,<br />
including parks, trails, and natural<br />
habitats continue to be impacted.<br />
Johnson County – City of Leawood<br />
Hazard Addressed Status Responsible Entity Estimated Cost, funding Source, and<br />
completion date<br />
Director of Public Works Cost: Unknown<br />
Funding: City of Leawood funding,<br />
Completion Date: open ended.<br />
H 1,2 Flood Ongoing/open<br />
ended<br />
H 1,2 Flood, soil Erosion and Dust On-going Director of Public Works Cost: Unknown<br />
Funding: Annual Budget<br />
Completion Date: Feasibility study<br />
completion would be 1 – 12 months<br />
after funding, and construction would<br />
be 12 – 36 months after that.<br />
H 1,2 Flood, Soil Erosion and Dust On-going Director of Public Works Cost: $1,000,000<br />
Funding: Annual budget<br />
Completion Date: Up to 12 months<br />
for feasibility study and 12 – 36<br />
months for construction after funding<br />
received.<br />
4.25
Leawood 4<br />
Leawood 5<br />
Leawood 6<br />
Emergency Services – Protection<br />
of Utilities at a Critical Facility<br />
with a new Generator. Fire<br />
Station #1 frequently loses<br />
electricity during sever wea<strong>the</strong>r<br />
due to an aged generator. This<br />
generator does not provide<br />
electricity to <strong>the</strong> entire building<br />
and all essential components<br />
ei<strong>the</strong>r.<br />
Installation of additional warning<br />
system sirens and computer<br />
monitoring system for two areas<br />
that lack adequate coverage from<br />
existing warning sirens.<br />
Emergency Services – warning<br />
systems: wea<strong>the</strong>r radios to<br />
enhance <strong>the</strong> warning of <strong>the</strong> public<br />
and businesses.<br />
H 4 Lightning, tornado,<br />
utility/infrastructure<br />
failure, winter storm,<br />
winter storm<br />
Completed<br />
Leawood Fire Department<br />
#1<br />
Cost: $50,000<br />
Funding: Annual budget<br />
Completion Date: Completed<br />
H 4 Tornado, windstorm Completed Leawood Fire Department Cost: $134,000<br />
Funding: Annual Budget<br />
Completion Date: Completed<br />
H 2 Tornado, Windstorm,<br />
Winter storm, Lightning<br />
On-going Leawood Fire Chief Cost: $315,000<br />
Funding: Annual Budget<br />
Completion Date: 2010<br />
Action ID Action/Description Priority Goal(s)<br />
Addressed<br />
Lenexa 1 Continue NFIP Participation H 1,2 Flood Ongoing/open<br />
ended<br />
Lenexa 2<br />
Lenexa 3<br />
Construction of Public Safe Rooms.<br />
Currently <strong>the</strong>re are none. The<br />
large outdoor festivals have no<br />
shelter areas.<br />
Back-up generators for critical<br />
facilities, Fire Station #2 has no<br />
emergency power generator<br />
Johnson County – City of Lenexa<br />
Hazard Addressed Status Responsible Entity Estimated Cost and funding Source<br />
City of Lenexa Public Works<br />
Cost: N/A<br />
Funding: N/A<br />
Completion Date: Open ended<br />
H 1 Tornado On-going City of Lenexa Public Works Cost: Unknown<br />
Funding: City funding, Federal as<br />
identified<br />
Completion Date: open<br />
H 2 Lightning, tornado,<br />
utility/infrastructure failure,<br />
winter storm, windstorm<br />
On-going<br />
City of Lenexa Fire<br />
Department<br />
Cost: $60,000<br />
Funding: City of Lenexa, State and<br />
Federal Funds<br />
Completion Date: Unknown<br />
4.26
Action ID Action/Description Priority Goal(s)<br />
Addressed<br />
Merriam 1 NFIP and continued compliance H 1,2 Flood Ongoing/Open<br />
Ended<br />
Johnson County – City of Merriam<br />
Hazard Addressed Status Responsible Entity Estimated Cost and funding Source<br />
Director of Community<br />
Development<br />
Cost: Unknown<br />
Funding: City Funds<br />
Completions Date: is open ended<br />
Action ID Action/Description Priority Goal(s)<br />
Addressed<br />
Mission 1 NFIP: continued compliance H 1,2 Flood Ongoing/Open<br />
Ended<br />
Mission 2<br />
Mission 3<br />
Sylvester Powell Jr. Community<br />
Center Disaster Preparedness<br />
Project<br />
Additional Generator for Public<br />
Works Facility<br />
Johnson County – City of Mission<br />
Hazard Addressed Status Responsible Entity Estimated Cost and funding Source<br />
City of Mission<br />
Cost: Unknown<br />
Funding: City funds<br />
Completion Date: is open ended<br />
M 1 All Hazards On –going Emergency Preparedness Cost: Unknown<br />
Funding: City, county and FEMA<br />
funding<br />
Completion Date: unknown<br />
L 2 Lightning, tornado,<br />
utility/infrastructure failure,<br />
winter storm, windstorm<br />
On-going Emergency Preparedness Cost: Unknown<br />
Funding: Mission General<br />
Fund/Federal Funds<br />
Completion Date: Open<br />
Action ID Action/Description Priority Goal(s)<br />
Addressed<br />
MHills 1 NFIP – continued compliance H 1,2 Flood Ongoing/Open<br />
Ended<br />
MHills 2<br />
MHills 3<br />
Mission Drive Channel that runs<br />
from State Line Road to 63 rd street<br />
abuts property that is in <strong>the</strong><br />
floodplain (including a church and<br />
<strong>the</strong> City Hall). The flooding also<br />
affects two bridges and three<br />
public roads.<br />
Flood Warning System – Phases II<br />
and III would hire a firm to forecast<br />
Johnson County – City of Mission Hills<br />
Hazard Addressed Status Responsible Entity Estimated Cost and funding Source<br />
City Administrator<br />
Cost: $1 - $3 Million<br />
Funding: City Funds<br />
Completion Date: education is<br />
continuous, Acquiring Structures – as<br />
opportunities arise<br />
H 1,2 Flood Completed City Administrator Cost: $2,600,000<br />
Funding: City Funds and Johnson<br />
county Stormwater Management<br />
Advisory council<br />
Completion Date: Completed<br />
M 4 Flood On-going City Administrator Cost: $1,400,000<br />
Funding: City Funds, Johnson County<br />
4.27
MHills 4<br />
MHills 5<br />
flood events and <strong>the</strong>n use <strong>the</strong><br />
City’s Code Red (reverse 911) to<br />
notify those that would be likely to<br />
be affected so <strong>the</strong>y can take<br />
precautions/evacuate <strong>the</strong> area.<br />
Phase III would install automatic<br />
bollards that come out of <strong>the</strong><br />
roadway to block traffic when <strong>the</strong><br />
creek sensors indicate that <strong>the</strong><br />
roadway will be overtopped with<br />
water.<br />
Realign Brush Creek in Hiawassee<br />
park. Wenonga Road that abuts<br />
Hiawassee Park historically<br />
overtops when significant rain<br />
events happen.<br />
Peetwood Park Improvements.<br />
Indian lane abuts this park and<br />
historically <strong>the</strong> roadway is<br />
overtopped with water when<br />
<strong>the</strong>re is a significant rain event.<br />
Stormwater Management Advisory<br />
Council<br />
Completion Date:<br />
Phase II – within 5 years<br />
Phase III- within 10 years.<br />
M 1,2 Flood On-going City Administrator Cost: $138,600<br />
Funding: City Funds<br />
Completions Date: 2017<br />
H 1,2 Flood Completed City Administrator Cost: $1,026,000<br />
Funding: Stream Channel Project –<br />
State of Kansas, Johnson County<br />
SMAC, Bridge Project<br />
Completion Date: Completed<br />
Johnson County – City of Mission Woods<br />
Action ID Action/Description Priority Goal(s)<br />
Hazard Addressed Status Responsible Entity Estimated Cost and funding Source<br />
Addressed<br />
MWoods 1 Re-join NFIP. M 1,2 Flood Ongoing/Open<br />
Ended<br />
City of Mission Woods Cost: Unknown<br />
Funding: NA<br />
Completion Date: never ending.<br />
Action ID Action/Description Priority Goal(s)<br />
Addressed<br />
Ola<strong>the</strong> 1 Cedar Creek Wastewater<br />
Treatment Plan Flood Wall. The<br />
Cedar Creek Wastewater<br />
Treatment Plan (CCWWTP) has<br />
been flooded several<br />
times. The operating permit for<br />
<strong>the</strong> plant requires flood<br />
protection to withstand 500 year<br />
Johnson County – City of Ola<strong>the</strong><br />
Hazard Addressed Status Responsible Entity Estimated Cost and funding Source<br />
H 2 Flood On-going Wastewater<br />
Superintendent<br />
Cost: $1,000,000<br />
Funding: Revenue bonds, grants<br />
Completion Date: 2010-2011<br />
4.28
Ola<strong>the</strong> 2<br />
Ola<strong>the</strong> 3<br />
Ola<strong>the</strong> 4<br />
Ola<strong>the</strong> 5<br />
flood events. Twice in <strong>the</strong> past<br />
10 years OMS has received<br />
grants for flood protection at<br />
<strong>the</strong> plant. However, every time<br />
<strong>the</strong>re is a new flood plain study<br />
<strong>the</strong> height of a 500 year<br />
flood event has ratcheted<br />
upward. Once again, <strong>the</strong> latest<br />
study indicates that CCWWTP<br />
needs higher flood protection<br />
walls.<br />
Flood Home Buy-out for up to five<br />
structures. The targeted, single<br />
family structures are identified in<br />
<strong>the</strong> updated flood plain maps.<br />
Repetitive losses have occurred<br />
in <strong>the</strong> past.<br />
Future updates to <strong>the</strong> flood<br />
maps have <strong>the</strong> potential to buyout<br />
homes within <strong>the</strong> Ola<strong>the</strong><br />
City Limits.<br />
Safe room in future public building.<br />
Future public buildings in <strong>the</strong><br />
City of Ola<strong>the</strong> may be required<br />
to provide a safe room for<br />
<strong>the</strong> building occupants.<br />
This worksheet provides <strong>the</strong><br />
need for potential requests of<br />
this nature.<br />
Trailer-mounted, portable<br />
generator. An electrical power<br />
outage to a fire station, <strong>the</strong> DOC<br />
or EOC would reduce our ability<br />
to<br />
Provide public safety and<br />
Emergency Management<br />
services to <strong>the</strong> public.<br />
This plan and equipment will<br />
provide a redundant back-up to<br />
our electrical service.<br />
CERT training program. The goal<br />
of <strong>the</strong> Ola<strong>the</strong>, KS CERT<br />
program is to train 10% of <strong>the</strong><br />
city population.<br />
As of 2008, 1,100 participants<br />
have been certified as CERT<br />
responders.<br />
H 1 Flood On-going Stormwater Director Cost: $750,000 total for 5 structures<br />
Funding: Stormwater Management<br />
Advisory Council, (SMAC) funding.<br />
Completion Date: to be announced<br />
M 1 Tornado, windstorm On-going Chief Building Official,<br />
Ola<strong>the</strong>, KS<br />
M 2 Lightning, tornado,<br />
utility/infrastructure failure,<br />
winter storm, windstorm<br />
On-going<br />
Ola<strong>the</strong> Fire Department,<br />
Assistant Chief, Special<br />
Operations<br />
H 3,4 All Hazards On-going Assistant Chief, Special<br />
Operations<br />
Ola<strong>the</strong> 6 Storm drainage culvert expansion H 1,2 Flood On-going Ola<strong>the</strong> Storm Water Cost: $200,000<br />
Cost: Unknown<br />
Funding: Municipal Finances, Bonds<br />
and potential grant sources<br />
Completion Date: To be announced<br />
Cost: Unknown<br />
Funding: Cost-share line item from<br />
disaster contingency funds<br />
Completion Date: To be announced<br />
Cost: $22,000<br />
Funding: Budget, Citizen Corps, and<br />
UASI grant<br />
Completion Date: Jan and November<br />
of each year.<br />
4.29
Ola<strong>the</strong> 7<br />
Ola<strong>the</strong> 8<br />
Ola<strong>the</strong> 9<br />
at 147/Brougham Dr. The existing<br />
culvert has been determined to<br />
be under-sized according to <strong>the</strong><br />
undated<br />
flood maps of 2008. Previous<br />
improvements to <strong>the</strong> downstream<br />
areas are now capable<br />
of <strong>the</strong> flow of <strong>the</strong> stream.<br />
Increase <strong>the</strong> reinforced concrete<br />
culvert under Brougham Dr. at<br />
147 Street by 100% to<br />
reduce <strong>the</strong> current flow<br />
restriction.<br />
All-Hazard Citizen Education<br />
Preparing citizens for <strong>the</strong>ir role in<br />
all-hazard preparedness is<br />
paramount to <strong>the</strong> City’s<br />
capability to respond to and<br />
recover from <strong>the</strong> hazards we<br />
face. Educating Ola<strong>the</strong> citizens<br />
about firework safety,<br />
regulations, and alternative<br />
activities/events is ano<strong>the</strong>r<br />
safety issue we face each year.<br />
Workbook. These are used in<br />
Community Emergency<br />
Response Team (CERT)<br />
training as well as distributed to<br />
groups, neighbourhood<br />
associations, and <strong>the</strong> public in<br />
general.<br />
Help continue to produce<br />
mailers for <strong>the</strong> July 4th safety<br />
campaign as<br />
well as do firework safety<br />
demonstrations.<br />
Expansion of Ola<strong>the</strong> Outdoor<br />
Warning System. The City of<br />
Ola<strong>the</strong> continues to grow not only<br />
in land mass, but in population.<br />
The City currently has 34 sirens<br />
for our Outdoor Warning System.<br />
We have at least six annexation<br />
areas that still need to be covered.<br />
We, however, have no budget at<br />
least in 2008 and at least 2009 to<br />
put up any more sirens.<br />
Upgrade computers for <strong>the</strong> Ola<strong>the</strong><br />
EOC & DOC. The City of Ola<strong>the</strong><br />
Planning Division Chief<br />
H 3 All Hazards On-going Ola<strong>the</strong> Fire Department,<br />
Assistant Chief of Special<br />
Ops<br />
H 4 Tornado, wind storm On-going Ola<strong>the</strong> fire<br />
Department/Emergency<br />
Management Division –<br />
Chief Dock<br />
H 4 All Hazards On-going City of Ola<strong>the</strong> I.T.<br />
Department director<br />
Funding: Johnson county Storm<br />
Water Management Advisory Council<br />
Completion Date: To be announced.<br />
Cost: $21,140 for 10,000 workbooks<br />
Funding: Emergency Management<br />
Divisions printing line item,<br />
Administration division’s budget.<br />
Completion Date: Ola<strong>the</strong> FY 2009 –<br />
Jan – Dec.<br />
Cost: $138,000 for six sirens<br />
Funding: Grant, budget, developer<br />
contribution<br />
Completion Date: Action will be<br />
addressed if need be, 1 siren at a time<br />
until all six are complete.<br />
Cost: $7,000<br />
Funding: Kansas State Mitigation<br />
4.30
Ola<strong>the</strong> 10<br />
Ola<strong>the</strong> 11<br />
houses a free standing facility for<br />
<strong>the</strong> traffic operations center,<br />
(TOC). The City Emergency<br />
Operations Plan designates <strong>the</strong><br />
Fire Department Operations<br />
Center as <strong>the</strong> alternate site for <strong>the</strong><br />
TOC.The program is also utilized<br />
in <strong>the</strong> City Emergency Operations<br />
Center as an observation tool for<br />
all events. The computer<br />
programs that support and<br />
operate <strong>the</strong> video capability in <strong>the</strong><br />
traffic system exceed <strong>the</strong> current<br />
capability of <strong>the</strong> main computers<br />
in <strong>the</strong> DOC and <strong>the</strong> EOC.<br />
Water Plant 2 chlorine gas retrofit.<br />
Water Plant 2 uses chlorine gas to<br />
treat our potable water supply.<br />
The gas is stored in cylinders (with<br />
a capacity of a ton) and is a<br />
potential danger to <strong>the</strong><br />
surrounding area should it rupture.<br />
OMS would need to evacuate<br />
approximately 600 people in <strong>the</strong><br />
event of a cylinder rupture.<br />
Ano<strong>the</strong>r means to treat <strong>the</strong> water<br />
exists in sodium hypochlorite,<br />
but Plant 2 feed equipment would<br />
need to be retrofitted to enable<br />
use of this chemical<br />
New construction of free standing<br />
safe rooms at Santa Barbara<br />
Mobile Home Estates. The Home<br />
Town Santa Barbara sub-division<br />
is a mobile home park with a total<br />
land area of 82.57 acres. The total<br />
number of housing units on <strong>the</strong><br />
site is 487 with 100% of <strong>the</strong> units<br />
built at grade. The average<br />
census/populating in <strong>the</strong> complex<br />
is 1600 people. The original<br />
construction date is 1972 and<br />
offers no protection from highwind<br />
and tornado events.<br />
This mobile home complex has no<br />
existing structures on <strong>the</strong> property<br />
for residents to seek shelter and<br />
safety from tornado or high wind<br />
events.<br />
H 2 Hazardous Materials On-going Environmental Services<br />
Manager<br />
Grant, City of Ola<strong>the</strong> Line Item Budget<br />
Completion Date: As soon as<br />
possible<br />
Cost: $250,000<br />
Funding: Bonds, Grants<br />
Completion Date: 2010-2011<br />
H 1 Tornado, Windstorm On-going Assistant Chief, OFD Cost: $800,000.<br />
Funding: KS State Mitigation Grand<br />
Funds Only<br />
Completion Date: 2010<br />
Ola<strong>the</strong> 12 Continue NFIP participation. H 1,2 Flood Ongoing/Open<br />
City of Ola<strong>the</strong>, Rob Beilfus<br />
Cost: Unknown<br />
Funding: City funds if needed<br />
4.31
Ended<br />
Completion Date: open ended<br />
Johnson County – City of Overland Park<br />
Action ID Action/Description Priority Goal(s)<br />
Hazard Addressed Status Responsible Entity Estimated Cost and funding Source<br />
Addressed<br />
OVP 1 City Hall Emergency Generator<br />
Project. The KC Metro area is<br />
vulnerable to several potentially<br />
catastrophic wea<strong>the</strong>r events such<br />
as tornadoes, winter storms,<br />
damaging winds, etc. During many<br />
of <strong>the</strong>se types of wea<strong>the</strong>r events,<br />
power can be disrupted at a center<br />
to facilitate specific operations<br />
associated with emergency<br />
response and mitigation activities.<br />
Currently OP does not have <strong>the</strong><br />
capability of supporting critical<br />
functions/operations if power<br />
were lost to <strong>the</strong> building.<br />
Currently, <strong>the</strong> only emergency<br />
back-up systems available is to<br />
accommodate building evacuation<br />
in case of fire such as emergency<br />
lighting and alarm systems.<br />
Building systems to support<br />
occupancy during emergency<br />
operations such as environmental<br />
(HVAC), communications, security<br />
systems, currently have no<br />
emergency back-up power<br />
systems. City Hall would be<br />
provided with an emergency<br />
generator system, designed and<br />
installed with <strong>the</strong> appropriate<br />
capacity, in order to support<br />
essential building systems to<br />
accommodate occupancy of <strong>the</strong><br />
building functions. The system<br />
would be provided with a fuel<br />
H 2 Tornadoes, Wind Storms,<br />
Winter Storms<br />
New Manager; Facilities<br />
Management and Code<br />
Administrator; Building<br />
Safety Division<br />
Cost: $250,000<br />
Funding: Unknown<br />
Completion Date: 6 months after<br />
funding received.<br />
4.32
OVP 2<br />
OVP 3<br />
reservoir capable of 48 – 72 hours<br />
of operating time.<br />
Tomahawk Ridge Community<br />
Center Emergency Generator<br />
Project. The KC Metro area is<br />
vulnerable to several potentially<br />
catastrophic wea<strong>the</strong>r events such<br />
as tornadoes, winter storms,<br />
damaging winds, etc. During many<br />
of <strong>the</strong>se types of wea<strong>the</strong>r events,<br />
power can be disrupted at a center<br />
to facilitate specific operations<br />
associated with emergency<br />
response and mitigation activities.<br />
Currently OP does not have <strong>the</strong><br />
capability of supporting critical<br />
functions/operations if power<br />
were lost to <strong>the</strong> building.<br />
Currently, <strong>the</strong> only emergency<br />
back-up systems available is to<br />
accommodate building evacuation<br />
in case of fire such as emergency<br />
lighting and alarm systems.<br />
Building systems to support<br />
occupancy during emergency<br />
operations such as environmental<br />
(HVAC), communications, security,<br />
systems, currently have no<br />
emergency back-up power<br />
systems. Tomahawk Community<br />
Center would be provided with an<br />
emergency generator system,<br />
designed and installed with <strong>the</strong><br />
appropriate capacity, in order to<br />
support essential building systems<br />
to accommodate occupancy of <strong>the</strong><br />
building. The system would be<br />
provided with a fuel reservoir<br />
capable of 48 – 72 hours of<br />
operating time.<br />
Fire Station Safe Room. The KC<br />
Metro area is vulnerable to<br />
tornadoes and severe storms that<br />
produce damaging wind<br />
conditions. It is critical that we<br />
protect our public safety personnel<br />
H 2 Tornadoes, Wind Storms,<br />
Winter Storms<br />
New<br />
H 2 Tornado, Wind Storm New –<br />
replaces OP<br />
6<br />
Director Recreation Services<br />
Department and Manager,<br />
Facilities Management<br />
Cost: $350,000<br />
Funding: Unknown<br />
Completion Date: 6 months after<br />
authorization of funds.<br />
Fire Chief, Fire Department Cost: $150,000<br />
Funding: Unknown<br />
Completion Date: Unknown<br />
4.33
OVP 4<br />
OVP 5<br />
OVP 6<br />
and equipment in order for <strong>the</strong>m<br />
to respond to emergencies,<br />
particularly during disaster events.<br />
Fire station number three does not<br />
have a basement or safe refuge<br />
area for personnel during a fast<br />
moving severe storm. FS #3 would<br />
be retrofitted with a safe room<br />
capable of protecting up to 50<br />
people. The room would be<br />
capable of protecting <strong>the</strong> on-duty<br />
crew as well as up to 45 additional<br />
people.<br />
Fire Department Generator<br />
Project. During hazard events<br />
power is disrupted at critical<br />
facilities. Fire station number five<br />
does not currently have a<br />
generator capable of providing<br />
back up power for critical<br />
functions. FS #5 would have a<br />
generator installed that would be<br />
capable of providing power to all<br />
critical functions within <strong>the</strong><br />
building. The generator would<br />
have a fuel reservoir capable of 48-<br />
72 hours of operating time.<br />
NFIP – Program has been<br />
implemented and requires<br />
regulation of all construction<br />
within <strong>the</strong> FEMA regulated<br />
floodplain<br />
Fire Station Windstorm Damage<br />
Mitigation. Retrofit four of <strong>the</strong> five<br />
fire stations in Overland Park with<br />
wind resistant/energy efficient<br />
doors. All large surface area<br />
windows would be fitted with<br />
storm panels or shutters. Fire<br />
station number five is scheduled<br />
for replacement in <strong>the</strong> near future,<br />
and would include iwnd resistant<br />
doors as part of <strong>the</strong> design<br />
specifications. The weakest points<br />
of <strong>the</strong> structures are apparatus bay<br />
doors and large surface area<br />
H 2 Lightning, tornado,<br />
utility/infrastructure failure,<br />
winter storm, windstorm<br />
New,<br />
replaces OP<br />
7<br />
M 1,2 Flood New,<br />
replaces OP<br />
1<br />
M 2 Tornado, Windstorm New,<br />
replaces OP<br />
9<br />
Fire Chief, fire Department Cost: $75,000<br />
Funding: Unknown<br />
Completion Date: Unknown<br />
Code Administrator, and<br />
Flood plain Administrator<br />
Fire Chief, Overland park<br />
Fire Department<br />
Cost: NA<br />
Funding: NA<br />
Completion Date: Open ended<br />
Cost: $400,000<br />
Funding: Unknown<br />
Completion Date: Unknown<br />
4.34
OVP 7<br />
OVP 8<br />
OVP 9<br />
windows.<br />
Evaluation of critical city facilities<br />
for compliance with FEMA 361<br />
(Design, and Construction<br />
Guidance for Community Shelters)<br />
along with nationally recognized<br />
design and construction standards<br />
for storm shelters, safe rooms and<br />
<strong>the</strong>ir ability for use as a postdisaster<br />
shelter. OP has listed<br />
several critical facilities on our<br />
emergency operations plans which<br />
need to be evaluated per<br />
contemporary standards for use<br />
and compliance as community<br />
shelters, storm shelters and safe<br />
rooms. Once evaluation is<br />
completed, upgrade facilities as<br />
needed.<br />
Electronic Plan Review and<br />
Recording. Building code<br />
enforcement is recognized as one<br />
of <strong>the</strong> most effective tools to<br />
provide for mitigation of damage<br />
to our vertical built environment.<br />
Technology related to building<br />
code enforcement is rapidly<br />
changing particularly as <strong>the</strong> design<br />
professionals continue to move<br />
toward <strong>the</strong> use of business<br />
information modeling (BIM). OP<br />
has initiated research activities<br />
related to electronic plan <strong>review</strong><br />
hardware and software. Going<br />
forward a task force consisting of<br />
City Staff, designers, contractors,<br />
and o<strong>the</strong>r interested parties would<br />
be assembled to develop a<br />
program, research specific needs,<br />
and interview software companies.<br />
Public education of city businesses,<br />
home owners and residents and all<br />
city staff in OP for disaster<br />
preparedness, mitigation and<br />
recovery. Train citizens and<br />
businesses in moving away from<br />
M 2 Tornado, Windstorm New,<br />
replaces OP<br />
5<br />
M 4 All Hazards New,<br />
replaces OP<br />
8<br />
M 4 All Hazards New,<br />
replaces OP<br />
3<br />
Public Works Department<br />
City Engineer, and Manager,<br />
Facilities Management, and<br />
Code Administrator,<br />
Building Safety Division<br />
Code Administrator,<br />
Building Safety Division<br />
City Emergency<br />
Management Coordinator<br />
Cost: $5,000,000<br />
Funding: Unknown<br />
Completions Date: 5 years<br />
Cost: $400,000<br />
Funding: Unknown<br />
Completion Date: One year after<br />
funding authorized.<br />
Cost: $100,000<br />
Funding: Unknown<br />
Completion Date: Approximately<br />
one year after funding is authorized.<br />
4.35
OVP 10<br />
reactionary to pro-active<br />
preparedness in surviving and<br />
recovering from disasters.<br />
Educating <strong>the</strong> public on measures<br />
to secure/reinforce homes and<br />
businesses before a disaster occurs<br />
to minimize damages, loss of life<br />
and enable a quick economic<br />
stability rebound.<br />
Flood Control projects and storm<br />
sewer upgrades. T<strong>here</strong> are<br />
estimated to be over 500 habitable<br />
buildings within <strong>the</strong> city that are<br />
within <strong>the</strong> FEMA 100 – year<br />
floodplain. T<strong>here</strong> are an unknown<br />
number of additional structures<br />
that may flood due to localized<br />
conditions on smaller creeks and<br />
drainages. It is often feasible to<br />
improve storm drainage systems<br />
serving those areas. The city’s<br />
policy for considering flood control<br />
enhancements are set forth in<br />
Resolution No. 3900. Projects are<br />
prioritized based on engineering<br />
and economic feasibility; severity<br />
of flooding; availability of city<br />
funds to pursue <strong>the</strong> project; and<br />
degree of interest in <strong>the</strong> project by<br />
property owners as manifested by<br />
<strong>the</strong> donation to <strong>the</strong> city of<br />
easements necessary to construct<br />
<strong>the</strong> project. Projects are managed<br />
in-house, but typically designed by<br />
a consulting engineer and<br />
contracted through competitive<br />
bid. We pursue cost sharing<br />
opportunities with Johnson County<br />
SMAC. Projects are designed to<br />
protect buildings up to <strong>the</strong> 100<br />
year storm, ei<strong>the</strong>r through open<br />
channels and flood plain<br />
modifications or through a<br />
combination of below ground<br />
storm sewers and above ground<br />
swales.<br />
M 1,2 Flood New,<br />
replaces OP<br />
4<br />
Director, Public Works,<br />
Floodplain Manager,<br />
Engineering Division<br />
Cost: Unknown<br />
Funding: Stormwater Utility Fund,<br />
JOCO Stormwater Management<br />
Program, FEMA mitigation and<br />
repetitive loss grants. Property<br />
owner contributions are often<br />
required via benefit districts.<br />
Completion Date: 2 – 4 years from<br />
initial identification to project<br />
completion.<br />
4.36
OVP 11<br />
OVP 12<br />
Acquisition of structures with<br />
Repetitive flood losses.<br />
Regional Storm water detention<br />
for downtown OP. OP is actively<br />
promoting redevelopment of its<br />
downtown area as part of <strong>the</strong><br />
Vision Metcalf Plan. The city<br />
adopted a form based code that<br />
may result in more intense urban<br />
uses within <strong>the</strong> downtown area.<br />
Downtown OP falls on a ridge line<br />
and drains into three watersheds<br />
to include Brush Creek to <strong>the</strong> east,<br />
Turkey Creek to <strong>the</strong> west, and<br />
Indian Creek to <strong>the</strong> south. Flood<br />
studies of <strong>the</strong>se three watersheds<br />
had identified a substantial<br />
number of homes and businesses<br />
in flood prone areas in each of<br />
<strong>the</strong>se watersheds and in<br />
downtown OP. Currently, storm<br />
water detention facilities are<br />
required to be constructed with<br />
development and redevelopment<br />
projects that significantly increase<br />
impervious land cover when <strong>the</strong>re<br />
are identified downstream flooding<br />
problems. Construction of regional<br />
storm water detention facilities to<br />
control and/or reduce runoff<br />
generated by redevelopment of<br />
<strong>the</strong> downstream area.<br />
M 1,2 Flood New,<br />
replaces OP<br />
2<br />
Director, Public Works and<br />
Floodplain Manager,<br />
Engineering Division<br />
M 1,2 Flood New Director, Public Works<br />
Department and Manager,<br />
Engineering Services<br />
OP 1 Continue NFIP Participation H 1,2 Flood Deleted.<br />
Replaced<br />
by OVP 5<br />
OP 2<br />
OP 3<br />
Acquisition of structures with<br />
repetitive flood losses<br />
Public Education for City<br />
Businesses, Home owners,<br />
Residents, & all City Staff in OP for<br />
disaster preparedness, mitigation,<br />
& recovery<br />
H 2 Flood Deleted,<br />
replaced by<br />
OVP 11<br />
H 3 All Hazards Deleted,<br />
replaced by<br />
OVP 9<br />
OP-4 Flood control Projects and Storm H 1,2 Flood Deleted,<br />
Cost: Varies depending on home<br />
Funding: Unknown<br />
Completion Date: 6 months – 2<br />
years from date of approval.<br />
Cost: Undetermined<br />
Funding: Unknown<br />
Completion Date: Undetermined<br />
4.37
Sewer Upgrades<br />
replaced by<br />
OVP 10<br />
OP 5<br />
Evaluation of Critical City Facilities<br />
for compliance with FEMA 361<br />
H 2 Tornado/Wind Storm Deleted,<br />
replaced by<br />
OVP 7<br />
OP 6 Fire Station Safe room. H 2 Tornado, Wind Storm Deleted,<br />
replaced by<br />
OVP3<br />
OP 7 Generator Project H 2 Lightning, tornado,<br />
utility/infrastructure failure,<br />
winter storm, windstorm<br />
OP 8<br />
OP 9<br />
Electronic Plan Review and<br />
Recording<br />
Fire Station Windstorm Damage<br />
Mitigation<br />
Deleted,<br />
replaced by<br />
OVP 4<br />
H 4 All Hazards Deleted,<br />
replaced by<br />
OVP 8<br />
H 2 Windstorm Deleted,<br />
Replaced<br />
by QVP 6<br />
Fire Department<br />
Johnson County – City of Prairie Village<br />
Action ID Action/Description Priority Goal(s)<br />
Hazard Addressed Status Responsible Entity Estimated Cost and funding Source<br />
Addressed<br />
PV 1 Bury underground utility cables M 1,2 Lightning, Tornado,<br />
Utilitiy/Infrastructure<br />
Failure, Winter Storm,<br />
On-going Director of Public Works Cost: Unknown<br />
Funding: NA<br />
Completion Date: never ending.<br />
Windstorm<br />
PV 2 National Flood Insurance Program H 1,2 Flood Ongoing/Open<br />
ended<br />
Assistant City Administrator<br />
Johnson County – City of Roeland Park<br />
Action ID Action/Description Priority Goal(s)<br />
Hazard Addressed Status Responsible Entity Estimated Cost and funding Source<br />
Addressed<br />
Roeland Pk 1 Back-up generators for City<br />
Hall/Police Department and City<br />
community Center. The critical<br />
H 2 Lightning, tornado,<br />
utility/8infrastructure<br />
failure, winter storm,<br />
On-going Roeland Park Police<br />
Department<br />
Cost: $80,000<br />
Funding: New construction Bonds<br />
Completion Date: Within 4 years<br />
facilities, city Hall/police<br />
Department & City Community<br />
Center do not have back-up power<br />
during emergencies. Both facilities<br />
are used for emergency response.<br />
windstorm<br />
Roeland Pk 2 National Flood Insurance program.<br />
The City would like to continue to<br />
H 1,2 Flood On- City of Roeland Park Cost: Unknown<br />
4.38
Roeland Pk 3<br />
be compliant with <strong>the</strong> NFIP.ram.<br />
Habitable building buyout.<br />
Habitable buildings are located in<br />
<strong>the</strong> floodplain and/or are subject to<br />
flooding. Identify habitable<br />
buildings in <strong>the</strong> floodplain and/or<br />
are subject to flooding, prioritize<br />
locations, and purchase buildings<br />
as funding becomes available.<br />
going/Open<br />
Ended<br />
Funding: City funds<br />
Completion Date: Open ended<br />
M 1 Flood On-going Roeland park Public Works Cost: Unknown<br />
Funding: JOCO Stormwater<br />
Management<br />
Completion Date: Ongoing<br />
Action ID Action/Description Priority Goal(s)<br />
Addressed<br />
SH4<br />
Establish a full time Emergency<br />
Management Office. Shawnee<br />
has never had a dedicated EM or<br />
EM office. Plans, such as EOP,<br />
COOP, etc., have suffered. Same<br />
with outreach to community. An<br />
acting EM position has been<br />
established to update plans, form<br />
a CERT, attend county and<br />
regional planning meetings and<br />
work on projects.<br />
SH3<br />
Shawnee 3<br />
Form CERT Training Program.<br />
Train citizens in disaster<br />
preparedness and response.<br />
Have a Force Multiplier of trained<br />
volunteers for disaster.<br />
Inclusion of tornado safe rooms in<br />
all future buildings built by <strong>the</strong><br />
City. Kansas was <strong>the</strong> highest<br />
rated state for tornadoes in 2008<br />
at 168. In addition, <strong>the</strong> area is<br />
often battered by high wind events<br />
that cause extensive damage. The<br />
City has <strong>the</strong> ability to <strong>review</strong> <strong>the</strong><br />
concept of adding a tornado<br />
Johnson County – City of Shawnee<br />
Hazard Addressed Status Responsible Entity Estimated Cost and funding Source<br />
H 1,2 All Hazards New City Manager Cost: $100,000 per year<br />
Funds: General Fund<br />
Completion Date: Awaiting approval<br />
of City Council, Summer 2013<br />
M 3 All Hazards New Acting Emergency Manager Cost: $1000 start-up<br />
Funds: State & Federal Grants,<br />
Donations<br />
Completion Date: Fall 2013<br />
H 1 Tornado, Windstorm On-going,<br />
Open<br />
Ended<br />
Public Works Director<br />
Cost: Unknown<br />
Funds: County, Federal<br />
Completion Date: Continuous<br />
4.39
SH2<br />
SH1<br />
Shawnee 5<br />
Shawnee 1<br />
Shawnee 2<br />
refuge built to FEMA standards in<br />
all new construction because of<br />
this issue. The City of Shawnee<br />
will <strong>review</strong> all future building plans<br />
and <strong>review</strong> <strong>the</strong> ability to add a<br />
safe room for citizens and<br />
employees in buildings such as<br />
libraries, public safety buildings,<br />
general use buildings and o<strong>the</strong>r<br />
buildings as appropriate. Federal<br />
funding to assist with <strong>the</strong> building<br />
of <strong>the</strong> safe room may be sought.<br />
Public Education for<br />
city/community in Disaster<br />
Preparedness. No community<br />
outreach at this time. Establish an<br />
EM position first, <strong>the</strong>n CERT, <strong>the</strong>n<br />
try to take education out to<br />
community at large.<br />
No storm shelters or basement<br />
built into <strong>the</strong> new Justice Center.<br />
Facility sits on a hill on I435<br />
corridor. High potential for wind<br />
and/or tornado damage. Free<br />
standing storm shelter or<br />
underground, behind <strong>the</strong> Justice<br />
Center.<br />
Improve flood hazard areas<br />
through <strong>the</strong> use of conveyance<br />
system structural Improvement.<br />
Conveyance system structural<br />
improvements can be an effective<br />
means for flood damage reduction<br />
. Prioritize locations w<strong>here</strong> flood<br />
damages have/may occur and<br />
design/construct improvements as<br />
funding becomes available.<br />
Floodplain Management. Current<br />
minimum federal requirements<br />
allow fill in <strong>the</strong> floodplain and<br />
rising of <strong>the</strong> water<br />
surface elevation. The City would<br />
also like to continue to be<br />
compliant with <strong>the</strong> NFIP.<br />
Restrict/eliminate development in<br />
<strong>the</strong> existing and future conditions<br />
floodplains and acquire land if<br />
necessary.<br />
Shawnee believes in active code<br />
enforcement and follows national<br />
standards regarding all building<br />
codes. In <strong>the</strong> past we have<br />
M 3 All Hazards New Acting Emergency Manager Cost: $5,000 - $10,000<br />
Funds: General Fund<br />
Completion Date: Continuous<br />
H 1,2 Tornado, Windstorm New Acting Emergency Manager Cost: $10,000 to $400,000<br />
Funds: Non Available<br />
Completion Date: Unknown<br />
H 1 Flood On-going, Public Works Director Cost: Unknown<br />
Funds: Stormwater Management<br />
Program, State, Federal<br />
Completion Date: on-going<br />
H 1,2 Flood On-going,<br />
Open<br />
Ended<br />
H 1,2 All Hazards On-going,<br />
Open<br />
Ended<br />
Public Works Director<br />
Public Works Director<br />
Cost: Unknown<br />
Funds: State, Federal<br />
Completion Date: Continuous<br />
Cost: Unknown<br />
Funds: County, Federal<br />
Completion Date: Continuous<br />
4.40
Shawnee 4<br />
Shawnee 7<br />
SH5<br />
Shawnee 6<br />
adopted, within a reasonable time,<br />
all code enhancements as<br />
deemed applicable and useful in<br />
<strong>the</strong> City. Shawnee will <strong>review</strong> all<br />
enhancements to building codes<br />
on <strong>the</strong> national level and consider<br />
adopting those as appropriate.<br />
Habitable building buyout. Some<br />
habitable buildings may be located<br />
in <strong>the</strong> floodplain and/or are subject<br />
to flooding. Identify habitable<br />
buildings in <strong>the</strong> floodplain and/or<br />
are subject to flooding, prioritize<br />
locations, and purchase buildings<br />
as funding becomes available.<br />
Flood warning System<br />
Implementation. Provide <strong>the</strong><br />
ability to warn residents and <strong>the</strong><br />
traveling public about<br />
potential/actual flooding that<br />
threatens people, property and<br />
travel. Work with o<strong>the</strong>r<br />
jurisdictions to build infrastructure<br />
for flood warning system<br />
components<br />
Trailer Mounted Generator,<br />
portable. Backup generators at<br />
Justice Center and Fire<br />
headquarters are not adequate to<br />
power entire building, only certain<br />
positions, in an emergency. Have<br />
at least one portable generator<br />
that can be transported to<br />
whatever city building needs it<br />
most, to boost power for that<br />
facility.<br />
Shawnee will work mitigate <strong>the</strong><br />
impacts of a winter storms.<br />
Johnson County experiences<br />
many winter storm events each<br />
year. These can lead to power<br />
outages which impact all levels of<br />
our citizenry. The City of<br />
Shawnee will work with Johnson<br />
County, citizens and businesses<br />
to prepare for winter storm<br />
impacts including power outages.<br />
This will be accomplished via web<br />
based education campaigns,<br />
presentations to citizens, civic<br />
groups, businesses, etc., and<br />
participation with regional partners<br />
H 1 Flood On-going,<br />
Open<br />
Ended<br />
Public Works Director<br />
Cost: Unknown<br />
Funds: Stormwater Management<br />
Program, State, Federal<br />
Completion Date: Continuous<br />
M 4 Flood On-going Public Works Director Cost: Unknown<br />
Funds: State, Federal<br />
Completion Date: On-going<br />
H 1,2 All Hazards New Acting Emergency Manager Cost: $30,000 to $50,000<br />
Funds: No funds Available<br />
Completion Date: On-going<br />
H 3 Winter Storms,<br />
Utility/Infrastructure Failure<br />
Deleted,<br />
replaced<br />
with SH2<br />
Fire Department<br />
Cost: Unknown<br />
Funds: State, Federal<br />
Completion Date: Deleted<br />
4.41
Shawnee 8<br />
on education campaigns. via web<br />
based education campaigns,<br />
presentations to citizens, civic<br />
groups, businesses, etc., and<br />
participation with regional partners<br />
on education campaigns.<br />
Flood proof buildings. Many<br />
buildings are located in <strong>the</strong><br />
floodplain and/or are subject to<br />
flooding. If buyout is not an option,<br />
installing/completing flood proofing<br />
techniques can minimize <strong>the</strong><br />
potential for loss of life and<br />
property damage. Identify<br />
habitable buildings in <strong>the</strong><br />
floodplain and/or are subject to<br />
flooding, prioritize locations,<br />
install/complete flood proofing<br />
techniques for buildings as<br />
funding becomes available if<br />
buyout is not an option.<br />
L 1,2 Flood On-going,<br />
Open<br />
Ended<br />
Public Works Director<br />
Cost: Unknown<br />
Funds: State, Federal<br />
Completion Date: Continuous<br />
Action ID Action/Description Priority Goal(s)<br />
Addressed<br />
SpringH 1 Tornado safe rooms in all future<br />
city buildings. Kansas was <strong>the</strong><br />
highest rated state for tornadoes<br />
in 2008 at 168. In addition, <strong>the</strong><br />
area is often battered by high wind<br />
events that cause extensive<br />
damage. The city has plans to<br />
<strong>review</strong> <strong>the</strong> concept of adding a<br />
tornado refuge built to FEMA<br />
standards in all new construction<br />
because of this issue. The City of<br />
Spring Hill will <strong>review</strong> all future<br />
building plans and <strong>review</strong> <strong>the</strong><br />
ability to add a safe room for<br />
citizens and employees in<br />
buildings such as libraries, public<br />
safety buildings, general use<br />
buildings and o<strong>the</strong>r buildings as<br />
appropriate. They will seek<br />
federal funding to assist with <strong>the</strong><br />
building of <strong>the</strong> safe room.<br />
Johnson County – City of Spring Hill<br />
Hazard Addressed Status Responsible Entity Estimated Cost and funding Source<br />
H 1 Tornado On-going Spring Hill Planning &<br />
Development<br />
SpringH 2 Continue compliance with NFIP H 1,2 Flood Ongoing/Open<br />
Ended<br />
City of Spring Hill<br />
Cost: Unknown<br />
Funding: City funding, Federal as<br />
identified<br />
Completion Date: Unknown<br />
Cost: NA<br />
Funding: NA<br />
Completion Date: Open Ended<br />
4.42
SpringH 3<br />
SpringH 4<br />
Public information distribution<br />
after a disaster. Experience has<br />
taught city officials that accurate<br />
information to <strong>the</strong> public is vital<br />
during and after a disaster event.<br />
Understanding that telephone,<br />
television and internet services<br />
are not always available in many<br />
events, establishing a central<br />
location for information such as<br />
shelters, food banks, waste<br />
removal locations, etc. will aid <strong>the</strong><br />
public and ensure accurate<br />
information is distributed. A<br />
secondary location would be<br />
established in <strong>the</strong> event <strong>the</strong><br />
primary location is unavailable.<br />
The City of Spring Hill will<br />
establish a primary and secondary<br />
location to serve as a distribution<br />
point for public information. City<br />
staff will work to provide as much<br />
information as possible on topics<br />
specific to <strong>the</strong> event and have this<br />
information readily available in a<br />
paper format.<br />
Portable generator for City Hall. An<br />
electrical power outage to City<br />
Hall would reduce our ability to<br />
provide public safety and<br />
Emergency Management services<br />
to <strong>the</strong> public. Currently City Hall<br />
has no source of emergency<br />
power and this would provide a<br />
back-up to conventional electrical<br />
service to <strong>the</strong> building. As an<br />
alternative solution, <strong>the</strong> installation<br />
of a permanent generator would<br />
be more desirable, however we<br />
currently are in <strong>the</strong> early planning<br />
stages of planning a new facility<br />
for City Hall. Should a new<br />
building be approved, <strong>the</strong> need for<br />
a permanent generator will be<br />
shifted to <strong>the</strong> new facility. The<br />
generator/trailer will be stored at<br />
<strong>the</strong> Public Works Building.<br />
Scheduled maintenance and<br />
operation will be supervised by <strong>the</strong><br />
Public Works Director and<br />
performed by <strong>the</strong> city staff. Upon<br />
M 4 All Hazards Ongoing/Open<br />
Ended<br />
M 2 Lightning, tornado,<br />
utility/infrastructure failure,<br />
winter storm, windstorm<br />
Spring Hill Planning<br />
Department<br />
Cost: Unknown<br />
Funding: Local<br />
Completion Date: Implemented as<br />
needed<br />
On-going Public Works Cost: Undetermined<br />
Funding: FEMA, State of Kansas, local<br />
capitol improvement budgeting<br />
Completion Date: TBA<br />
4.43
electrical power failure and <strong>the</strong><br />
building stand-by generator<br />
failure, <strong>the</strong> trailer would be<br />
dispatched to <strong>the</strong> point of need.<br />
Connection to <strong>the</strong> building would<br />
be made via a wea<strong>the</strong>r-proof<br />
service box to support essential<br />
functions inside <strong>the</strong> City Hall<br />
building. If a decision is made for<br />
a permanent generator <strong>the</strong>n<br />
appropriate switch boxes and<br />
conversion equipment will be<br />
installed<br />
Action ID Action/Description Priority Goal(s)<br />
Addressed<br />
Westwood 1 Back-up generators for critical<br />
facilities. City Hall/Police Dept has<br />
no back-up power nor does public<br />
works building. Install generators<br />
in currently owned buildings –<br />
community center located in City<br />
Hall Building.<br />
Johnson County – City of Westwood<br />
Hazard Addressed Status Responsible Entity Estimated Cost and funding Source<br />
M 2 Lightning, tornado,<br />
utility/infrastructure failure,<br />
winter storm, windstorm<br />
On-going<br />
Westwood 2 Continued Participation in <strong>the</strong> NFIP H 1,2 Flood Ongoing/Open<br />
Ended<br />
Police Department/Public<br />
Works<br />
City of Westwood<br />
Cost: $75,000 - $100,000<br />
Funding: State and federal agencies<br />
Completion Date: 1 – 2 years<br />
Cost: NA<br />
Funding: NA<br />
Completion Date: Open Ended<br />
Johnson County – City of Westwood Hills<br />
Action ID Action/Description Priority Goal(s)<br />
Hazard Addressed Status Responsible Entity Estimated Cost and funding Source<br />
Addressed<br />
Westwood<br />
Hills 1<br />
City of Westwood Hills<br />
Continued Participation in <strong>the</strong> NFIP H 1,2 Flood Ongoing/Open<br />
Ended<br />
Cost: NA<br />
Funding: NA<br />
Completion Date: Open Ended<br />
Johnson County – USD 229 Blue Valley<br />
Action ID Action/Description Priority Goal(s)<br />
Hazard Addressed Status Responsible Entity Estimated Cost and funding Source<br />
Addressed<br />
USD229 1 Blue Valley Schools Safe Room<br />
Shelter for staff and students<br />
M 1,2 Tornado, Windstorm On-going Director of Blue Valley<br />
Safety & Security<br />
Cost: Unknown<br />
Funding: HMGP<br />
during wind storms. Build safe<br />
Completion Date: Ongoing as<br />
rooms/”hardened” room in school<br />
funding becomes available<br />
facilities in accordance with FEMA<br />
4.44
publication #361, “Design and<br />
Construction Guidance for<br />
Community Shelters”.<br />
Action ID Action/Description Priority Goal(s)<br />
Addressed<br />
USD230 1 Tornado safe rooms at all<br />
attendance centers. Build safe<br />
rooms/”hardened” room in school<br />
facilities in accordance with FEMA<br />
publication #361, “Design and<br />
Construction Guidance for<br />
Community Shelters”.<br />
Johnson County – USD 230 Spring Hill<br />
Hazard Addressed Status Responsible Entity Estimated Cost and funding Source<br />
M 1,2 Tornado, Windstorm On-going Superintendent/Asst.<br />
Superintendent<br />
Cost: $100,000 to $150,000 per bldg<br />
$500,000 to 750,000 total.<br />
Funding: bond issues and HMGP<br />
Completion Date: 2014<br />
Johnson County – USD 231 Gardner/Edgerton<br />
Action ID Action/Description Priority Goal(s)<br />
Hazard Addressed Status Responsible Entity Estimated Cost and funding Source<br />
Addressed<br />
USD231 1 Severe Wea<strong>the</strong>r Reguge Area<br />
Improvements Study. T<strong>here</strong> are<br />
differing levels of space available<br />
H 1,2 Tornado, Windstorm On-going USD231 Director of<br />
Operations<br />
Cost: $36,000 for thorough study<br />
Funding: FEMA grants, existing<br />
capital revenue, and future school<br />
for refuge areas in each of <strong>the</strong><br />
bond revenue<br />
nine attendance centers. 1. Staff<br />
Completion Date: 2010<br />
survey of each building’s refuge<br />
areas 2. Employ design<br />
consultants to assist with each site<br />
survey 3. Implement list of desired<br />
improvements ranked by level of<br />
need.<br />
USD231 2<br />
Tornado safe rooms in schools.<br />
Johnson County averages at least<br />
1 tornado every 2 years. Not all<br />
<strong>the</strong> schools have a<br />
“hardened area” for severe<br />
wea<strong>the</strong>r sheltering. Work with<br />
district architects for <strong>the</strong> safe room<br />
to be constructed in accordance<br />
with FEMA publication #361,<br />
“Design and Construction<br />
Guidance for Community Shelters”<br />
H 1,2 Tornado, Windstorm On-going School district<br />
administration<br />
Cost: Unknown<br />
Funding: HMGP<br />
Completion Date: Unknown<br />
Johnson County – USD 232 De Soto<br />
4.45
Action ID Action/Description Priority Goal(s)<br />
Addressed<br />
USD232 1 Safe Room tornado Shelters in<br />
H 1,2 Tornado, Windstorm On-going Crisis Plan Coordinator,<br />
Schools. USD 232 is among <strong>the</strong><br />
Facility Department<br />
cooperating school districts now<br />
undertaking a study of tornado<br />
safety shelters for KSDE. This<br />
action plan shows intent to follow<br />
up on this study to provide safe<br />
rooms w<strong>here</strong> current shelter areas<br />
are lacking. Work with district<br />
architects to plan for windresistant<br />
doors and reinforced<br />
shelters in new construction.<br />
USD232 2<br />
Educate Students and/or<br />
stakeholders. USD 232 seeks to<br />
provide lifelong learning<br />
opportunities for all of its patrons<br />
and works to make <strong>the</strong> school a<br />
central depository of information.<br />
USD 232 has an involved<br />
crisis/safety plan that includes<br />
educating its students, staff and<br />
patrons of possible hazards and<br />
steps <strong>the</strong>y can take to protect<br />
<strong>the</strong>mselves. Use community<br />
school resources to disseminate<br />
news and information to students,<br />
staff and patrons.<br />
Hazard Addressed Status Responsible Entity Estimated Cost and funding Source<br />
M 3 All Hazards Ongoing/Open<br />
Ended<br />
Schools<br />
Cost: Unknown<br />
Funding: HMGP<br />
Completion Date: Unknown<br />
Cost: Unknown<br />
Funding: USD232<br />
Completion Date: Open Ended<br />
Action ID Action/Description Priority Goal(s)<br />
Addressed<br />
USD233 1 Safe Room Tornado Shelters in<br />
Schools. Johnson County<br />
averages at least 1 tornado every<br />
2 years. None of <strong>the</strong> Ola<strong>the</strong><br />
schools have a “hardened area”<br />
for severe wea<strong>the</strong>r sheltering.<br />
Work with district architects for <strong>the</strong><br />
safe room to be constructed in<br />
accordance with FEMA publication<br />
#361, “Design and Construction<br />
Guidance for Community Shelters”<br />
for new schools, additions to<br />
schools, and school renovation<br />
projects.<br />
Johnson County – USD 233 Ola<strong>the</strong><br />
Hazard Addressed Status Responsible Entity Estimated Cost and funding Source<br />
H 1,2 Tornado, Windstorm On-going School District<br />
Administration<br />
Cost: Unknown<br />
Funding: HMGP<br />
Completion Date: 1 – 5 years<br />
4.46
USD233 2<br />
Back up generators for food<br />
production center, central office,<br />
and designated Jr High for<br />
community shelter. These three<br />
designated facilities are critical to<br />
communities’ disaster response<br />
plans. As new additions and<br />
remodeling occurs, new back-up<br />
generators should be purchased<br />
for <strong>the</strong>se three facilities.<br />
M 2 Lightning, tornado,<br />
utility/infrastructure failure,<br />
winter storm, windstorm<br />
On-going<br />
School District<br />
Administration<br />
Cost: Unknown<br />
Funding: Unknown<br />
Completion Date: 1 – 5 years<br />
Johnson County – USD 512 Shawnee Mission<br />
Action ID Action/Description Priority Goal(s)<br />
Hazard Addressed Status Responsible Entity Estimated Cost and funding Source<br />
Addressed<br />
USD512 1 Shawnee Mission Schools Safe<br />
Rooms. USD 512 is among <strong>the</strong><br />
cooperating school districts now<br />
undertaking a study of tornado<br />
safety shelters for KSDE. This<br />
action plan shows intent to follow<br />
up on this study to provide safe<br />
rooms w<strong>here</strong> current shelter areas<br />
are lacking. Work with district<br />
architects for <strong>the</strong> safe room to be<br />
constructed in accordance with<br />
FEMA publication #361, “Design<br />
and Construction Guidance for<br />
Community Shelters”.<br />
H 1,2 Tornado, Windstorm On-going Shawnee Mission<br />
Operations & Maintenance<br />
Department<br />
Cost: Unknown<br />
Funds: Bond and/or capital funds,<br />
HMGP<br />
Completion Date: Unknown<br />
Johnson County – Kansas School of <strong>the</strong> Deaf<br />
Action ID Action/Description Priority Goal(s)<br />
Hazard Addressed Status Responsible Entity Estimated Cost and funding Source<br />
Addressed<br />
KSD 1<br />
ADA Community Safe Room.<br />
The student population is<br />
multiply disabled including<br />
blindness. Moving <strong>the</strong>m around<br />
as a group is slow and<br />
H 1,2 Windstorm, Tornado New Unified Government,<br />
KSSDB Superintendent<br />
Cost: Unknown<br />
Funds: FEMA Grant<br />
Completion Date: 12 – 18 months<br />
4.47
KSD 2<br />
cumbersome. The school<br />
buildings, w<strong>here</strong> students<br />
spend most of <strong>the</strong>ir day, were<br />
built in <strong>the</strong> prior to 1950's and<br />
are not equipped with<br />
reinforced construction<br />
required to provide truly safe<br />
protection from tornadoes or<br />
o<strong>the</strong>r severe wea<strong>the</strong>r related<br />
incidents. Currently hallways<br />
are designated as tornado<br />
shelter areas. We do this<br />
because <strong>the</strong> many buildings<br />
have no basement . An ADA<br />
Safe Room on <strong>the</strong> main level<br />
would allow us to move <strong>the</strong><br />
students to this area in a short<br />
period of time w<strong>here</strong> <strong>the</strong>y were<br />
safe and w<strong>here</strong> <strong>the</strong>y can be<br />
<strong>found</strong> easily by emergency<br />
personnel.<br />
Backup Generator. We have<br />
medically fragile students with<br />
multiple handicaps many of<br />
whom live on site. Loss of<br />
power would expose <strong>the</strong>m to<br />
danger from health risks from<br />
lowered temperatures and<br />
safety risks from exposure to<br />
alternative heating sources like<br />
kerosene heaters or o<strong>the</strong>r<br />
exposed flames. Over <strong>the</strong> years<br />
during loss or power incidents<br />
<strong>the</strong> students have been at risk.<br />
The campus was originally built<br />
in mid 1800’s; <strong>the</strong> wiring is<br />
antiquated. We have multiple<br />
separate power feeds into <strong>the</strong><br />
campus. The generator would<br />
allow us to better protect <strong>the</strong><br />
students in <strong>the</strong> event of a major<br />
crisis like an Ice Storm – <strong>the</strong><br />
generator would prevent<br />
students being exposed to<br />
dangerous environments such<br />
as loss of heat, open heaters,<br />
kerosene heaters, inadequate<br />
food preparation and safe food<br />
storage. Also because of <strong>the</strong><br />
location and layout of <strong>the</strong><br />
campus we could be an<br />
emergency housing site for<br />
H 1,2 Utility Failure, Windstorm,<br />
Winter Storm<br />
New<br />
Unified Government, KSSB<br />
Superintendent<br />
Cost: $230,000 total<br />
Funds: FEMA<br />
Completion Date: 8 – 10 months<br />
4.48
KSD 3<br />
KSD 4<br />
neighborhood groups living in<br />
<strong>the</strong> vicinity. The campus could<br />
also provide housing for<br />
workers such as utility workers<br />
or medical personnel or even a<br />
quarantine location in <strong>the</strong> event<br />
of a medical emergency. For<br />
this level of response all <strong>the</strong><br />
buildings would be need access<br />
to <strong>the</strong> Backup Generator.<br />
Closed Site Clinic. We are a<br />
facility with medically fragile<br />
students some of whom have<br />
multiple disabilities; <strong>the</strong>refore,<br />
we have an onsite Infirmary with<br />
24/5 staffing. Because many of<br />
<strong>the</strong> students come from out of<br />
state Kansas it is sometimes<br />
difficult to impossible for <strong>the</strong>m to<br />
get immunizations for things like<br />
flu in <strong>the</strong>ir home communities<br />
because <strong>the</strong>y live on <strong>the</strong> campus<br />
during <strong>the</strong> week. Having vaccine<br />
available on campus would<br />
facilitate <strong>the</strong>m getting <strong>the</strong> proper<br />
immunization as well as<br />
providing <strong>the</strong> service to <strong>the</strong> staff.<br />
In addition we could provide <strong>the</strong><br />
same service, in cooperation<br />
with <strong>the</strong> Health Dept. To <strong>the</strong><br />
community neighbors. We<br />
propose having a regular<br />
scheduled time for<br />
immunizations on <strong>the</strong> campus<br />
using <strong>the</strong> qualified medical staff.<br />
This could be coordinated with<br />
<strong>the</strong> Unified Government Health<br />
Department<br />
Mass Notification for intruders,<br />
hazards, natural disasters, bomb<br />
and civil disorder events. This<br />
type of notification systems<br />
proves to be effective for deaf<br />
(visual notice) & for blind (audio)<br />
individuals.<br />
H 1,2 Major Disease Outbreak New Unified Government, KSSB<br />
Superintendent<br />
H 1,2,4 All Hazards New School for <strong>the</strong> Blind<br />
Operations Director<br />
Cost: Unknown<br />
Funds: FEMA Grant<br />
Completion Date On-going<br />
Cost: $800,000<br />
Funds: State, FEMA<br />
Completion Date: 5 year phased<br />
implementation<br />
4.49
KSD5<br />
All Hazard Staff & Student<br />
Evacuation Plan/Education.<br />
1. Preparing staff and<br />
students for <strong>the</strong>ir role in<br />
all-hazard<br />
preparedness is<br />
paramount to <strong>the</strong><br />
schools capability to<br />
respond to and recover<br />
from potential hazards.<br />
2. Educating staff &<br />
students about safety,<br />
regulations, and<br />
alternative work site is<br />
ano<strong>the</strong>r safety issue we<br />
could potentially face.<br />
3. Continue to produce,<br />
update annually and<br />
distribute <strong>the</strong> Crisis<br />
Management<br />
Handbook. This is used<br />
in relation to local<br />
emergency response<br />
teams training as well<br />
as distributed to ??<br />
groups and school<br />
associations.<br />
4. Help continue to<br />
produce update inserts<br />
for <strong>the</strong> August 1 st start<br />
of school all staff inservice.<br />
H 1,3,4 All Hazards On-going Crisis Management Team and<br />
Emergency Management<br />
Department<br />
Cost: $185 for 20-40 handbooks<br />
Funds: Instructional Operational<br />
Funding<br />
Completion Date: FY 2013 On-going<br />
Johnson County – Johnson County Community College<br />
Action ID Action/Description Priority Goal(s)<br />
Hazard Addressed Status Responsible Entity Estimated Cost and funding Source<br />
Addressed<br />
JCCC 1 Upgrade new Library & o<strong>the</strong>r new H 1,2 Tornado, Windstorm On-going JCCC Police Department Cost: $30,000 million<br />
buildings with safe rooms.<br />
and Emergency<br />
For library and safe room.<br />
Johnson County Community<br />
Preparedness Manager Funds: Bonds, Grants, College<br />
College Campus does not<br />
Budget, Donations<br />
currently have any safe rooms.<br />
Completion Date: 2012<br />
During <strong>the</strong> planning,<br />
programming, and design of <strong>the</strong><br />
new Library addition, <strong>the</strong><br />
architects and engineers will make<br />
cost estimates for providing<br />
community safe rooms<br />
to protect <strong>the</strong> peak building<br />
population. This will be completed<br />
in accordance with FEMA<br />
publication #361, “Design and<br />
4.50
Construction Guidance for<br />
Community Shelters”.<br />
Johnson County – University of Kansas Edwards Campus<br />
Action ID Action/Description Priority Goal(s)<br />
Hazard Addressed Status Responsible Entity Estimated Cost and funding Source<br />
Addressed<br />
KUEdwards 1 Update Emergency Management<br />
Plan<br />
KUEdwards 2<br />
Public Education To provide<br />
educational preparedness <strong>material</strong><br />
to students, staff, and faculty.<br />
KUEdwards 3 Future Design of Buildings –<br />
include safe room design. The<br />
University of Kansas Edwards<br />
Campus does not currently have<br />
any safe rooms. All future<br />
buildings constructed, will be<br />
designed to include safe rooms<br />
constructed in accordance with<br />
FEMA publication #361, “Design<br />
and Construction Guidance for<br />
KUEdwards 4 Mutual Aid Agreement. The<br />
University of Kansas Edwards<br />
Campus does not currently have<br />
any mutual aid agreement with<br />
outside response agencies.<br />
Develop mutual aid agreements<br />
with nearby response agencies<br />
M 1,3,4 All Hazards On-going Mary E. Ryan, Associate<br />
Dean, Academic and<br />
Student Affairs, KU Edwards<br />
Campus<br />
M 3 All Hazards On-going,<br />
Open<br />
Ended<br />
Mary E. Ryan, Associate<br />
Dean, Academic and<br />
Student Affairs, KU Edwards<br />
Campus<br />
M 1,2 Tornado, Windstorm On-going Mary E. Ryan, Associate<br />
Dean, Academic and<br />
Student Affairs, KU Edwards<br />
Campus<br />
M 4 All Hazards On-going Mary E. Ryan, Associate<br />
Dean, Academic and<br />
Student Affairs, KU Edwards<br />
Campus<br />
Cost: Minimal<br />
Funds: No funds<br />
Completion Date: 2013<br />
Cost: Minimal<br />
Funds: No funds<br />
Completion Date: 2013<br />
Cost: Minimal<br />
Funds: KDEM, FEMA<br />
Completion Date: Unknown<br />
Cost: Minimal<br />
Funds: No funds<br />
Completion Date: 2014<br />
Johnson County – Consolidated Fire District #2<br />
Action ID Action/Description Priority Goal(s)<br />
Hazard Addressed Status Responsible Entity Estimated Cost and funding Source<br />
Addressed<br />
ConsFD2 1 Replacement of doors at H 2 Windstorm On-going Consolidated FD #2 Cost: $60,000<br />
4.51
emergency fire protection facility.<br />
The existing apparatus bay doors<br />
at Consolidated Fire District #2<br />
are slow opening and<br />
hazardous to operate particularly<br />
during inclement wea<strong>the</strong>r. The<br />
plan is to retrofit or replace <strong>the</strong><br />
existing apparatus bay doors with<br />
wind storm resistant, quick<br />
opening bi-fold doors.<br />
Funds: Unknown<br />
Completion Date: 18 months<br />
Action ID Action/Description Priority Goal(s)<br />
Addressed<br />
FD1 1 Fire Station Windstorm Damage<br />
Mitigation. The South West<br />
portion of Johnson County is<br />
vulnerable to severe wea<strong>the</strong>r<br />
conditions which produce<br />
damaging winds. Fire stations are<br />
susceptible to damage from <strong>the</strong>se<br />
storms. The weakest points of <strong>the</strong><br />
structures are apparatus bay<br />
doors and large surface area<br />
windows. Retrofit <strong>the</strong> three fire<br />
stations within <strong>the</strong> Fire District with<br />
wind resistant / energy efficient<br />
doors. All large surface area<br />
windows would be fitted with<br />
storm panels.<br />
Johnson County – Fire District #1<br />
Hazard Addressed Status Responsible Entity Estimated Cost and funding Source<br />
H 2 Windstorm On-going Fire District #1 Johnson<br />
County, Fire chief<br />
Cost: $250,000<br />
Funds: Budget, Bonds, Mitigation<br />
Grant funds if available<br />
Completion Date: Unknown<br />
Action ID Action/Description Priority Goal(s)<br />
Addressed<br />
FD2 1 Fire Station Windstorm Damage<br />
Mitigation. Johnson County is<br />
vulnerable to severe wea<strong>the</strong>r<br />
conditions which produce<br />
damaging winds. Fire stations are<br />
susceptible to damage from <strong>the</strong>se<br />
storms. The weakest points of <strong>the</strong><br />
structures are apparatus bay<br />
Johnson County – Fire District #2<br />
Hazard Addressed Status Responsible Entity Estimated Cost and funding Source<br />
H 2 Windstorm On-going Fire District #2, Fire Chief Cost: $250,000<br />
Funds: Budget, Bonds, Mitigation<br />
Grant funds if available.<br />
Completion Date: Unknown<br />
4.52
FD2 2<br />
doors and large surface area<br />
windows. Retrofit <strong>the</strong> fire stations<br />
within <strong>the</strong> Fire District with wind<br />
resistant / energy efficient doors.<br />
All large surface area windows<br />
would be fitted with storm panels.<br />
Purchase Backup generators.<br />
During many severe<br />
thunderstorms and ice storms<br />
electrical power is lost. This<br />
causes a delay of response that<br />
may be needed. The plan is to<br />
obtain cost share funding from<br />
FEMA to purchase two generators<br />
for fire station #2 and #3<br />
H 2 Lightning, Tornado,<br />
Utility/Infrastructure<br />
Failure, Winter Storm,<br />
Windstorm<br />
On-going Fire District #2, Fire chief Cost: Unknown<br />
Funds: Grants, capital improvement,<br />
and bonds<br />
Completion Date: 2009<br />
Action ID Action/Description Priority Goal(s)<br />
Addressed<br />
FD3 1 Back-up generators for fire<br />
stations. During many severe<br />
thunderstorms and ice storms<br />
electrical power is lost. This<br />
causes a delay of response that<br />
may be needed. The plan is to<br />
obtain cost share funding from<br />
FEMA to purchase two or three<br />
generators for <strong>the</strong> fire stations.<br />
Johnson County – Fire District 3<br />
Hazard Addressed Status Responsible Entity Estimated Cost and funding Source<br />
M 2 Lightning, Tornado,<br />
Utility/Infrastructure<br />
Failure, Winter Storm,<br />
Windstorm<br />
On-going<br />
Fire District #3, Johnson<br />
County<br />
Cost: Unknown<br />
Funds: Grants, capital<br />
improvement, and bonds<br />
Completion Date: 2009<br />
Leavenworth County<br />
Action<br />
ID<br />
Action/Description Priority Goal(s)<br />
Addressed<br />
1 Leavenworth County and <strong>the</strong> cities<br />
of Basehor, Lansing, Leavenworth,<br />
Linwood, and Tonganoxie are<br />
committed to continued participation<br />
and compliance with <strong>the</strong> National<br />
Leavenworth County<br />
Multijurisdictional Actions<br />
Hazard Addressed Status Responsible Entity Estimated cost, Funding Source, and<br />
Completion Date<br />
County Planners, City Officials Cost: NA<br />
Funds: State/FEMA/Program<br />
Grants<br />
Completion Date: continuous<br />
H 1,2 Flood On-going,<br />
Open<br />
Ended<br />
4.53
Flood Insurance Program (NFIP).<br />
The decision on whe<strong>the</strong>r to join <strong>the</strong><br />
NFIP is very important for a<br />
jurisdiction (community). T<strong>here</strong> is no<br />
Federal law that requires a<br />
jurisdiction to join <strong>the</strong> program, and<br />
participation is voluntary. A benefit<br />
of participation is that <strong>the</strong> citizens<br />
are provided <strong>the</strong> opportunity to<br />
purchase flood insurance to protect<br />
<strong>the</strong>mselves against flood losses.<br />
Ano<strong>the</strong>r consideration is that a<br />
jurisdiction that has been identified<br />
by FEMA as being flood-prone and<br />
has not joined <strong>the</strong> NFIP within one<br />
year of being notified of being<br />
mapped as flood-prone will be<br />
sanctioned. Jurisdictions that<br />
regulate development in floodplains<br />
are able to participate in <strong>the</strong> NFIP.<br />
To participate in <strong>the</strong> NFIP <strong>the</strong><br />
jurisdiction must adopt and enforce<br />
floodplain management regulations<br />
that meet or exceed <strong>the</strong> minimum<br />
requirements of <strong>the</strong> program.<br />
2 Contact owners identified in highrisk<br />
flood areas and inform <strong>the</strong>m of<br />
potential availability of assistance<br />
through <strong>the</strong> Federal Flood Mitigation<br />
Assistance (FEMA) program, in<br />
addition to o<strong>the</strong>r flood protection<br />
measures. Property owners should<br />
be contacted every year to promote<br />
<strong>the</strong> availability of <strong>the</strong> FEMA funding<br />
and to determine <strong>the</strong>ir level of<br />
interest in applying for <strong>the</strong> program.<br />
3 Advertise and promote <strong>the</strong><br />
availability of flood insurance to<br />
property owners by direct<br />
mail once a year. Leavenworth<br />
County, including <strong>the</strong> cities of<br />
Leavenworth, Lansing, Basehor,<br />
Easton, Tonganoxie, and Linwood,<br />
participates in <strong>the</strong> National Flood<br />
Insurance Program (NFIP). T<strong>here</strong><br />
are currently 214 policies in effect,<br />
with a total coverage amount of<br />
$41,122,700. Since <strong>the</strong> jurisdiction<br />
joined <strong>the</strong> program, <strong>the</strong>re have<br />
been 197 claims paid for a total loss<br />
paid amount of $2,260,341.<br />
(Source: FEMA, 2008). NFIP flood<br />
H 3 Flood On-going,<br />
Open<br />
Ended<br />
H 3 Flood On-going,<br />
Open<br />
Ended<br />
County Planners, City Officials<br />
County Planners, City Officials<br />
Cost: NA<br />
Funds: Local<br />
Completion Date: Continuous<br />
Cost: NA<br />
Funding: Local<br />
Completion Date: Continuous<br />
4.54
insurance policies protect property<br />
owners by offering affordable rates<br />
for protecting both structures and<br />
contents.<br />
4 Collect educational <strong>material</strong>s on<br />
individual and family preparedness /<br />
mitigation measures for property<br />
owners, and display at both <strong>the</strong><br />
library and routinely visited<br />
government offices.<br />
5 Annually host a public “hazards<br />
workshop” in combination with local<br />
festivals, fairs, or o<strong>the</strong>r appropriate<br />
events. A hazard workshop for<br />
county residents should be added to<br />
an established event drawing large<br />
crowds. The workshop should be<br />
geared toward educating <strong>the</strong>m on<br />
<strong>the</strong> hazards that threaten<br />
Leavenworth County, and <strong>the</strong><br />
mitigation and preparedness<br />
measures available to protect <strong>the</strong>m.<br />
Guest speakers from <strong>the</strong> National<br />
Wea<strong>the</strong>r Service, <strong>the</strong> Kansas<br />
Division of Emergency<br />
Management, and o<strong>the</strong>r relevant<br />
agencies should be invited to<br />
attend, and educational<br />
displays/handouts should be<br />
provided such as Flood Insurance<br />
Rate Maps, FEMA publications,<br />
safety tips, etc.<br />
6 Promote and educate <strong>the</strong><br />
jurisdiction’s public and private<br />
sectors on potential<br />
agricultural terrorism and bioterrorism<br />
issues that can severely<br />
impact <strong>the</strong> county and regional<br />
economies, and develop and<br />
implement plans to address <strong>the</strong>se<br />
issues. Leavenworth County is<br />
basically an agricultural community.<br />
A natural or intentional introduction<br />
of a foreign animal disease would<br />
be devastating to <strong>the</strong> local, regional<br />
state, economies. This annex will be<br />
added to <strong>the</strong> Local Emergency<br />
Operations Plan, a separate part of<br />
<strong>the</strong> plan addressing FAD, with<br />
additional annexes developed in <strong>the</strong><br />
future to address o<strong>the</strong>r types of<br />
H 3 All Hazards On-going,<br />
Open<br />
Ended<br />
H 3,4 All Hazards On-going,<br />
Open<br />
Ended<br />
H 1,2,3,4 Terrorism, Agriterrorism,<br />
Civil disorder<br />
On-going,<br />
Open<br />
Ended<br />
Chamber of Commerce,<br />
Emergency Management, City<br />
Officials<br />
City and County Planners,<br />
Emergency Management<br />
County Health Department,<br />
County Emergency Management,<br />
county Extension, Local<br />
Producers<br />
Cost: NA<br />
Funds: Local<br />
Completion Date: Continuous<br />
Cost: NA<br />
Funds: Local<br />
Completion Date: Continuous<br />
Cost: NA<br />
Funds: Local/State<br />
Completion Date: continuous<br />
4.55
terrorism.<br />
7 The County and local governments<br />
will work with <strong>the</strong> Kansas Dept. of<br />
Ag - Division of Water Resources to<br />
educate and promote local<br />
jurisdictional participation in <strong>the</strong><br />
National Flood Insurance Program’s<br />
Community Rating System (CRS).<br />
The Kansas Division of Water<br />
Resources provides local training<br />
and education on <strong>the</strong> benefits of<br />
participation in <strong>the</strong> NFIP. The<br />
program provides availability of<br />
flood insurance to individuals whose<br />
local governments participate in <strong>the</strong><br />
program. Flood insurance claims<br />
are paid even if a disaster is not<br />
declared by <strong>the</strong> President, and<br />
<strong>the</strong>re is no payback requirement.<br />
Flood insurance policies are<br />
continuous, and are not nonrenewed<br />
or cancelled for repeat<br />
losses.<br />
8 Establish, promote, and fund<br />
continuity of water systems between<br />
rural water districts to larger water<br />
departments to manage future<br />
growth in <strong>the</strong> county. The rural<br />
water districts are in need to have<br />
some connectivity to larger<br />
municipal water departments to<br />
continue growth, and also to assure<br />
continuous water supply to all<br />
districts if one district is jeopardized<br />
with lost of water or contamination<br />
of <strong>the</strong> supply. Seek funding through<br />
Federal and State grants to<br />
accomplish this task.<br />
9 Encourage <strong>the</strong> construction of safe<br />
rooms and storm shelters in public<br />
and private schools, day care<br />
centers and senior care facilities.<br />
When severe wea<strong>the</strong>r threatens,<br />
individuals and families need<br />
advance warning and protection<br />
from <strong>the</strong> dangerous forces of<br />
extreme winds. Individuals and<br />
communities in high-risk tornado<br />
and hurricane areas need<br />
structurally sound shelters and early<br />
alert systems.<br />
H 3,4 Flood On-going,<br />
Open<br />
Ended<br />
Emergency Management, City<br />
Officials<br />
M 4 All Hazards On-going Water Departments, Water<br />
Districts<br />
H 1,2 Tornado On-going,<br />
Open<br />
Ended<br />
School Districts, City Officials,<br />
State of Kansas, FEMA<br />
Cost: NA<br />
Funds: Local/State<br />
Completion Date: continuous<br />
Cost: Unknown<br />
Funds: Local, State, Federal<br />
Completion Date: 31 Dec 2015<br />
Cost: Unknown<br />
Funds: FEMA, State, Local<br />
Completion Date: Continuous<br />
10 Prepare and adopt an Outdoor M 1,2 All Hazards On-going Leavenworth County Emergency Cost: Unknown<br />
4.56
Warning Sirens Plan for <strong>the</strong> county,<br />
including consideration of <strong>the</strong><br />
unique geographical locations,<br />
technical requirements, system<br />
types and operational procedures of<br />
each local jurisdiction. The plans<br />
should include a <strong>review</strong> of existing<br />
outdoor warning siren coverage and<br />
recommend new locations if and<br />
w<strong>here</strong> <strong>the</strong>re are coverage gaps.<br />
Seek funding to install new warning<br />
sirens in accordance with <strong>the</strong> plan<br />
recommendations. Some<br />
communities and rural areas of <strong>the</strong><br />
county have older warning systems<br />
or none at all. To better serve <strong>the</strong><br />
citizens of Leavenworth County, a<br />
study should be conducted to<br />
evaluate measures to be taken to<br />
improve overall emergency warning<br />
services.<br />
Management, Emergency<br />
Services<br />
Funds: Local, State, Federal<br />
Completion Date: 31 Dec 2015<br />
Action ID Action/Description Priority Goal(s)<br />
Addressed<br />
1 Develop a program to acquire and<br />
preserve parcels of land subject to<br />
repetitive flooding from willing and<br />
voluntary property owners. Land<br />
acquisition is an effective<br />
mitigation technique to<br />
permanently eliminate <strong>the</strong><br />
potential for damages from future<br />
flood events. Leavenworth County<br />
can apply for grant funding to<br />
acquire flood-prone parcels of<br />
land from voluntary and willing<br />
property owners.<br />
2 Regularly calculate and document<br />
<strong>the</strong> amount of flood prone property<br />
that is preserved as open space to<br />
reduce flood insurance burden to<br />
<strong>the</strong> county. CRS credit is given for<br />
areas that are permanently<br />
preserved as open space.<br />
Leavenworth County<br />
Hazard Addressed Status Responsible Entity Estimated Cost and funding Source<br />
H 1,2 Flood On-going,<br />
Open<br />
Ended<br />
H 1,2 Flood On-going,<br />
Open<br />
Ended<br />
Emergency Management<br />
Planner<br />
Planner, Flood Plain<br />
Administrator<br />
Cost: Unknown<br />
Funds: FEMA, KDEM. Local<br />
Completion Date: Continuous<br />
Cost: Unknown<br />
Funds: NA<br />
Completion Date: Dec 2017<br />
4.57
Although credit is not given for<br />
federal lands, <strong>the</strong> jurisdiction<br />
maintains floodplain areas<br />
preserved as open space through<br />
land acquisition projects (i.e.,<br />
HMGP), which protect parcels<br />
from development through deed<br />
restrictions. The jurisdiction also<br />
has floodplain land within state<br />
parks or o<strong>the</strong>rwise preserved as<br />
wildlife and natural preserves,<br />
which does qualify for additional<br />
CRS credit.<br />
3 Identify flash-flood prone areas to<br />
consider flood reduction measures<br />
to county planners. Flood zone<br />
mapping will provide initial<br />
identification of potential hazard<br />
areas that can be <strong>review</strong>ed with<br />
o<strong>the</strong>r data sources, such as <strong>the</strong><br />
watershed districts goals and<br />
objectives, in developing long<br />
range planning activities for flashflood<br />
prevention, or o<strong>the</strong>r planning<br />
steps to reduce exposure to this<br />
hazard.<br />
4 Amend <strong>the</strong> Floodplain<br />
Management Ordinance to include<br />
a “no-rise (in base flood<br />
elevation)” clause for Leavenworth<br />
County. Many floodplain<br />
permitting systems, including<br />
those that meet National Flood<br />
Insurance Program standards,<br />
allow projects outside <strong>the</strong><br />
floodway to increase base flood<br />
elevations by up to one foot. While<br />
this may not represent a<br />
significant increase for just one<br />
project, <strong>the</strong> cumulative impact of a<br />
number of projects in <strong>the</strong> same<br />
floodplain can be significant. By<br />
prohibiting any rise throughout <strong>the</strong><br />
100-year floodplain, a “no rise”<br />
clause ensures that <strong>the</strong><br />
cumulative impact of multiple<br />
permitted projects will not cause<br />
flood elevations to rise to<br />
unacceptable levels.<br />
5 Research and design an<br />
appropriate stream buffer<br />
ordinance to fur<strong>the</strong>r protect <strong>the</strong><br />
H 1,2 Flood On-going Planner Cost: Unknown<br />
Funds: Local<br />
Completion Date: 31 Dec 2017<br />
H 1,2 Flood On-going Planning Commission,<br />
Planner<br />
H 1,2 Flood On-going Planning Commission,<br />
Planner<br />
Cost: Unknown<br />
Funds: FEMA Mapping Project<br />
Completion Date: 31 Dec 2015<br />
Cost: Unknown<br />
Funds: FEMA/State/Local.Levee<br />
Districts<br />
4.58
jurisdiction’s water resources and<br />
to limit future flood damages<br />
adjacent to major waterways.<br />
Riparian buffers serve as natural<br />
boundaries between local<br />
waterways and existing<br />
development and help protect<br />
resources by filtering pollutants,<br />
providing flood control, alleviating<br />
streambank erosion, mitigating<br />
stream warming, and providing<br />
room for lateral movement of<br />
<strong>the</strong> stream channel. Buffer widths<br />
can vary greatly depending upon<br />
stream channel size and <strong>the</strong><br />
intended purpose of <strong>the</strong> buffer, but<br />
50-100 feet is generally<br />
considered to be sufficient for<br />
purposes of bank stabilization and<br />
sediment control. Many<br />
communities require 200 feet<br />
for flood control purposes. Special<br />
consideration should be given to<br />
Stranger Creek, while exempting<br />
Leavenworth County’s agricultural<br />
operations from buffer regulations.<br />
6 Identify levee owners in <strong>the</strong><br />
jurisdiction. Early in <strong>the</strong><br />
implementation of Flood Map<br />
Modernization (Map Mod), <strong>the</strong><br />
Department of Homeland<br />
Security's Federal Emergency<br />
Management Agency (FEMA)<br />
recognized that <strong>the</strong> role of levees<br />
in flood risk reduction would be an<br />
important part of <strong>the</strong> efforts of Map<br />
Mod. Fur<strong>the</strong>r, it was<br />
acknowledged that <strong>the</strong> condition<br />
of levees had not been assessed<br />
since <strong>the</strong>y were originally mapped<br />
as providing base (1-percentannual-chance)<br />
flood protection.<br />
Because of this, FEMA initiated a<br />
revised process to gain a better<br />
understanding of <strong>the</strong> actual flood<br />
risks for those citizens living and<br />
working behind levees nationwide.<br />
Often, documentation regarding<br />
levee design, accreditation, and<br />
<strong>the</strong> impacts on flood hazard<br />
mapping is outdated or missing<br />
altoge<strong>the</strong>r. Identifying levee<br />
H 1,2 Flood On-going Planner, emergency<br />
Management, Levee<br />
Districts<br />
Completion Date: 31 Dec 2017<br />
Cost: Unknown<br />
Funds: Local<br />
Completion Date: 31 Dec 2015<br />
4.59
owners and developing initiatives<br />
for certifying levees may help<br />
reduce overall risk to life and<br />
property in <strong>the</strong> community.<br />
7 Implement a study to determine<br />
<strong>the</strong> residual flood risk in leveeprotected<br />
areas. Levee owners or<br />
communities have <strong>the</strong><br />
responsibility to provide<br />
documentation that a levee meets<br />
<strong>the</strong> requirements of Title 44 of <strong>the</strong><br />
Code of Federal Regulations,<br />
Section 65.10 of <strong>the</strong> national<br />
Flood Insurance Program<br />
regulations (44CFR Section<br />
65.10), as part of a study/mapping<br />
project. Without <strong>the</strong> required<br />
documentation necessary to<br />
comply with 44 CFR Section<br />
65.10, <strong>the</strong> area behind <strong>the</strong> levee<br />
will be re-delineated and mapped<br />
as Special Flood Hazard Area<br />
(SFHA) on <strong>the</strong> Digital Flood<br />
Insurance Rate Map (DFIRM).<br />
Procedure Memorandum No. 34<br />
allows for <strong>the</strong> issuance of a<br />
deadline to <strong>the</strong> community for<br />
submitting <strong>the</strong> required<br />
documents.<br />
8 Identify <strong>the</strong> county’s most at-risk<br />
critical facilities, and evaluate<br />
potential mitigation techniques for<br />
protecting each facility to <strong>the</strong><br />
maximum extent possible. A<br />
thorough evaluation of potential<br />
mitigation opportunities for<br />
Leavenworth County’s critical<br />
facilities must still be completed.<br />
Currently, <strong>the</strong>re is very little<br />
available data on <strong>the</strong>se facilities.<br />
An inventory/database on critical<br />
facilities should be created and<br />
maintained by <strong>the</strong> county and<br />
shared with <strong>the</strong> Kansas Division of<br />
Emergency Management. This<br />
inventory should include<br />
information on <strong>the</strong> location and<br />
risk to each facility, and should<br />
also document any cost-effective<br />
mitigation techniques to consider<br />
when funding becomes available.<br />
M 1,2 Flood On-going Planner, Levee Districts Cost: Unknown<br />
Funds: Local<br />
Completion Date: 31 Dec 2015<br />
M 1,2 All Hazards On-going Emergency Management Cost: Unknown<br />
Funds: Local<br />
Completion Date: 31 Dec 2017<br />
9 Conduct an inventory/survey for M 1 All Hazards On-going Emergency Management, Cost: Unknown<br />
4.60
<strong>the</strong> county’s emergency response<br />
services to identify any existing<br />
needs or shortfalls in terms of<br />
personnel, equipment or required<br />
resources. A survey should be<br />
completed in order to verify <strong>the</strong><br />
county’s current emergency<br />
services are adequate to protect<br />
public health and safety from<br />
most probable hazard events. Any<br />
identified needs or shortfalls<br />
should become documented and<br />
result in specific recommendations<br />
to <strong>the</strong> County Commission for<br />
emergency service<br />
enhancements.<br />
10 Research, develop, and<br />
recommend an<br />
ordinance/resolution to require<br />
installation of tornado shelters for<br />
major manufactured and/or mobile<br />
home parks with more than 10<br />
mobile home spaces. Mobile<br />
homes are particularly vulnerable<br />
to damage from high winds.<br />
Residents, even those who live in<br />
mobile homes with tie-downs,<br />
should seek safe shelter when a<br />
tornado threatens. Tornado<br />
shelters should be constructed in<br />
major mobile home parks to<br />
ensure a safe place for residents<br />
to go during a tornado event. The<br />
shelter structure, which should be<br />
designed to withstand a minimum<br />
of 120mph winds, could easily<br />
serve an alternate purpose such<br />
as a community center, laundry<br />
facility, etc. Tornado shelters<br />
should be for last minute<br />
protection for high wind events.<br />
11 Evaluate <strong>the</strong> firefighting water<br />
supply resources within <strong>the</strong><br />
County. This should include both<br />
fixed and mobile supply issues.<br />
Lack of sufficient water supply<br />
makes it difficult for firefighters to<br />
suppress fires. Whenever<br />
possible, increasing access to<br />
water along water service delivery<br />
lines (wet and dry hydrants) would<br />
provide additional resources for<br />
H 1,2 Tornado, Windstorm On-going Planning and Zoning<br />
Department<br />
M 1,2 Wildfire On-going Fire Officials, Emergency<br />
Management<br />
GIS<br />
Funds: Local/State<br />
Completion Date: 31 Dec 2015<br />
Cost: Unknown<br />
Funds: NA<br />
Completion Date: 31 Dec 2015<br />
Cost: Unknown<br />
Funds: Local<br />
Completion Date: 31 Dec 2017<br />
4.61
emergency responders.<br />
12 Distribute assessment report<br />
examples provided by <strong>the</strong> Kansas<br />
Forest Service to applicable<br />
parties to develop an<br />
understanding of <strong>the</strong> Community<br />
Wildfire Protection Plan (CWPP).<br />
Recommend joining <strong>the</strong> program<br />
and completing an assessment<br />
report for approval. The<br />
probability of grass/cropland fire in<br />
Leavenworth County is relatively<br />
high. With over 58-years of<br />
history, <strong>the</strong> likelihood of future<br />
events is estimated to remain <strong>the</strong><br />
same as currently calculated.<br />
Leavenworth County can expect<br />
an average of 11.03 significant<br />
wildfires per year that damage or<br />
destroy a total of 292.83 acres<br />
annually. The Kansas Forest<br />
Service staff would provide<br />
assistance to interested<br />
communities in <strong>the</strong> form of a<br />
Community Wildfire Hazard<br />
Assessment Report and some<br />
mitigation action items.<br />
13 Develop and implement a wildfire<br />
prevention/education program. In<br />
addition to providing education to<br />
<strong>the</strong> general public, <strong>the</strong> program<br />
should also target children, fire<br />
and equipment users, builders and<br />
developers, and homeowners.<br />
Leavenworth County has burn-ban<br />
resolutions which require special<br />
permission to conduct open<br />
burning operations. In periods of<br />
drought or extreme wea<strong>the</strong>r<br />
conditions a burn ban may be<br />
declared. When a ban is declared<br />
all radio stations, TV stations, and<br />
regional newspapers in <strong>the</strong> area<br />
are notified as well as mayors, fire<br />
chiefs, etc. To better educate <strong>the</strong><br />
public at large, Leavenworth<br />
County should expand <strong>the</strong>ir<br />
existing fire protection program to<br />
include wildfire workshops to all<br />
age groups and commercial<br />
operations.<br />
H 3,4 Wildfire On-going Rural Fire, Emergency<br />
Management<br />
M 3,4 Wildfire On-going,<br />
Open<br />
Ended<br />
Fire Officials, Emergency<br />
Management<br />
Cost: Unknown<br />
Funds: Local, State, Federal Grant<br />
programs.<br />
Completion Date: 31 Dec 2017<br />
Cost: Unknown<br />
Funds: Local<br />
Completion Date: continuous<br />
14 Examine <strong>the</strong> current agreements H 4 Wildfire On-going, Fire Officials, Emergency Cost: Unknown<br />
4.62
within <strong>the</strong> county and assess <strong>the</strong><br />
need to expand or update<br />
cooperative agreements for<br />
firefighting resources. Include<br />
agreements with local, state and<br />
federal agencies. Cooperative<br />
agreements provide <strong>the</strong> support<br />
needed in times of emergency,<br />
and are an important element of<br />
planning, with <strong>the</strong> long-range goal<br />
of reducing damage to structures<br />
and systems within <strong>the</strong><br />
jurisdiction.<br />
15 Appoint a rural fire committee to<br />
schedule meetings with <strong>the</strong><br />
Kansas Forest Service to map<br />
suspected hazardous wildfire<br />
areas in <strong>the</strong> county for potential<br />
participation in <strong>the</strong> Community<br />
Wildfire Protection Program<br />
(CWPP). In order for a community<br />
to take advantage of <strong>the</strong><br />
Community based Healthy forests<br />
Restoration Act (HFRA), 2003, a<br />
community must develop a<br />
Community Wildfire Protection<br />
Plan (CWPP). To develop<br />
qualifications <strong>the</strong> community must<br />
identify and map potential hazard<br />
areas as an initial step towards<br />
participation in <strong>the</strong> program.<br />
16 Incorporate wildfire maps, develop<br />
actions and projects for wildfire<br />
prevention, and complete an<br />
assessment report to meet CWPP<br />
requirements for submittal to <strong>the</strong><br />
Kansas Forest Service. The<br />
minimum requirements<br />
participation in <strong>the</strong> CWPP as<br />
described in <strong>the</strong> HFRA are: (1)<br />
Collaboration: A CWPP must be<br />
collaboratively developed by local<br />
and state government<br />
representatives, in consultation<br />
with federal agencies and o<strong>the</strong>r<br />
interested parties. (2) Prioritized<br />
Fuel Reduction: A CWPP must<br />
identify and prioritize areas for<br />
hazardous fuel reduction<br />
treatments and recommend <strong>the</strong><br />
types and methods of treatment<br />
that will protect one or more at-risk<br />
Open<br />
Ended<br />
Management<br />
M 3,4 Wildfire On-going Rural Fire, Emergency<br />
Management<br />
M 1,4 Wildfire On-going Rural Fire, Emergency<br />
Management<br />
Funds: Local<br />
Completion Date: Continuous<br />
Cost: Unknown<br />
Funds: Local/State/Federal<br />
Completion Date: 31 Dec 2017<br />
Cost: Unknown<br />
Funds: Local, Federal, State<br />
Completion Date: 31 Dec 2017<br />
4.63
communities and essential<br />
infrastructure. (3) Treatment of<br />
Structural Ignitability: A CWPP<br />
must recommend measures that<br />
homeowners and communities<br />
can take to reduce <strong>the</strong> ignitability<br />
of structures throughout <strong>the</strong> area<br />
addressed by <strong>the</strong> plan.<br />
17 Develop cross-departmental<br />
information collection capabilities,<br />
and incorporate cadastral<br />
(building/parcel) data utilizing a<br />
GIS for purposes of conducting<br />
more detailed hazard risk<br />
assessments and for tracking<br />
permitting / land use patterns,<br />
buildings and infrastructure<br />
replacement costs, and overall<br />
structural accounting for <strong>the</strong><br />
county. A comprehensive catalog<br />
of data can greatly enhance <strong>the</strong><br />
county’s technical capability to<br />
manage, analyze and display<br />
spatially referenced data.<br />
Leavenworth County has GIS<br />
capabilities available through <strong>the</strong><br />
Leavenworth GIS Department.<br />
Fur<strong>the</strong>r development of this<br />
capability for functional use across<br />
all departments will enhance <strong>the</strong><br />
county’s overall capabilities to<br />
document building/structure cost<br />
data, and fur<strong>the</strong>r hazard<br />
mitigation goals in developing<br />
cadastral data for <strong>the</strong> county.<br />
18 Develop an annex to <strong>the</strong> Local<br />
Emergency Operations Plan<br />
(LEOP) for dam/levee failure<br />
response and evacuation plans for<br />
high hazard dams/levees in<br />
Leavenworth County.<br />
Leavenworth County has 221<br />
dams in <strong>the</strong> county that are<br />
regulated by <strong>the</strong> Kansas<br />
Department of Agriculture, Water<br />
Resources Department. Seven of<br />
<strong>the</strong>se structures are classified as<br />
“High Hazard Class C” structures,<br />
and are owned by various private,<br />
State, and Federal agencies. The<br />
State evaluation of <strong>the</strong> dams is<br />
based on location in areas w<strong>here</strong><br />
M 4 All Hazards On-going,<br />
Open<br />
Ended<br />
Emergency Management,<br />
GIS<br />
H 1,2 Dam/Levee On-going Emergency Management<br />
Department<br />
Cost: Unknown<br />
Funds: KDEM, Local, grants<br />
Completion Date: Continuous<br />
Cost: Unknown<br />
Funds: Local<br />
Completion Date: 31 Dec 2017<br />
4.64
failure may cause extensive loss<br />
of life, serious damage to homes,<br />
industrial and commercial<br />
facilities, important public utilities,<br />
main highways or railroads. It is<br />
important to note that a high<br />
hazard dam is not necessarily<br />
unsafe, as defined by <strong>the</strong> State of<br />
Kansas. An individual dam’s<br />
hazard classification is based<br />
upon <strong>the</strong> potential consequences<br />
of dam failure and does not reflect<br />
<strong>the</strong> physical condition of <strong>the</strong> dam.<br />
Preparing for a potential<br />
emergency is an essential<br />
planning step to secure <strong>the</strong> people<br />
and property downstream from a<br />
potential breach or dam failure.<br />
T<strong>here</strong> are also an estimated 48<br />
levees reported in <strong>the</strong> county,<br />
of which four (4) are owned by <strong>the</strong><br />
county. Ownership for <strong>the</strong><br />
remaining levees is listed as<br />
unknown.<br />
19 Seek funding to complete a<br />
stormwater drainage study for<br />
Leavenworth County that will lead<br />
to a stormwater management<br />
ordinance that maintains predevelopment<br />
runoff rates. The<br />
study should include an evaluation<br />
of existing dams/levee systems,<br />
vulnerable streams, and o<strong>the</strong>r<br />
major waterways in <strong>the</strong> county<br />
that may impact growth patterns<br />
established for <strong>the</strong> county.<br />
Stormwater management best<br />
practices for Leavenworth are<br />
addressed in <strong>the</strong> Leavenworth<br />
County Land Use Plan. According<br />
to <strong>the</strong> Plan, guidance is to protect<br />
environmentally sensitive land and<br />
maintain open space, and<br />
adopting a stream setback policy<br />
for all new developments. A<br />
stormwater drainage study/plan<br />
will identify drainage problems and<br />
address solutions through<br />
detention, retention, and drainage<br />
system maintenance among o<strong>the</strong>r<br />
specific mitigation measures.<br />
M 1,2 Flood On-going Planner, Public Works Cost: Unknown<br />
Funds: State of Kansas, FEMA<br />
Completion Date: 31 Dec 2015<br />
20 Research and contact all owners H 3,4 Dam/Levee Failure On-going Emergency Management Cost: Unknown<br />
4.65
of high hazard dams in <strong>the</strong> county,<br />
and inform <strong>the</strong>m of <strong>the</strong>ir<br />
responsibility to provide<br />
Emergency Action Plans to <strong>the</strong><br />
Leavenworth County Emergency<br />
Management as prescribed by <strong>the</strong><br />
Kansas Department of Agriculture<br />
– Water Resources Division, Chief<br />
Engineer. Additionally, Levee<br />
owners should be contacted<br />
regarding potential PM 43<br />
requirements for continued<br />
validation of protected areas<br />
behind <strong>the</strong> levees. Leavenworth<br />
County has 221 dams in <strong>the</strong><br />
county that are regulated by <strong>the</strong><br />
Kansas Department of Agriculture,<br />
Water Resources Department.<br />
Seven of <strong>the</strong>se structures are<br />
classified as “High Hazard”<br />
structures. These seven dams<br />
should have Emergency Action<br />
Plans on file with emergency<br />
management for <strong>the</strong> protection of<br />
life and property downstream of<br />
<strong>the</strong>se structures. The State<br />
evaluation of <strong>the</strong> dams is based<br />
on location in areas w<strong>here</strong> failure<br />
may cause extensive loss of life,<br />
serious damage to homes,<br />
industrial and commercial<br />
facilities, important public utilities,<br />
main highways or railroads. It is<br />
important to note that a<br />
classification as “High Hazard” is<br />
not necessarily unsafe, as defined<br />
by <strong>the</strong> State of Kansas. An<br />
individual dam or levee hazard<br />
classification is based upon <strong>the</strong><br />
potential consequences of dam<br />
failure and does not reflect <strong>the</strong><br />
physical condition of <strong>the</strong> dam.<br />
Preparing for a potential<br />
emergency is an essential<br />
planning step to secure <strong>the</strong> people<br />
and property downstream from a<br />
potential breach or dam failure.<br />
Approximately 48 levees were<br />
identified in Leavenworth County.<br />
Certifications are unknown at <strong>the</strong><br />
time of this Plan.<br />
Department<br />
Funds: Local<br />
Completion Date: 31 Dec 2017<br />
21 Research and recommend H 1,4 All Hazards On-going Planning Commission, Cost: Unknown<br />
4.66
appropriate building codes for <strong>the</strong><br />
Jurisdiction that includes Wind<br />
resistant design techniques for<br />
new construction. Currently,<br />
Leavenworth County does not<br />
have any building code<br />
requirements. Incorporated and<br />
unincorporated areas of <strong>the</strong><br />
county should adopt and enforce<br />
codes that require certain<br />
minimum building practices and<br />
contractor licensing for wind loss<br />
reduction. Experts agree that<br />
structures built to exceed high<br />
wind provisions have a much<br />
greater chance of surviving violent<br />
windstorms. Additional techniques<br />
include adding protection for<br />
windows (i.e., shutters), anchoring<br />
door frames with multiple hinges,<br />
stiffening garage doors with<br />
additional bracing, reinforcing<br />
masonry chimneys with vertical<br />
steel, and streng<strong>the</strong>ning<br />
connections between walls and<br />
<strong>the</strong> roof with hurricane straps and<br />
ties. These techniques should be<br />
promoted to building contractors<br />
and homebuyers by <strong>the</strong> county for<br />
all new residential construction, to<br />
<strong>the</strong> maximum extent possible<br />
during <strong>the</strong> building permit process.<br />
22 Establish a local reserve fund to<br />
augment <strong>the</strong> Leavenworth County<br />
GIS Department’s<br />
ability to monitor building trends<br />
and erosion patterns across <strong>the</strong><br />
county through frequent aerial<br />
photography. Utilization of GIS<br />
capabilities should be expanded to<br />
include monitoring of county<br />
topography and water erosion<br />
changes a minimum of four times<br />
a year. This frequency will allow<br />
development of additional GIS<br />
layers for future planning, and also<br />
assist in identifying mitigation of<br />
potential problem areas before<br />
<strong>the</strong>y become a major issue for <strong>the</strong><br />
county.<br />
23 Establish a local reserve fund to<br />
develop and support an<br />
Planner, BOCC<br />
Funds: Local<br />
Completion Date: 31 Dec 2017<br />
M 3 Flood Completed County GIS Cost: Unknown<br />
Funds: Local, State, Federal<br />
Completion Date: 31 Dec 2015<br />
M 3 All Hazards Complete<br />
2013<br />
Leavenworth County GIS<br />
Cost: Unknown<br />
Funds: Local, State, Federal<br />
4.67
interactive GIS webpage for <strong>the</strong><br />
general public. Development<br />
and implementation of a county<br />
interactive webpage would<br />
provides real-time GIS data that<br />
will provide an effective training<br />
tool, as well as education<br />
references for home school,<br />
and research activities.<br />
24 The Big Stranger Drainage District<br />
will continue <strong>the</strong> care and<br />
maintenance, including debris<br />
removal, of <strong>the</strong> portion of <strong>the</strong> Big<br />
Stranger Creek that is located<br />
within <strong>the</strong> Drainage District. The<br />
Big Stranger Drainage District<br />
contains 16,730 acres within<br />
Leavenworth County. The general<br />
mission of <strong>the</strong> drainage district is<br />
to see that <strong>the</strong> Big Stranger Creek<br />
is free of of debris on <strong>the</strong> portion<br />
of <strong>the</strong> creek that is located within<br />
<strong>the</strong> Drainage District. The<br />
organization will evaluate <strong>the</strong> need<br />
for fur<strong>the</strong>r maintenance projects,<br />
and additional effort will be made<br />
to seek alternative funding as <strong>the</strong>y<br />
become available.<br />
25 The Leavenworth County<br />
Consolidated Rural Water District<br />
(RWD) No. 1 will continue to<br />
assess <strong>the</strong> impact of natural<br />
hazards on water distribution<br />
lines, systems, and equipment.<br />
The Water District will also seek<br />
funding sources to mitigate<br />
damage to critical infrastructure,<br />
and seek funding for various water<br />
main improvement projects. The<br />
Leavenworth County Consolidated<br />
RWD No. 1 provides potable<br />
water to <strong>the</strong>ir customers in<br />
Leavenworth County. Maintaining<br />
an adequate, quality water supply<br />
to <strong>the</strong>ir customers is <strong>the</strong> district's<br />
top priority.<br />
26 Maintain, repair, and collect<br />
GPS locations of fire hydrants<br />
within <strong>the</strong> Leavenworth County<br />
area served by Leavenworth<br />
County Rural Water District<br />
(RWD) 7. The maintenance and<br />
M 1,2 Dam/Levee, Flood On-going,<br />
Open<br />
Ended<br />
M 1,2 Utility/Infrastructure Failure On-going,<br />
Open<br />
Ended<br />
M 1,2 Wildfire Complete<br />
d 2012<br />
Big Strange Drainage<br />
District<br />
Leavenworth county<br />
Consolidated RWD #1<br />
Leavenworth County<br />
RWD 7<br />
Completion Date: Complete<br />
Cost: Unknown<br />
Funds: Local, State, Federal<br />
Completion Date: Continuous<br />
Cost: Unknown<br />
Funds: Local, State, Federal<br />
Completion Date: Continuous<br />
Cost: Unknown<br />
Funds: Local, State, Federal<br />
Completion Date: Completed<br />
4.68
epair, as well as <strong>the</strong> GPS<br />
mapping of <strong>the</strong> fire hydrant<br />
locations, could benefit<br />
response time of <strong>the</strong> applicable<br />
fire departments serving <strong>the</strong><br />
areas.<br />
27 The Leavenworth County Rural<br />
Water District (RWD) No. 7 will<br />
continue to assess <strong>the</strong> impact of<br />
natural hazards on water<br />
distribution lines, systems, and<br />
equipment. The Water District will<br />
also seek funding sources to<br />
mitigate damage to critical<br />
infrastructure, and seek funding<br />
for various water main<br />
improvement projects. The<br />
Leavenworth County RWD No. 7<br />
provides potable water to <strong>the</strong>ir<br />
customers in Leavenworth<br />
County. Maintaining an adequate,<br />
quality water supply to <strong>the</strong>ir<br />
customers is <strong>the</strong> district's top<br />
priority.<br />
28 Obtain funding for <strong>the</strong> purchase of<br />
mobile backup power generators<br />
for <strong>the</strong> groundwater well facilities<br />
of Leavenworth County Rural<br />
Water District (RWD) 7.<br />
Leavenworth County RWD 7 has<br />
identified a need to quickly restore<br />
power in its groundwater well<br />
facilities in <strong>the</strong> event of a wea<strong>the</strong>r<br />
event and <strong>the</strong> subsequent loss of<br />
power.<br />
29 Suburban Water, Inc. will seek<br />
funding to prepare a written<br />
Emergency Operations Plan to be<br />
used as a resource during <strong>the</strong><br />
initial response to an emergency<br />
event and provide guidance until<br />
all operations affected are back to<br />
normal operation.<br />
30 Suburban Water, Inc. will continue<br />
to assess <strong>the</strong> impact of natural<br />
hazards on its water supplies,<br />
distribution and transmission<br />
systems, storage facilities,<br />
structures and equipment.<br />
Suburban Water, Inc. will also<br />
seek funding sources to mitigate<br />
damage to critical infrastructure,<br />
M 1,2 All Hazards On-going,<br />
Open<br />
Ended<br />
Leavenworth County RWD<br />
7<br />
M 1,2 All hazards On-going Leavenworth County RWD<br />
7<br />
Cost: Unknown<br />
Funds: Local, State, Federal<br />
Completion Date: Continuous<br />
Cost: Unknown<br />
Funds: Local, State, Federal<br />
Completion Date: 31 Dec 2020<br />
M 1,2,4 All Hazards On-going Suburban Water, Inc. Cost: Unknown<br />
Funds: Local, State, Federal<br />
Completion Date: 31 Dec 2015<br />
M 1,2 All Hazards On-going,<br />
Open<br />
Ended<br />
Suburban Water, Inc.<br />
Cost: Unknown<br />
Funds: Local, State, Federal<br />
Completion Date: continuous<br />
4.69
and seek funding for various water<br />
main improvement projects to<br />
enhance reliability of service.<br />
Suburban Water, Inc. provides<br />
potable water to its customers<br />
which are located in sou<strong>the</strong>rn<br />
Leavenworth County. Providing a<br />
safe, reliable, and high quality<br />
water supply to all present and<br />
future customers is Suburban<br />
Water’s top priority.<br />
31 Suburban Water, Inc. will continue<br />
to enhance <strong>the</strong> reliability of its<br />
supervisory control and data<br />
acquisition (SCADA) system used<br />
to monitor <strong>the</strong> supply of water<br />
throughout its distribution system.<br />
Suburban Water, Inc. will also<br />
seek funding sources to fur<strong>the</strong>r<br />
expand <strong>the</strong> capabilities of its<br />
SCADA system. Suburban Water,<br />
Inc. has identified a need to<br />
expand <strong>the</strong> capabilities of its<br />
current SCADA system.<br />
32 Suburban Water, Inc. will continue<br />
to pursue opportunities to<br />
establish interconnections with <strong>the</strong><br />
City of Leavenworth Water<br />
Department, Rural Water District<br />
No. 7 of Leavenworth County, and<br />
Rural Water District No. 9 of<br />
Leavenworth County, to<br />
enhance <strong>the</strong> reliability of <strong>the</strong>ir<br />
water supplies. Suburban Water,<br />
Inc. will also seek funding to<br />
establish <strong>the</strong> interconnections.<br />
Suburban Water, Inc. has<br />
identified a need to establish<br />
interconnections with o<strong>the</strong>r water<br />
suppliers in an attempt to enhance<br />
<strong>the</strong> reliability of <strong>the</strong> water supply in<br />
Leavenworth County.<br />
33 Suburban Water, Inc. will seek<br />
funding to improve <strong>the</strong><br />
reliability of its water supply<br />
from <strong>the</strong> Board of Public Utility<br />
(BPU) of Kansas City, Kansas.<br />
Suburban Water, Inc. has<br />
identified a need to improve <strong>the</strong><br />
reliability of its water supply<br />
through <strong>the</strong> BPU.<br />
M 1,2 All Hazards On-going Suburban Water, Inc. Cost: Unknown<br />
Funds: Local, State, Federal<br />
Completion Date: 31 Dec 2015<br />
M 1,2,4 All Hazards On-going,<br />
Open<br />
Ended<br />
M 1,2,4 All Hazards Complete<br />
d 2012<br />
Suburban Water, Inc.<br />
Suburban Water, Inc.<br />
Cost: Unknown<br />
Funds: Local, State, Federal<br />
Completion Date: Continuous<br />
Cost: Unknown<br />
Funds: Local, State, Federal<br />
Completion Date: Completed<br />
34 Suburban Water, Inc. will seek M 1,2 All Hazards On-going, Suburban Water, Inc. Cost: Unknown<br />
4.70
funding to complete<br />
hydrogeological studies and<br />
investigations for <strong>the</strong> purpose of<br />
seeking to find additional reliable<br />
water sources. Suburban Water,<br />
Inc. has identified a need to find<br />
additional reliable water sources<br />
for its customers in Leavenworth<br />
County.<br />
35 Suburban Water, Inc. will seek<br />
funding to develop and establish<br />
backup electric power supplies at<br />
pumping stations in case of<br />
primary power outages. Suburban<br />
Water, Inc. has identified a need<br />
to quickly restore power in its<br />
pumping stations in <strong>the</strong> event of a<br />
wea<strong>the</strong>r event and <strong>the</strong> subsequent<br />
loss of power.<br />
36 Suburban Water, Inc. will seek<br />
funding to develop a secure and<br />
protected structure at its<br />
headquarters to allow continuous<br />
operations during natural<br />
disasters. Suburban Water, Inc.<br />
identified a need to develop a<br />
secure and protected structure at<br />
its headquarters to allow<br />
continuous operations during<br />
natural disasters.<br />
37 Suburban Water, Inc. will seek<br />
funding to enhance <strong>the</strong> protection<br />
to existing water mains at creek<br />
crossings (flood plains).<br />
Suburban Water, Inc. identified a<br />
need to enhance <strong>the</strong> protection to<br />
existing water mains at creek<br />
crossings that are located within<br />
flood plains.<br />
38 The Leavenworth Water<br />
Department will continue to<br />
assess <strong>the</strong> impact of natural<br />
hazards on water distribution<br />
lines, systems, and equipment.<br />
The Department will also seek<br />
additional funding sources to<br />
mitigate damage to critical<br />
infrastructure. The Leavenworth<br />
Water Department provides<br />
potable water to <strong>the</strong>ir customers<br />
throughout Leavenworth County,<br />
encompassing approximately<br />
Open<br />
Ended<br />
Funds: Local, State, Federal<br />
Completion Date: Continuous<br />
M 1, 2 All Hazards On-going Suburban Water, Inc. Cost: Unknown<br />
Funds: Local, State, Federal<br />
Completion Date: 31 Dec 2015<br />
M 1,2 All Hazards On-going Suburban Water, Inc. Cost: Unknown<br />
Funds: Local, State, Federal<br />
Completion Date: 31 Dec 2015<br />
M 1,2 Flood On-going Suburban Water, Inc Cost: Unknown<br />
Funds: Local, State, Federal<br />
Completion Date: 31 Dec 2015<br />
M 1,2 All Hazards On-going,<br />
Open<br />
Ended<br />
Leavenworth Water<br />
Department, Leavenworth<br />
County<br />
Cost: Unknown<br />
Funds: Local, State, Federal<br />
Completion Date: Continuous<br />
4.71
55,000 residents. The<br />
Department's facilities also<br />
includes approximately 180 miles<br />
of water transmission and<br />
distribution lines, pumping<br />
stations, well field, and five million<br />
gallons of potable water storage.<br />
39 Coordinate county and local<br />
government mitigation efforts with<br />
Rural Electric Cooperatives<br />
(REC’s), encourage identification<br />
of hazards potentially affecting<br />
<strong>the</strong>ir infrastructure, assessment of<br />
<strong>the</strong> vulnerabilities of <strong>the</strong><br />
infrastructure to <strong>the</strong>se hazards,<br />
and identification of mitigation<br />
strategies. Long-term planning<br />
goals that will reduce exposure to<br />
loss of electrical power are<br />
beneficial to all organizations and<br />
citizens within <strong>the</strong> jurisdiction.<br />
Power loss during extreme<br />
periods of cold or heat increase<br />
damage potential to people and<br />
property.<br />
M 1,2,4 Utility/Infrastructure Failure On-going City, county Planners,<br />
RECs<br />
Cost: Unknown<br />
Funds: NA<br />
Completion Date: 31 Dec 2017<br />
Leavenworth County – City of Basehor<br />
Action ID Action/Description Priority Goal(s)<br />
Hazard Addressed Status Responsible Entity Estimated Cost and funding Source<br />
Addressed<br />
1 Identify flash-flood prone areas to<br />
consider flood reduction measures<br />
to city/county planners. Flood<br />
zone mapping has provided initial<br />
identification of potential hazard<br />
areas that can be <strong>review</strong>ed with<br />
o<strong>the</strong>r data sources, such as <strong>the</strong><br />
watershed districts goals and<br />
objectives, in developing long<br />
range planning activities for flood<br />
prevention, or o<strong>the</strong>r planning<br />
steps to reduce exposure to this<br />
hazard.<br />
L 1,2 Flood On-going,<br />
2 major<br />
flash flood<br />
prone<br />
areas<br />
identified<br />
(1 has<br />
been<br />
corrected)<br />
Floodplain Manager, City<br />
Planner, City<br />
Superintendent Public<br />
Works<br />
Cost: NA<br />
Funds: Local<br />
Completion Date: 31 Dec 2018<br />
2 Incorporate <strong>the</strong> inspection and<br />
management of trees into <strong>the</strong> city<br />
maintenance program that may<br />
pose a threat to <strong>the</strong> electrical lines<br />
that could result in power outages<br />
during ice storms. Significant<br />
M 1,2 Winter Storm, Wind Storms On-going,<br />
Open<br />
Ended<br />
City Superintendent, Codes<br />
Enforcement Officer<br />
Cost: NA<br />
Funds: Local, State, Federal<br />
Completion Date: continuous<br />
4.72
amounts of property damage<br />
occur during ice storms that<br />
result from tree failure. Trees that<br />
fall into utility lines have additional<br />
serious consequences such as<br />
causing power outages, surges,<br />
fires and o<strong>the</strong>r damage. The<br />
jurisdiction’s ability to recognize<br />
and prevent hazardous tree<br />
conditions (through inspection,<br />
pruning or removal) is <strong>the</strong> best<br />
defense against problems and<br />
costly damages resulting from tree<br />
failure. Specifically, trees located<br />
on jurisdictional property, which<br />
pose immediate threats to<br />
property, utility lines and o<strong>the</strong>r<br />
critical facilities should be<br />
addressed.<br />
3 Determine <strong>the</strong> efficacy of <strong>the</strong><br />
existing generators located within<br />
Critical Facility structures,<br />
including <strong>the</strong> City Hall / Police<br />
Department, and consider funding<br />
options for any Critical Facilities<br />
that may require generators<br />
and/or transfer switches to<br />
maintain power in <strong>the</strong> event of<br />
severe wea<strong>the</strong>r events. Ensure<br />
that Critical Facilities located<br />
within <strong>the</strong> City of Basehor<br />
maintain power during severe<br />
wea<strong>the</strong>r events.<br />
4 Seek funding to retain an engineer<br />
to design a safe room within <strong>the</strong><br />
City of Basehor City Hall / Police<br />
Department and apply for grant<br />
funding for construction of <strong>the</strong> safe<br />
room within <strong>the</strong> new facility when<br />
constructed. A lack of safe rooms<br />
poses a serious risk to <strong>the</strong><br />
community. The City of Basehor<br />
has identified a need for a safe<br />
room within <strong>the</strong> Basehor City<br />
(new) City Hall / Police<br />
Department when constructed.<br />
5 Develop a radio communications<br />
plan between <strong>the</strong> City of Basehor<br />
Public Works<br />
Department / Street Department<br />
and City Hall to ensure<br />
H 2 All Hazards On-going City Superintendent, Cost: Unknown<br />
Funds: Local, State, Federal<br />
Completion Date: 31 Dec 2018<br />
L 1,2 Tornado, Windstorm On-going,<br />
New<br />
concrete<br />
encased<br />
vault – no<br />
fema rating<br />
or fema<br />
rated door<br />
M 4 All Hazards Ongoing/Conti<br />
nuous<br />
City Engineer, Planner<br />
City Administrator, Chief of<br />
Police, City Superintendent<br />
Cost: Unknown<br />
Funds: Local, State, Federal<br />
Completion Date: 31 Dec 2018<br />
Cost: Unknown<br />
Funds: Local, State, Federal<br />
Completion Date: Continuous<br />
4.73
interoperability between entities.<br />
The communications plan should<br />
address equipment compatibility<br />
and upgrade requirements to<br />
implement <strong>the</strong> plan. The City of<br />
Basehor has identified a need to<br />
implement interoperable radio<br />
communications between <strong>the</strong><br />
Public Works Department / Street<br />
Department and City Hall.<br />
6 Seek funding options for <strong>the</strong><br />
purchase of a brine applicator and<br />
mixer to apply chemicals to roads<br />
within <strong>the</strong> City of Basehor prior to<br />
major winter storm events,<br />
including ice storms. The City of<br />
Basehor has identified a need for<br />
a brine applicator and mixer to<br />
assist in maintain safe roads<br />
within <strong>the</strong> city during major winter<br />
storm events.<br />
7 Seek funding options for <strong>the</strong><br />
purchase of equipment to assist in<br />
<strong>the</strong> removal of debris and assist<br />
with cleanups after major storms.<br />
The City of Basehor has identified<br />
<strong>the</strong> need for equipment to be<br />
utilized in <strong>the</strong> removal of debris<br />
and cleanup after major storms<br />
within <strong>the</strong> city limits. Equipment<br />
needed includes a Case 580<br />
Super M Series 3 4x4 extended<br />
backhoe with grapple bucket; a<br />
Polaris Ranger 800 HD utility<br />
vehicle; and a 2010 F-450 Ford<br />
4x4 diesel truck with dump bed.<br />
2014 F-550 Ford 4.4 diesel truck<br />
with dump bed.<br />
L 1,2 All Hazards On-going,<br />
currently<br />
have 3<br />
salt/sand<br />
spreaders<br />
in use – no<br />
brine app.<br />
City Superintendent<br />
Cost: Unknown<br />
Funds: Local, State, Federal<br />
Completion Date: 31 Dec 2018<br />
M 1,2 All Hazards On-going City Superentendent Cost: Unknown<br />
Funds: Local, State, Federal<br />
Completion Date: 31 Dec 2018<br />
Action ID Action/Description Priority Goal(s)<br />
Addressed<br />
1 Identify flash-flood prone areas to<br />
consider flood reduction measures<br />
to city officials / county planners.<br />
Flood zone mapping has provided<br />
initial identification of potential<br />
hazard areas that can be <strong>review</strong>ed<br />
with o<strong>the</strong>r data sources, such as<br />
Leavenworth County – City of Easton<br />
Hazard Addressed Status Responsible Entity Estimated Cost and funding Source<br />
H 1,2 Flood On-going City of Easton Cost: Unknown<br />
Funds: Local<br />
Completion Date: 31 Dec 2015<br />
4.74
<strong>the</strong> watershed districts goals and<br />
objectives, in developing long<br />
range planning activities for flood<br />
prevention, or o<strong>the</strong>r planning<br />
steps to reduce exposure to this<br />
hazard.<br />
2 Seek funding to raise <strong>the</strong> casings<br />
around <strong>the</strong> potable water wells<br />
utilized by <strong>the</strong> City of Easton to<br />
protect <strong>the</strong>m from flood water<br />
contamination. The City of Easton<br />
has historically experienced<br />
flooding events that have, on<br />
occasion, resulted in potable<br />
water contamination due to flood<br />
waters impacting <strong>the</strong> water wells<br />
utilized by <strong>the</strong> City of Easton.<br />
3 Consider funding options for <strong>the</strong><br />
purchase and installation of a<br />
backup generator for <strong>the</strong> City of<br />
Easton Water Treatment Plant in<br />
<strong>the</strong> event of severe wea<strong>the</strong>r<br />
events. The City of Easton has<br />
identified a need to ensure that<br />
<strong>the</strong> Water Treatment Plant in<br />
Easton maintain power during<br />
severe wea<strong>the</strong>r events, to ensure<br />
<strong>the</strong> quality of <strong>the</strong> water supplied to<br />
<strong>the</strong> city.<br />
4 Consider funding options for <strong>the</strong><br />
purchase and installation of<br />
control valves for <strong>the</strong> City of<br />
Easton Water Treatment Plant<br />
and storage facility in <strong>the</strong> event of<br />
flooding events. The City of<br />
Easton has identified a need to<br />
protect <strong>the</strong> potable water supply<br />
system from flooding events<br />
between <strong>the</strong> city water treatment<br />
plant and storage facility. T<strong>here</strong> is<br />
a concern of contaminates from<br />
flooding resting in <strong>the</strong> supply line.<br />
5 Reduce danger and damage from<br />
repetitive flooding events, as well<br />
as allowing possible annexation of<br />
<strong>the</strong> City of Easton, by developing<br />
a program to acquire residential<br />
and commercial properties in<br />
coordination with FEMA<br />
acquisition programs. T<strong>here</strong> has<br />
been a history of repetitive<br />
flooding of residential and<br />
M 1,2 Flood On-going City of Easton Cost: Unknown<br />
Funds: Local, State, Federal<br />
Completion Date: continuous<br />
H 1,2 All Hazards On-going City of Easton Cost: Unknown<br />
Funds: Local, State, Federal<br />
Completion Date: 31 Dec 2015<br />
M 1,2 Flood On-going City of Easton Cost: Unknown<br />
Funds: Local, State, Federal<br />
Completion Date: 31 Dec 2015<br />
M 1,2 Flood On-going City of Easton Cost: Unknown<br />
Funds: Local, State, Federal<br />
Completion Date: 31 Dec 2015<br />
4.75
commercial buildings in <strong>the</strong> City of<br />
Easton. Flooding events occur in<br />
<strong>the</strong> area due to a sustained<br />
duration of high-intensity rainfall<br />
and to elevated water levels of <strong>the</strong><br />
Stranger Creek and Dawson<br />
Creek . This has caused<br />
significant danger to both<br />
residents and emergency<br />
personnel, as well as<br />
damage to homes and<br />
businesses. T<strong>here</strong> are 17<br />
structures identified on<br />
<strong>the</strong> Repetitive Loss Properties list<br />
for <strong>the</strong> City of Easton and are<br />
reported to have flood insurance.<br />
Two of <strong>the</strong> structures were<br />
identified as having been<br />
mitigated. In total, 28 residents of<br />
<strong>the</strong> City of Easton have flood<br />
insurance with coverage of<br />
$3,550,000. The City of Easton<br />
has had 111 claims since 1978<br />
totaling $1,461,919.<br />
6 Seek funding to retain an engineer<br />
to design community tornado<br />
shelters and apply for grant<br />
funding for construction. A lack of<br />
tornado shelters poses a serious<br />
risk to <strong>the</strong> safety of <strong>the</strong><br />
community. The City of Easton<br />
has identified a need for<br />
Community Storm Shelters.<br />
7 Conduct an engineering study, in<br />
association with <strong>the</strong> State of<br />
Kansas, to examine <strong>the</strong> feasibility<br />
of raising <strong>the</strong> State highway 300<br />
yards east of First Street to <strong>the</strong><br />
twin bridges over Stranger Creek.<br />
The City of Easton has historically<br />
experienced flooding events, often<br />
resulting in <strong>the</strong> flooding of <strong>the</strong><br />
State Highway leading in and out<br />
of <strong>the</strong> city, leaving residents and<br />
commercial without an egress to<br />
<strong>the</strong> city, resulting in economic loss<br />
to <strong>the</strong> community. The relocation<br />
of <strong>the</strong> State Highway to <strong>the</strong> twin<br />
bridges over Stranger Creek<br />
would allow residents and<br />
commercial commodities to travel<br />
through <strong>the</strong> community during<br />
M 1,2 Tornado, Windstorm On-going City of Easton Cost: Unknown<br />
Funds: Local, State, Federal<br />
Completion Date: 31 Dec 2015<br />
M 1,2 Flood On-going City of Easton Cost: Unknown<br />
Funds: Local, State, Federal<br />
Completion Date: 31 Dec 2015<br />
4.76
flooding events.<br />
Action ID Action/Description Priority Goal(s)<br />
Addressed<br />
1 Identify flash-flood prone areas to<br />
consider flood reduction measures to<br />
city planners. Flood zone mapping<br />
has provided initial identification of<br />
potential hazard areas that can be<br />
<strong>review</strong>ed with o<strong>the</strong>r data sources,<br />
such as <strong>the</strong> watershed districts goals<br />
and objectives, in developing long<br />
range planning activities for flood<br />
prevention, or o<strong>the</strong>r planning steps to<br />
reduce exposure to this hazard.<br />
2 Research funding options to<br />
construct storm shelters for existing<br />
mobile home parks in <strong>the</strong> City of<br />
Lansing that currently do not have<br />
storm shelters or have inadequate<br />
storm shelters. Mobile homes are<br />
particularly vulnerable to damage<br />
from high winds. Residents, even<br />
those who live in mobile homes with<br />
tie-downs, should seek safe shelter<br />
when a tornado threatens. Tornado<br />
shelters should be constructed in<br />
major mobile home parks to ensure a<br />
safe place for residents to go during<br />
a tornado event. The shelter<br />
structure, which should be designed<br />
to withstand a minimum of 120mph<br />
winds, could easily serve an<br />
alternate purpose such as a<br />
community center, laundry facility,<br />
etc. Tornado shelters should be for<br />
last minute protection for high wind<br />
events. Mobile Home Courts that<br />
currently do not have storm shelters<br />
or have inadequate storm shelters<br />
were identified as Wiley Mobile<br />
Home Court, Clear Creek Court,<br />
Black’s Mobile Home Court, and<br />
Parkwood Court Manufactured Home<br />
Court.<br />
Leavenworth County – City of Lansing<br />
Hazard Addressed Status Responsible Entity Estimated Cost and funding Source<br />
H 1,2 Flood Delayed<br />
due to staff<br />
reductions<br />
H 1,2 Tornado, Windstorms Delayed<br />
due to staff<br />
reductions.<br />
Public Works Director Cost: $20,000<br />
Funds: Local/Grant<br />
Completion Date: 3 years<br />
Community Development<br />
Superintendent<br />
Cost: $783,153<br />
Funds: Local, State, Federal<br />
Completion Date: 6 years<br />
4.77
3 Develop and fund professional<br />
services to augment <strong>the</strong> City of<br />
Lansing's GIS capability to provide<br />
condition investigation, analysis of<br />
streamways, develop stream buffer<br />
mapping, provide updated 2 ft.<br />
interval hypsography for <strong>the</strong> entire<br />
Lansing growth area to allow for<br />
improved storm water modeling and<br />
management, draft a stream buffer<br />
zoning ordinance for <strong>the</strong> city,<br />
produce digital 2 ft. contour mapping<br />
for use in storm water analysis and<br />
planning, and develop interactive<br />
floodplain and property parcel GIS<br />
application and database for use by<br />
city staff. Utilization of GIS<br />
capabilities should be expanded to<br />
include <strong>the</strong> use of ArcInfo and<br />
AutoCad format for various floodrelated<br />
projects throughout <strong>the</strong> City<br />
of Lansing and <strong>the</strong> Lansing Growth<br />
Area.<br />
4 Conduct engineering studies for<br />
design and construction of levees to<br />
protect several areas within <strong>the</strong><br />
Lansing city limits from flooding<br />
events. The City of Lansing has<br />
identified a need for <strong>the</strong> construction<br />
of levees to protect <strong>the</strong> Rock Creek<br />
West/Rock Creek West #5<br />
neighborhood and <strong>the</strong> Fawn Valley<br />
Replat neighborhood from flooding<br />
events.<br />
5 Conduct engineering studies for <strong>the</strong><br />
design and reconstruction of an<br />
engineered storm water channel<br />
within <strong>the</strong> city limits of Lansing. The<br />
City of Lansing has identified <strong>the</strong><br />
need for design and reconstruction<br />
of <strong>the</strong> engineered storm water<br />
channel located in <strong>the</strong> Holiday Hills<br />
neighborhood.<br />
6 Research and fund engineering<br />
services for a city-wide storm water<br />
infrastructure-needs assessment.<br />
The City of Lansing has identified <strong>the</strong><br />
need for professional services to<br />
perform a storm water infrastructure<br />
needs assessment throughout <strong>the</strong><br />
City of Lansing.<br />
M 1,2 Flood Delayed<br />
due to lack<br />
of funding<br />
and staff<br />
reductions.<br />
M 1,2 Flood On-going,<br />
Delayed<br />
due to lack<br />
of local<br />
funding<br />
and staff<br />
reductions<br />
H 1,2 Flood On-going,<br />
Delayed<br />
due to lack<br />
of local<br />
funding<br />
and staff<br />
reductions<br />
Public Works Director Cost: $40,000<br />
Funds: Local, State, Federal<br />
Completion Date: 2 years.<br />
Public Works Director Cost: $275,000<br />
Funds: Local, State, Federal<br />
Completion Date: 6 months<br />
Public Works Director Cost: $250,000<br />
Funds: Local, Grant<br />
Completion Date: 3<br />
H 1,2 Flood On-going Public Works Director Cost: $150,000<br />
Funds: Local, Grant<br />
Completion Date: 31 Dec 2015<br />
7 Research funding options for M 1,2 Flood On-going, Public Works Director Cost: $200,000<br />
4.78
professional services and<br />
construction of stream bank<br />
stablization on Nine Mile Creek and<br />
Seven Mile Creek within <strong>the</strong> city<br />
limits of Lansing. The City of<br />
Lansing has identified a need for<br />
professional services and<br />
construction for stream bank<br />
stabilization at various location on<br />
Nine Mile Creek and Seven Mile<br />
Creek w<strong>here</strong> bank erosion threatens<br />
public utilities or private<br />
improvements.<br />
8 Seek contractors proposal to perform<br />
maintenance activities along Nine<br />
Mile Creek and Seven Mile Creek<br />
within <strong>the</strong> city limits of Lansing. The<br />
City of Lansing has identified a need<br />
for contractor removal or deadfall<br />
and/or log jams from Nine Mile Creek<br />
and Seven Mile Creek within <strong>the</strong> city<br />
limits of Lansing.<br />
9 Seek contractors proposal to perform<br />
storm water quality monitoring in <strong>the</strong><br />
City of Lansing. The City of Lansing<br />
has identified a need to have a<br />
contractor perform storm water<br />
quality monitoring on a routine basis<br />
within <strong>the</strong> City of Lansing.<br />
Delayed<br />
due to lack<br />
of local<br />
funding<br />
and staff<br />
reductions.<br />
Funds: Local, Grant<br />
Completion Date: 6<br />
M 1,2 Flood On-going Public Works Director Cost: Unknown<br />
Funds: Local, State, Federal<br />
Completion Date: 31 Dec 2015<br />
M 1,2 Flood On-going,<br />
delayed<br />
due to lack<br />
of funding<br />
and staff<br />
reductions<br />
Public Works Director<br />
Cost: Unknown<br />
Funds: Local, State, Federal<br />
Completion Date: 31 Dec 2014<br />
Leavenworth County – City of Leavenworth<br />
Action ID Action/Description Priority Goal(s)<br />
Hazard Addressed Status Responsible Entity Estimated Cost and funding Source<br />
Addressed<br />
1 Identify flash-flood prone areas to<br />
consider flood reduction measures to<br />
city planners. Flood zone mapping<br />
has provided initial identification of<br />
potential hazard areas that can be<br />
<strong>review</strong>ed with o<strong>the</strong>r data sources,<br />
such as <strong>the</strong>watershed districts goals<br />
and objectives, in developing long<br />
range planning activities for flood<br />
prevention, or o<strong>the</strong>r planning steps to<br />
reduce exposure to this hazard.<br />
H 1,2 Flood On-going City Planner, Floodplain<br />
Manager, Public Works<br />
Director<br />
Cost: Unknown<br />
Funds: Local<br />
Completion Date: 31 Dec 2015<br />
2 Reduce danger and damage from<br />
repetitive flooding events by<br />
developing a program to acquire<br />
residential and commercial<br />
M 1,2 Flood On-going City of Leavenworth Cost: Unknown<br />
Funds: Local, State, Federal<br />
Completion Date: continuous<br />
4.79
properties in coordination with FEMA<br />
acquisition programs. T<strong>here</strong> has<br />
been a history of repetitive flooding<br />
of residential and commercial<br />
buildings in several locations in <strong>the</strong><br />
City of Leavenworth. Flooding events<br />
occur in <strong>the</strong>se areas due to a<br />
sustained duration of High intensity<br />
rainfall and to elevated water levels<br />
of <strong>the</strong> Missouri River,<br />
Three Mile Creek, and a tributary of<br />
Five Mile Creek. This has caused<br />
significant danger to both residents<br />
and emergency personnel, as well as<br />
damage to homes and businesses.<br />
Flooding in <strong>the</strong>se areas is related to<br />
sustained duration of high intensity<br />
rainfall as well as high water in <strong>the</strong><br />
Missouri River. These residential and<br />
commercial properties were flooded<br />
in 1985, 1993, 1998, and 2005, as<br />
well as 13 additional historic flood<br />
events. The City of Leavenworth has<br />
identified <strong>the</strong>se properties as<br />
35 residential structures, at an<br />
estimated acquisition cost of<br />
$2,450,220, and 22 commercial<br />
structures, at an estimated<br />
acquisition cost of $2,007,570. One<br />
residential structure and one<br />
commercial structure appear on <strong>the</strong><br />
Repetitive Loss Properties list for <strong>the</strong><br />
City of Leavenworth and are reported<br />
to have flood insurance; <strong>the</strong><br />
remaining structures targeted for<br />
acquisition activities by <strong>the</strong> City of<br />
Leavenworth do not appear to have<br />
flood insurance and do not appear<br />
on <strong>the</strong> Repetitive Loss<br />
Properties list for <strong>the</strong> City of<br />
Leavenworth.<br />
3 Seek funding to purchase a portable<br />
dam system to reduce exposure from<br />
flooding to <strong>the</strong> Leavenworth<br />
Community Center. The<br />
Leavenworth Community Center,<br />
located at 123 South Esplanade, is<br />
listed on <strong>the</strong> National Register of<br />
Historic Places, and is a focal point<br />
of social and community activity in<br />
<strong>the</strong> City. Flooding events are<br />
attributed to elevated water levels of<br />
M 1,2 Flood On-going,<br />
appealing<br />
project<br />
denial by<br />
FEMA<br />
City of Leavenworth<br />
Cost: Unknown<br />
Funds: Local, State, Federal<br />
Completion Date: 31 Dec 2015<br />
4.80
<strong>the</strong> Missouri River. The building was<br />
flooded in 1951; was protected from<br />
flooding in 1993 by a large sandbag<br />
wall; and protected by a rented<br />
portable dam system in 2007. Given<br />
its location and flood history, it is<br />
expected to be threatened by<br />
flooding in <strong>the</strong> future. Flooding of this<br />
building will damage a historic<br />
structure and repair costs are<br />
expected to be significant.<br />
4 Seek funding to purchase a portable<br />
dam system to reduce exposure from<br />
flooding to <strong>the</strong> City of Leavenworth<br />
Wastewater Treatment Plant. The<br />
City of Leavenworth Wastewater<br />
Treatment Plant, located on South<br />
2nd Street, suffers flooding events<br />
primarily related to <strong>the</strong> elevation of<br />
<strong>the</strong> Missouri River. It is also subject<br />
to flooding if a high-intensity event<br />
occurs in <strong>the</strong> Five Mile Creek<br />
drainage basin while <strong>the</strong> Missouri<br />
River elevations are up. The facility<br />
suffered extensive flood damage in<br />
1993. The facility was expected to be<br />
flooded in 2007 and was protected<br />
by a sandbag wall. Flood damage to<br />
<strong>the</strong> facility causes untreated<br />
wastewater to be discharged to <strong>the</strong><br />
Missouri River; repair costs are<br />
estimated to be significant.<br />
5 Seek funding to construct a new City<br />
of Leavenworth Animal Control<br />
Shelter Building to replace <strong>the</strong><br />
existing structure which is<br />
susceptible to repeated flooding<br />
events. The City of Leavenworth<br />
Animal Control Shelter Building,<br />
located on South 2nd Street, suffers<br />
flooding events primarily related to<br />
<strong>the</strong> elevation of <strong>the</strong> Missouri River. It<br />
is also subject to flooding if a High<br />
intensity event occurs in <strong>the</strong> Five<br />
Mile Creek drainage basin while<br />
<strong>the</strong> Missouri River elevations are up.<br />
The facility suffered extensive flood<br />
damage in 1993. The facility was<br />
predicted to be flooded in 2007 and<br />
was protected by a sandbag wall.<br />
Damage to <strong>the</strong> Animal Control<br />
building causes significant disruption<br />
M 1,2 Flood On-going City of Leavenworth Cost: Unknown<br />
Funds: Local, State, Federal<br />
Completion Date: 31 Dec 2015<br />
L 1,2 Flood On-going City of Leavenworth Cost: Unknown<br />
Funds: Local, State, Federal<br />
Completion Date: 31 Dec 2014<br />
4.81
of service for animal control activities<br />
in Leavenworth and Leavenworth<br />
County. This facility serves as an<br />
animal shelter and alternative<br />
housing for <strong>the</strong> animals, who must<br />
be relocated each time it is<br />
threatened with flooding.<br />
Leavenworth County – City of Linwood<br />
Action ID Action/Description Priority Goal(s)<br />
Hazard Addressed Status Responsible Entity Estimated Cost and funding Source<br />
Addressed<br />
1 Identify flash-flood prone areas to<br />
consider flood reduction measures to<br />
city planners. Flood zone mapping<br />
has provided initial identification of<br />
potential hazard areas that can be<br />
<strong>review</strong>ed with o<strong>the</strong>r data sources,<br />
such as <strong>the</strong> watershed districts goals<br />
and objectives, in developing long<br />
range planning activities for flood<br />
prevention, or o<strong>the</strong>r planning steps to<br />
reduce exposure to this hazard.<br />
H 1,2 Flood On-going Planning Board<br />
Commissioner<br />
Cost: Unknown<br />
Funds: Local<br />
Completion Date: 31 Dec 2015<br />
2 Conduct a study to determine <strong>the</strong><br />
efficacy of <strong>the</strong> existing warning siren<br />
system within <strong>the</strong> Jurisdiction, and<br />
repair and install new sirens as<br />
needed to ensure area coverage.<br />
Reduce <strong>the</strong> possibility of damages<br />
and loss of life to <strong>the</strong> citizens by<br />
maintaining and upgrading <strong>the</strong> early<br />
warning system for <strong>the</strong> City of<br />
Linwood.<br />
M 1,2 Tornado On-going Directors of Emergency<br />
Management in<br />
Leavenworth County<br />
Cost: Unknown<br />
Funds: Local, State, Federal<br />
Completion Date: 31 Dec 2015<br />
Leavenworth County – City of Tonganoxie<br />
Action ID Action/Description Priority Goal(s)<br />
Hazard Addressed Status Responsible Entity Estimated Cost and funding Source<br />
Addressed<br />
1 Identify flash-flood prone areas to<br />
consider flood reduction measures to<br />
city planners. Flood zone mapping<br />
has provided initial identification of<br />
potential hazard areas that can be<br />
<strong>review</strong>ed with o<strong>the</strong>r data sources,<br />
H 1,2 Flood On-going City Planning Committee,<br />
Floodplain Manager, City<br />
Engineer<br />
Cost: $100,000<br />
Funds: Local<br />
Completion Date: 31 Dec 2015<br />
4.82
such as <strong>the</strong> watershed districts goals<br />
and objectives, in developing long<br />
range planning activities for flood<br />
prevention, or o<strong>the</strong>r planning steps to<br />
reduce exposure to this hazard.<br />
2 Develop and fund professional<br />
services to augment <strong>the</strong> City of<br />
Tonganoxie's GIS capability to<br />
provide condition investigation,<br />
analysis of streamways, develop<br />
stream buffer mapping, provide<br />
updated 2 ft. interval hypsography for<br />
<strong>the</strong> entire Tonganoxie growth area to<br />
allow for improved storm water<br />
modeling and management, draft a<br />
stream buffer zoning ordinance for<br />
<strong>the</strong> city, produce digital 2 ft. contour<br />
mapping for use in storm water<br />
analysis and planning, and develop<br />
interactive floodplain and property<br />
parcel GIS application and database<br />
for use by city staff. Utilization of<br />
GIS capabilities should be expanded<br />
to include <strong>the</strong> use of ArcInfo and<br />
AutoCad format for various floodrelated<br />
projects throughout <strong>the</strong> City<br />
of Tonganoxie and <strong>the</strong> Tonganoxie<br />
Growth Area.<br />
3 Research funding options for<br />
professional services and<br />
construction of stream bank<br />
stablization on Tonganoxie Creek<br />
within <strong>the</strong> city limits of Tonganoxie.<br />
The City of Tonganoxie has identified<br />
a need for professional services and<br />
construction for stream bank<br />
stabilization at various locations on<br />
Tonganoxie Creek w<strong>here</strong> bank<br />
erosion threatens public utilities or<br />
private improvements.<br />
4 Research and fund engineering<br />
services for a city-wide storm water<br />
infrastructure-needs assessment.<br />
The City of Tonganoxie has identified<br />
<strong>the</strong> need for professional services<br />
to perform a storm water<br />
infrastructure needs assessment<br />
throughout <strong>the</strong> City of Tonganoxie.<br />
5 Seek contractors proposal to perform<br />
maintenance activities along<br />
Tonganoxie Creek within <strong>the</strong> city<br />
limits of Tonganoxie. The City of<br />
M 1,2 Flood On-going City of Tonganoxie Planner,<br />
City Engineer<br />
M 1,2 Flood On-going City of Tonganoxie, City<br />
Engineer<br />
M 1,2 Flood On-going City of Tonganoxie<br />
Engineer<br />
M 1,2 Flood On-going City of Tonganoxie, City<br />
Engineer<br />
Cost: 65,000<br />
Funds: Local, State, Federal<br />
Completion Date: 31 Dec 2015<br />
Cost: $25,000<br />
Funds: Local, State, Federal<br />
Completion Date: 31 Dec 2015<br />
Cost: $25,000<br />
Funds: Local, State, Federal<br />
Completion Date: 31 Dec 2015<br />
Cost: $15,000<br />
Funds: Local, State, Federal<br />
Completion Date: 31 Dec 2015<br />
4.83
Tonganoxie has identified a need for<br />
contractor removal or deadfall and/or<br />
log jams from Tonganoxie Creek<br />
within <strong>the</strong> city limits of Tonganoxie.<br />
6 Seek contractors proposal to perform<br />
storm water quality monitoring in <strong>the</strong><br />
City of Tonganoxie. The City of<br />
Tonganoxie has identified a need to<br />
have a contractor perform storm<br />
water quality monitoring on a routine<br />
basis within <strong>the</strong> City of Tonganoxie.<br />
7 Incorporate <strong>the</strong> inspection and<br />
management of trees into <strong>the</strong> city<br />
maintenance program that may pose<br />
a threat to <strong>the</strong> electrical lines that<br />
could result in power outages during<br />
ice storms. Significant amounts of<br />
property damage occur during ice<br />
storms that result from tree failure.<br />
Trees that fall into utility lines have<br />
additional serious consequences<br />
such as causing power outages,<br />
surges, fires and o<strong>the</strong>r damage. The<br />
jurisdiction’s ability to recognize and<br />
prevent hazardous tree conditions<br />
(through inspection, pruning or<br />
removal) is <strong>the</strong> best defense against<br />
problems and costly damages<br />
resulting from tree failure.<br />
Specifically, trees located on<br />
jurisdictional property, which pose<br />
immediate threats to property, utility<br />
lines and o<strong>the</strong>r critical facilities<br />
should be addressed.<br />
8 Conduct a study to determine <strong>the</strong><br />
efficacy of <strong>the</strong> existing warning siren<br />
system within <strong>the</strong> Jurisdiction, and<br />
repair and install new sirens as<br />
needed to ensure area coverage.<br />
Reduce <strong>the</strong> possibility of damages<br />
and loss of life to <strong>the</strong> citizens by<br />
maintaining and upgrading <strong>the</strong> early<br />
warning system for <strong>the</strong> City of<br />
Tonganoxie.<br />
9 Create a working group to assess<br />
<strong>the</strong> county’s firefighting / EMS<br />
resources to identify any existing<br />
needs or shortfalls in terms of<br />
personnel, equipment or additional<br />
required resources. A survey should<br />
be completed in order to verify <strong>the</strong><br />
county’s current firefighting / EMS<br />
M 1,2 Flood On-going, City of Tonganoxie<br />
Engineer<br />
M 1,2 Ice Storm On-going,<br />
Open<br />
Ended<br />
City of Tonganoxie and<br />
Local Utility Companies<br />
Cost: Unknown<br />
Funds: Local, State, Federal<br />
Completion Date: 31 Dec 2015<br />
Cost: Unknown<br />
Funds: Local, State, Federal<br />
Completion Date: Continuous<br />
M 1,2 Tornado On-going Leavenworth County Cost: Unknown<br />
Funds: Local<br />
Completion Date: 15 Dec 2015<br />
M 4 All Hazards On-going City of Tonganoxie Fire<br />
Chief, EMS<br />
Cost: $30,000<br />
Funds: Local, State, Federal<br />
Completion Date: 31 Dec 2015<br />
4.84
esources are adequate for public<br />
safety. Any identified needs or<br />
shortfalls should become<br />
documented and result in specific<br />
recommendations to <strong>the</strong> County<br />
Commission for firefighting<br />
enhancements.<br />
10 Seek funding to retain an engineer to<br />
design a safe room within <strong>the</strong> City of<br />
Tonganoxie City Hall or Fire Station<br />
and apply for grant funding for<br />
construction. A lack of tornado<br />
shelters poses a serious risk to <strong>the</strong><br />
community, including City of<br />
Tonganoxie employees. The City of<br />
Tonganoxie has identified a need for<br />
a safe room within <strong>the</strong> existing<br />
Tonganoxie City Hall or Fire Station.<br />
M 1,2 Tornado, Windstorm On-going City of Tonganoxie Fire<br />
Chief/Work Group<br />
Cost: $5,000,000<br />
Funds: Local, State, Federal<br />
Completion Date: 31 Dec 2015<br />
Leavenworth County – University of St. Mary<br />
Action ID Action/Description Priority Goal(s)<br />
Hazard Addressed Status Responsible Entity Estimated Cost and funding Source<br />
Addressed<br />
1 Incorporate <strong>the</strong> inspection and<br />
management of trees into <strong>the</strong><br />
University's routine maintenance<br />
process to remove trees that may<br />
increase <strong>the</strong> risk of power failure<br />
throughout <strong>the</strong> campus<br />
infrastructure. A significant amount<br />
of property damage during high wind<br />
events and o<strong>the</strong>r wea<strong>the</strong>r events<br />
results from tree failure. Trees that<br />
fall into utility lines have additional<br />
serious consequences such as<br />
causing power outages, surges, fires<br />
and o<strong>the</strong>r damage. The jurisdiction’s<br />
ability to recognize and prevent<br />
hazardous tree conditions (through<br />
inspection, pruning or removal) is <strong>the</strong><br />
best defense against problems and<br />
costly damages resulting from tree<br />
failure. Specifically, trees located on<br />
University property, which pose<br />
immediate threats to property, utility<br />
lines or critical facilities should be<br />
addressed.<br />
M 1,2 Utility/Infrastructure Failure On-going,<br />
Open<br />
Ended<br />
University of St. Mary Cost: Unknown<br />
Funds: Local<br />
Completion Date: Continuous<br />
2 Appoint a committee to develop a<br />
radio communications plan between<br />
campus security units and outside<br />
agencies of Leavenworth County and<br />
<strong>the</strong> City of Leavenworth to ensure<br />
M 4 All Hazards On-going University of St. Mary, City<br />
of Leavenworth,<br />
Leavenworth County<br />
Cost: Unknown<br />
Funds: Local, State, Federal<br />
Completion Date: 31 Dec 2015<br />
4.85
interoperability between all<br />
communities. The Plan should<br />
address equipment compatibility and<br />
upgrade requirements to implement<br />
<strong>the</strong> Plan. The University of St. Mary<br />
has identified a need to implement<br />
interoperable radio communications<br />
between its security staff and county<br />
and city services in case of campus<br />
emergency.<br />
3 Appoint a committee to research and<br />
implement enhancement to <strong>the</strong><br />
University's early warning systems<br />
for students and staff for wea<strong>the</strong>r<br />
alerts and campus emergencies.<br />
Enhancements may include a<br />
campus website identifying<br />
emergencies on campus. The<br />
University of St. Mary has identified a<br />
need to enhance <strong>the</strong> University's<br />
ability to issue early warnings for<br />
students and staff for wea<strong>the</strong>r events<br />
or campus emergencies in an<br />
effective, dependable, and rapid<br />
manner.<br />
M 1,2,4 All Hazards On-going University of St. Mary Cost: Unknown<br />
Funds: Local, State, Federal<br />
Completion Date: 31 Dec 2015<br />
Action ID Action/Description Priority Goal(s)<br />
Addressed<br />
1 Develop and fund mitigation projects<br />
for <strong>the</strong> construction of tornado safe<br />
rooms for Unified School District 449<br />
schools. Schools are particularly<br />
vulnerable to potential damage from<br />
tornadoes and high winds. Students,<br />
faculty, and staff should seek safe<br />
shelter when a tornado threatens.<br />
Tornado safe rooms should be<br />
constructed in schools to ensure a<br />
safe place for students to go during a<br />
tornado event. Safe rooms may be<br />
funded by FEMA during new school<br />
construction, as part of school<br />
additions, or as retrofits.<br />
Leavenworth County – USD 449<br />
Hazard Addressed Status Responsible Entity Estimated Cost and funding Source<br />
M 1,2 Tornado, Windstorm On-going,<br />
Open<br />
Ended<br />
School District, State,<br />
FEMA<br />
Cost: Unknown<br />
Funds: FEMA<br />
Completion Date: Continuous<br />
Leavenworth County – USD 453<br />
4.86
Action ID Action/Description Priority Goal(s)<br />
Hazard Addressed Status Responsible Entity Estimated Cost and funding Source<br />
Addressed<br />
1 Develop and fund mitigation projects<br />
for <strong>the</strong> construction of tornado safe<br />
rooms in <strong>the</strong> schools of USD #453.<br />
Schools are particularly vulnerable to<br />
potential damage from tornadoes<br />
and high winds. Students, faculty,<br />
and staff should seek safe shelter<br />
when a tornado threatens. Tornado<br />
safe rooms should be constructed in<br />
schools of USD 453 to ensure a safe<br />
place for students to go during a<br />
tornado event. Safe rooms may be<br />
funded during new school<br />
construction as part of school<br />
additions or as retrofits.<br />
M 1,2 Tornado, Windstorm On-going School District, FEMA Cost: Unknown<br />
Funds: FEMA<br />
Completion Date: 31 Dec 2015<br />
Action ID Action/Description Priority Goal(s)<br />
Addressed<br />
1 Develop and fund mitigation projects<br />
for <strong>the</strong> construction of tornado safe<br />
rooms in <strong>the</strong> schools of USD #458 in<br />
both Basehor and Linwood. Schools<br />
are particularly vulnerable to<br />
potential damage from tornadoes<br />
and high winds. Students, faculty,<br />
and staff should seek safe shelter<br />
when a tornado threatens. Tornado<br />
safe rooms should be constructed in<br />
schools of USD 458 to ensure a safe<br />
place for students to go during a<br />
tornado event. Safe rooms may be<br />
funded during new school<br />
construction, as part of school<br />
additions, or as retrofits.<br />
Leavenworth County – USD 458<br />
Hazard Addressed Status Responsible Entity Estimated Cost and funding Source<br />
M 1,2 Tornado, Windstorm On-going School District, FEMA Cost: Unknown<br />
Funds: FEMA<br />
Completion Date: 31 Dec 2015<br />
2 Assess elevations and water flow in<br />
<strong>the</strong> district to qualify <strong>the</strong> benefit of<br />
flood control projects in <strong>the</strong> District.<br />
The Basehor-Linwood Unified School<br />
District #458 would like to analyze<br />
<strong>the</strong> potential benefits of constructing<br />
soil-based berms, and o<strong>the</strong>r flood<br />
M 1,2 Flood On-going School District Cost: Unknown<br />
Funds: Local, State, Federal<br />
Completion Date: 31 Dec 2015<br />
4.87
control projects, around various<br />
facilities in <strong>the</strong> district to mitigate <strong>the</strong><br />
effects from flooding.<br />
Action ID Action/Description Priority Goal(s)<br />
Addressed<br />
1 Develop and fund mitigation projects<br />
for <strong>the</strong> construction of tornado safe<br />
rooms in <strong>the</strong> schools of USD #464 in<br />
Tonganoxie. Schools are particularly<br />
vulnerable to potential damage from<br />
tornadoes and high winds. Students,<br />
faculty, and staff should seek safe<br />
shelter when a tornado threatens.<br />
Tornado safe rooms should be<br />
constructed in schools of USD 464 to<br />
ensure a safe place for students to<br />
go during a tornado event. Safe<br />
rooms may be funded during new<br />
school construction, as part of school<br />
additions, or as retrofits.<br />
2 Obtain funding for <strong>the</strong> purchase and<br />
installation of backup power<br />
generators for <strong>the</strong>schools of USD<br />
464. USD 464 has identified a need<br />
to quickly restore power in all of its<br />
schools in <strong>the</strong> event of a wea<strong>the</strong>r<br />
event and <strong>the</strong> subsequent loss of po<br />
3 Seek funding to retain a professional<br />
school safety and security firm to<br />
<strong>review</strong> and update <strong>the</strong> school’s<br />
Security Plan for domestic acts of<br />
terrorism, building security, and<br />
contagious disease response. As<br />
domestic acts of terrorism are<br />
becoming more of reality, many<br />
officials believe that <strong>the</strong> next wave of<br />
terrorists acts may be aimed at<br />
public school systems. Although<br />
<strong>the</strong>se events are impossible to<br />
predict with great accuracy, updating<br />
building security, school security<br />
Leavenworth County – USD 464<br />
Hazard Addressed Status Responsible Entity Estimated Cost and funding Source<br />
M 1,2 Tornado, Windstorm On-going,<br />
Open<br />
Ended<br />
Superintendent of Schools<br />
Cost: Unknown<br />
Funds: Local<br />
Completion Date: Continuous<br />
M 1,2 All Hazards On-going Superintendent of Schools Cost: Unknown<br />
Funds: Local, State, Federal<br />
Completion Date: 31 Dec 2015<br />
M 1,2,3 Terrorism, Agri-Terrorism,<br />
Civil Disorder<br />
On-going Superintendent of Schools Cost: Unknown<br />
Funds: Local, State, Federal<br />
Completion Date: 31 Dec 2015<br />
4.88
plans, and USD emergency plans<br />
can prepare school districts such as<br />
USD 464 for <strong>the</strong>se events.<br />
Companies such as <strong>the</strong> National<br />
School Safety and Security Services<br />
provide <strong>the</strong> expertise in this field to<br />
help <strong>review</strong> and upgrade plans for<br />
<strong>the</strong> district.<br />
Action ID Action/Description Priority Goal(s)<br />
Addressed<br />
1 Develop and fund mitigation projects<br />
for <strong>the</strong> construction of tornado /<br />
thunderstormwind safe rooms in <strong>the</strong><br />
schools of USD #469 in Lansing.<br />
Schools are particularly vulnerable to<br />
potential damage from tornadoes<br />
and high winds. Students, faculty,<br />
and staff should seek safe shelter<br />
when a tornado or thunderstorm<br />
winds threatens. Safe rooms should<br />
be constructed in schools of USD<br />
469 to ensure a safe place for<br />
students to go during a tornado or<br />
thunderstorm wind event. Safe<br />
rooms may be funded during new<br />
school construction, as part of school<br />
additions, or as retrofits.<br />
2 Seek funding to retain a professional<br />
school safety and security firm to<br />
<strong>review</strong> and update <strong>the</strong> school’s<br />
Security Plan for domestic acts of<br />
terrorism, building security, and<br />
contagious disease response. As<br />
domestic acts of terrorism are<br />
becoming more of reality, many<br />
officials believe that <strong>the</strong> next wave of<br />
terrorists acts may be aimed at<br />
public school systems. Although<br />
<strong>the</strong>se events are impossible to<br />
predict with great accuracy, updating<br />
building security, school security<br />
plans, and USD emergency plans<br />
can prepare school districts such as<br />
USD 469 for <strong>the</strong>se events.<br />
Companies such as <strong>the</strong> National<br />
School Safety and Security Services<br />
Leavenworth County – USD 469<br />
Hazard Addressed Status Responsible Entity Estimated Cost and funding Source<br />
M 1,2 Tornado, Windstorm On-going,<br />
Open<br />
Ended<br />
M 1,2,3 Terrorism, Agri-Terrorism,<br />
Civil Disorder<br />
On-going<br />
School District, State,<br />
FEMA<br />
Board of Education, School<br />
superintendent<br />
Cost: Unknown<br />
Funds: Local<br />
Completion Date: Continuous<br />
Cost: Unknown<br />
Funds: Local, State, Federal<br />
Completion Date: 31 Dec 2015<br />
4.89
provide <strong>the</strong> expertise in this field to<br />
help <strong>review</strong> and upgrade plans for<br />
<strong>the</strong> district.<br />
Action ID Action/Description Priority Goal(s)<br />
Addressed<br />
1 The safe room for <strong>the</strong> new school<br />
will be located on <strong>the</strong> lower level;<br />
however, it will have an on-grade<br />
entrance/exit due to <strong>the</strong> terrain of <strong>the</strong><br />
site. Three walls are below grade.<br />
The elevator will allow <strong>the</strong> 2nd and<br />
3rd floor staff and students with<br />
disabilities (and wheelchair bound<br />
students) to access <strong>the</strong> safe room.<br />
2 The district is vulnerable to <strong>the</strong> threat<br />
of tornadoes and TSTM Winds. The<br />
current MacArthur Elementary<br />
School has a designated tornado<br />
area but <strong>the</strong> construction design of<br />
<strong>the</strong> old school (built in 1956) is very<br />
vulnerable to tornadoes and TSTM<br />
winds. The new school has a<br />
planned capacity to host over 1000<br />
students and staff. The safe room is<br />
designed to be located on <strong>the</strong> lower<br />
level. The safe room will have an on<br />
grade entrance and exit due to <strong>the</strong><br />
site terrain. Three walls are below<br />
grade with one on grade. The safe<br />
room will also be accessible from an<br />
elevator to accommodate children<br />
and adults with disabilities as well as<br />
stairs. It will be part of <strong>the</strong> initial<br />
construction of <strong>the</strong> new elementary<br />
school at Fort Leavenworth.<br />
Leavenworth County – USD 207<br />
Hazard Addressed Status Responsible Entity Estimated Cost and funding Source<br />
H 1,2 Tornadoes, Windstorm On-going<br />
(Inprogress)<br />
USD 207 Board of<br />
Education; CFO (business<br />
manager) will tract progress<br />
of project .<br />
H 1,2 Tornadoes, Windstorm New USD 207 Board of<br />
Education; CFO (business<br />
manager) will tract progress<br />
of project along with<br />
architectural firm (BCDM)<br />
and Titan Construction<br />
Company<br />
Cost: $28.6 million<br />
Funds: FEMA Grant and USD 207<br />
Completion Date: 31 Dec 2013<br />
Cost: $1.2 million<br />
Funds: Local<br />
Completion Date: August 2015<br />
Wyandotte County<br />
Action ID Action/Description Priority Goal(s)<br />
Addressed<br />
Wyandotte County<br />
Hazard Addressed Status Responsible Entity Estimated Cost and funding Source<br />
4.90
WyCo 1<br />
WYCo 2<br />
WyCo 3<br />
Develop alternative ways to better<br />
monitor, in real-time, water levels of<br />
<strong>the</strong> Kansas & Missouri Rivers,<br />
Turkey Creek and o<strong>the</strong>r smaller<br />
streams / tributaries throughout <strong>the</strong><br />
county for <strong>the</strong> purposes of advance<br />
planning, response & warning. For<br />
real-time monitoring to allow /<br />
enhance advance planning, provide<br />
adequate response and give timely<br />
warning to <strong>the</strong> citizens. Currently, <strong>the</strong><br />
local river / stream monitoring is very<br />
inadequate. Survey various<br />
locations and Install several remotely<br />
accessible gages and cameras at<br />
strategic points along <strong>the</strong> Kansas &<br />
Missouri Rivers, Turkey Creek and<br />
o<strong>the</strong>r smaller streams / tributaries<br />
throughout <strong>the</strong> county.<br />
Provide adequate communications<br />
system(s) for Scouts, Scouters and<br />
campers at Boy Scout Camp<br />
Theodore Naish, BSA. No<br />
completely adequate<br />
communications system(s) are<br />
currently available for campers,<br />
leaders and staff at Camp Naish.<br />
• Camp Naish conducts year-round<br />
camping with <strong>the</strong> heaviest number of<br />
campers on-site during <strong>the</strong> summer<br />
months, mainly late May thru early<br />
August. Camping also occurs<br />
throughout <strong>the</strong> year. Provide better<br />
communications equipment to<br />
ensure <strong>the</strong> camp has contact with<br />
local government public safety<br />
entities and with each o<strong>the</strong>r<br />
throughout <strong>the</strong> camp.<br />
Provide adequate & timely warning<br />
system(s) for Scouts, Scouters and<br />
campers at Boy Scout Camp<br />
Theodore Naish, BSA No<br />
completely adequate & timely<br />
warning system(s) are currently<br />
available for campers at Camp<br />
Naish. • Camp Naish conducts yearround<br />
camping with <strong>the</strong> heaviest<br />
number of campers on-site during<br />
<strong>the</strong> summer months, mainly late May<br />
thru early August. Camping also<br />
occurs throughout <strong>the</strong> year. Provide<br />
adequate & timely warning system(s)<br />
H 1,2, 4 Floods On-going Emergency Management<br />
Director<br />
High 4 All Hazards Deleted<br />
from<br />
Wyandotte<br />
Co. Moved<br />
to BSA1<br />
Wyandotte County<br />
Emergency Management<br />
H 1,2,4 All Hazards On-going Wyandotte County<br />
Emergency Management<br />
Department Director<br />
Cost: $10,000<br />
Funds: FEMA<br />
Completion Date: 2 – 5 years<br />
Cost: Unknown<br />
Funds: Grant funding with in-kind<br />
match, contributions of local <strong>material</strong>,<br />
manpower & monetary resources.<br />
Completion Date: Deleted/Moved<br />
Cost: Unknown<br />
Funds: Grant funding with in-kind<br />
match.contributions of local <strong>material</strong>,<br />
manpower & monetary resources.<br />
Completion Date: 1 year of project<br />
approval.<br />
4.91
WyCo 4<br />
WyCo 5<br />
that can be activated both on-site<br />
and remotely to warn camp<br />
personnel to impending dangers.<br />
Adopt building codes to require safe<br />
rooms in residential structures and<br />
public buildings—including schools.<br />
To protect <strong>the</strong> citizens, visitors,<br />
school children, faculty & staff<br />
• The majority of private residences<br />
(to include high-rises & congregate<br />
care centers), public buildings and<br />
schools in Wyandotte County have<br />
completely inadequate, if any at all,<br />
shelters from storms. Work with all<br />
three cities to adopt building codes to<br />
require safe rooms in residential<br />
structures (to include high-rises &<br />
congregate care centers) and public<br />
buildings--including schools<br />
Large Outdoor Venues—Response<br />
PlansShelteringDevelop/Provide/Upd<br />
ate Shelter Areas/Safe Rooms and<br />
Response Plans for Large Outdoor<br />
Venues (ie: KS Speedway,<br />
Community America Ballpark<br />
[TBones], Capital Federal Park @<br />
Sandstone, KC Renaissance<br />
Festival, Schlitterbahn Vacation<br />
Village, Lakeside Speedway,<br />
Sporting KC, Wyandotte County<br />
Fairgrounds, local football stadiums,<br />
and o<strong>the</strong>r locations<br />
as identified in <strong>the</strong> future.) Wea<strong>the</strong>r<br />
in Kansas is completely<br />
unpredictable and <strong>the</strong> need for folks<br />
attending large outdoor venue events<br />
to seek shelter at any time is to be<br />
expected. • Currently, no large<br />
outdoor venues have appropriate<br />
sheltering for individuals and most<br />
have no sheltering available at all.<br />
• Many of <strong>the</strong> large venues find<br />
<strong>the</strong>mselves at a complete loss as to<br />
WHAT to tell <strong>the</strong>ir visitors/fans and<br />
WHEN to tell <strong>the</strong>m! All need better<br />
plans. Work with each of <strong>the</strong> large<br />
venues to enhance <strong>the</strong>ir current<br />
emergency response plans to ensure<br />
proper emergency procedures are inplace<br />
& to insure <strong>the</strong>y have adequate<br />
means to warn <strong>the</strong>ir visitors/fans<br />
while instructing <strong>the</strong>m what actions<br />
H 1,2 Windstorm, Tornadoes On-going UG Planning Department<br />
working with UG<br />
Commissioners and Bonner<br />
Springs, KS and<br />
Edwardsville, KS Planning<br />
and Zoning<br />
H 1,2 All Hazards On-going Emergency Management<br />
Director<br />
Cost: Unknown<br />
Funds: Grants, local funding,<br />
individual funding.<br />
Completion Date: 3 – 10 years<br />
Cost: Unknown<br />
Funds: Local, large venue funds,<br />
grant funding<br />
Completion Date: 3 – 10 years<br />
4.92
WyCo 6<br />
WyCo 7<br />
WyCo 8<br />
to take,• Work with each of <strong>the</strong> large<br />
venues to ascertain <strong>the</strong> best<br />
available locations to direct <strong>the</strong>ir<br />
visitors/fans to in case of <strong>the</strong> need<br />
for sheltering. • Emphasize <strong>the</strong> need<br />
for each large venue (and those to<br />
be constructed) to provide adequate<br />
sheltering from storms (tornadoes,<br />
hail, lightning, etc.,) as a minimum<br />
within <strong>the</strong>ir design or added as a<br />
retrofit.<br />
Continue Participation in <strong>the</strong> National<br />
Flood Insurance Program (NFIP).<br />
Numerous areas within Wyandotte<br />
County lie within <strong>the</strong> designated<br />
flood plain. Wyandotte County<br />
participates in <strong>the</strong> NFIP and will<br />
continue to do so. Wyandotte<br />
County will continue to regulate<br />
development in <strong>the</strong> flood plain<br />
according to <strong>the</strong> flood plain<br />
management ordinance and <strong>the</strong><br />
DFIRMs. Continue participation in<br />
<strong>the</strong> NFIP and enforce current flood<br />
plain management ordinance. Adopt<br />
revised ordinance as a result of <strong>the</strong><br />
development of new DFIRM maps.<br />
Purchase flood prone properties.<br />
Especially repetitive loss properties.<br />
Historically properties located in<br />
flood prone areas have had many<br />
costly repetitive losses. T<strong>here</strong> is a<br />
need to reduce <strong>the</strong> probability for<br />
property loss due to repetitive<br />
flooding.<br />
Provide Back-up power for critical<br />
facilities (i.e. BPU water system<br />
pumps, Armourdale and Fairfax<br />
Drainage Districts, hospitals, nursing<br />
homes, schools, etc.) Facilities are<br />
designated as “Critical Facilities” due<br />
to <strong>the</strong>ir required operation in relation<br />
to <strong>the</strong> health, safety, welfare and/or<br />
needs of <strong>the</strong> local communities <strong>the</strong>y<br />
serve. Disruption of critical facility<br />
operations could easily affect <strong>the</strong><br />
health, safety or welfare of citizens—<br />
even to <strong>the</strong> point of life<br />
endangerment. Plan for and Install<br />
back-up generators or UPS systems<br />
in each facility. Or, as a minimum,<br />
determine and plan for alternate<br />
H 1,2 Flood On-going,<br />
Open<br />
Ended<br />
H 1,2 Flood On-going,<br />
Open<br />
Ended<br />
H 1,2 All Hazards On-going,<br />
Open<br />
Ended<br />
Flood Plain Manager<br />
(Planning Department),<br />
County Emergency<br />
Management<br />
Wyandotte county<br />
Emergency Management<br />
Director<br />
Emergency Management<br />
Director<br />
Cost: Unknown<br />
Funds: Local<br />
Completion Date: Continuous<br />
Cost: Unknown<br />
Funds: Federal HMGP, Local,<br />
Combination of both<br />
Completion Date: Continuous<br />
Cost: $300,000<br />
Funds: Grant, Local<br />
Completion Date: Continuous<br />
4.93
power sources—ie; pre-wire building<br />
for use of on-call, rented/loaned<br />
generators.<br />
WyCo 9 Encourage development of low water<br />
plans for utilities, businesses and<br />
organizations dependent on <strong>the</strong><br />
water supply from <strong>the</strong> rivers. River<br />
water supply is very unpredictable<br />
with rivers often dropping to<br />
dangerous levels affecting those<br />
agencies dependent on supply of<br />
water. Partner with utilities,<br />
businesses and organizations<br />
dependent on river water and assist<br />
<strong>the</strong>m, as needed and appropriate,<br />
with low water plans.<br />
WyCo10 Protect or relocate flood prone<br />
critical facilities. Critical facilities are<br />
identified as such due to <strong>the</strong> critical<br />
need of o<strong>the</strong>rs for <strong>the</strong>ir continued<br />
operation. Unprotected critical<br />
facilities in <strong>the</strong> flood prone areas<br />
could become nonoperational<br />
for long periods of time due to<br />
flooding. Develop and implement<br />
methods for protecting flood prone<br />
critical facilities on a case-by-case<br />
basis. or Relocate <strong>the</strong> critical facility,<br />
WyCo 11 Upgrade Local Government 800<br />
Radio System to include placement<br />
of radios in all Unified School District<br />
Offices plus District Archdiocese<br />
Office and o<strong>the</strong>rs as identified—<br />
possibly American Red Cross and<br />
Salvation Army Offices. Information,<br />
Warning and Notification of<br />
impending or current emergency<br />
situation(s) within <strong>the</strong> county requires<br />
immediate contact with <strong>the</strong> majority<br />
of citizens. Currently, <strong>the</strong>re are no<br />
immediate means of contacting <strong>the</strong><br />
majority of school districts to notify,<br />
warn or inform <strong>the</strong>m of pending<br />
emergencies— except for USD# 500<br />
which does have an LG 800 radio<br />
stations. Safety and welfare of<br />
citizens—especially children—are of<br />
utmost priority. Procure and<br />
provide/install Local Government 800<br />
radios for each Unified School<br />
District, District Archdiocese Office<br />
and o<strong>the</strong>rs as <strong>the</strong>y are identified, in<br />
H 1,2,4 Drought On-going Emergency Management<br />
Department director<br />
H 1,2 Flood On-going,<br />
Open<br />
Ended<br />
H 4 All Hazards On-going,<br />
Open<br />
Ended<br />
Emergency Management<br />
Department Director<br />
Emergency Management<br />
director<br />
Cost: Unknown<br />
Funds: Local<br />
Completion Date: Unknown<br />
Cost: Unknown<br />
Funds: Local, Grant<br />
Completion Date: One to several<br />
years – depending on <strong>the</strong> prevention<br />
method(s) chosen to be used, and/or<br />
<strong>the</strong> need to relocate <strong>the</strong> critical<br />
facility.<br />
Cost: $21M<br />
Funds: Local, Grant, Donations<br />
Completion Date: Continuous<br />
4.94
WyCo 12<br />
WyCo 13<br />
WyCo 14<br />
order to communicate information,<br />
notifications and warnings in a timely<br />
manner.<br />
Build Bridges / raise roads in lowlying<br />
areas. T<strong>here</strong> are several lowlying<br />
areas across <strong>the</strong> county that is<br />
prone to flash-flooding or extensive<br />
water run-off with every heavy or<br />
extended rainfall that occurs.<br />
Numerous streets around <strong>the</strong> county<br />
require extensive manpower and<br />
barricades during every heavy<br />
rainfall period in order to close/open<br />
<strong>the</strong>m for <strong>the</strong> protection of property &<br />
personnel. Flash flooding happens<br />
every rain event for some streets.<br />
Raise streets / roads in low-lying<br />
areas by re-building <strong>the</strong> road,<br />
installing larger culverts, improving<br />
water runoff, etc. to preclude flashflooding.<br />
Build bridges for those lowlying<br />
areas that cannot be corrected<br />
by <strong>the</strong> previous method.<br />
Expand / Improve Outdoor Warning<br />
System Network. Wyandotte County<br />
currently has a total of 77 zoned<br />
warning sirens covering much of <strong>the</strong><br />
county area. With <strong>the</strong> extensive<br />
development throughout <strong>the</strong> county<br />
<strong>the</strong>re are areas still needing more<br />
coverage or better coverage. Many<br />
citizens rely on <strong>the</strong> warning sirens as<br />
<strong>the</strong>ir primary warning source. Severe<br />
wea<strong>the</strong>r in Kansas is a fact of life.<br />
Add additional warning sirens to<br />
cover those areas, countywide,<br />
currently having only minimal<br />
coverage or none at all. Include<br />
some voice transmit warning sirens<br />
for various areas around <strong>the</strong> county;(<br />
i.e.: numerous large outdoor venue<br />
areas including <strong>the</strong> Kansas<br />
Speedway, Schlitterbahn Vacation<br />
Village, The Legends and many<br />
o<strong>the</strong>rs.)<br />
Continue Participation in <strong>the</strong><br />
“StormReady” Community<br />
Certification Program thru<br />
<strong>the</strong> National Wea<strong>the</strong>r Service,<br />
Pleasant Hill, MO. Primary emphasis<br />
in Emergency Management is to do<br />
all we can to educate citizens on<br />
H 1,2 Flood On-going,<br />
Open<br />
Ended<br />
H 1,2 Windstorm, Tornadoes On-going,<br />
Open<br />
Ended<br />
H 3,4 All Hazards On-going,<br />
Open<br />
Ended<br />
UG Public Works Street<br />
Department Director<br />
Emergency Management<br />
Director<br />
Emergency Management<br />
Director<br />
Cost: Unknown<br />
Funds: Local, CMIP, Excise Taxes,<br />
Grants<br />
Completion Date: Continuous<br />
Cost:: $18,000 to $25,000 per siren,<br />
plus on-going annual required<br />
maintenance.<br />
Funds: Grants, HMIP, revenuesharing,<br />
o<strong>the</strong>r local funds.<br />
Completion Date: Continuous<br />
Cost: Staff Time<br />
Funds: NA<br />
Completion Date: Continuous<br />
4.95
WyCo 15<br />
WyCo 16<br />
personal Emergency Preparedness<br />
issues and to protect <strong>the</strong>ir lives and<br />
property. Meeting or exceeding <strong>the</strong><br />
requirements for maintaining <strong>the</strong><br />
“StormReady” Community<br />
Certification / Designation alone<br />
ensures that we will be much better<br />
prepared to accomplish <strong>the</strong> mission<br />
throughout all phases of Emergency<br />
Management. Continue meeting /<br />
exceeding all of <strong>the</strong> requirements for<br />
<strong>the</strong> “StormReady” Community<br />
Program.<br />
Public Education: Safety during<br />
extreme temperature (heat / cold)<br />
conditions. Citizens need to know<br />
how to protect <strong>the</strong>mselves from,<br />
prepare for, respond to and recover<br />
from extreme temperature<br />
conditions. Proper knowledge,<br />
individual preparation and care can<br />
prevent injury, illness and potential<br />
deaths. Provide public education<br />
talks, seminars, meetings with<br />
various groups, planning sessions,<br />
training, exercises, etc. Provide<br />
information thru websites; cell<br />
phones; newspapers, <strong>the</strong>atres,<br />
billboards, fliers, PSAs, television<br />
ads and o<strong>the</strong>r multimedia sources,<br />
Provide educational <strong>material</strong>s to<br />
schools, hospitals, senior citizen<br />
centers, long-term care facilities,<br />
business & industry and individuals.<br />
Public Education: Promote NOAA<br />
“All-Hazards” Wea<strong>the</strong>r Radios and<br />
Support <strong>the</strong> KC Metro Region’s<br />
“Project Community Alert” All-<br />
Hazards Wea<strong>the</strong>r Radio Program.<br />
Citizens need to receive timely<br />
information / warnings in order to<br />
protect <strong>the</strong>mselves from, prepare for,<br />
respond to and recover from various<br />
emergency type situations /<br />
incidents. The All-Hazards Wea<strong>the</strong>r<br />
Radio provides one of <strong>the</strong> necessary<br />
means for receipt of <strong>the</strong> notification<br />
and warning messages. Proper<br />
knowledge, individual preparation<br />
and care can prevent personal<br />
injury, illness and potential deaths.<br />
Continue to promote and support<br />
H 1,2,3,4 Extreme Temperatures On-going,<br />
Open<br />
Ended<br />
H 1,2,3,4 All Hazards On-going,<br />
Open<br />
Ended<br />
Emergency Management &<br />
Public Health Departments<br />
Directors<br />
Emergency Management<br />
Department Director<br />
Cost: Depends on magnitude of <strong>the</strong><br />
public education program being<br />
conducted.<br />
Funds: Grants, Local, Combination<br />
Completion Date: Continuous<br />
Cost: Depends on magnitude of <strong>the</strong><br />
public education program being<br />
conducted. Cost for <strong>the</strong> purchase of<br />
a radio is an individual responsibility.<br />
Funds: Department of Homeland<br />
Security Grants, Local, Combination<br />
Completion Date: Continuous<br />
4.96
WyCo 17<br />
WyCo 18<br />
MARC’s “Project Community Alert”<br />
and also make NOAA radios<br />
available at cost to neighborhood<br />
groups, etc. Provide public education<br />
talks, seminars, meetings with<br />
various groups, planning sessions,<br />
training, exercises, etc. Provide<br />
information thru websites; cell<br />
phones; newspapers, <strong>the</strong>atres,<br />
billboards, fliers, PSAs, television<br />
ads and o<strong>the</strong>r multimedia sources,<br />
• Provide educational <strong>material</strong>s to<br />
schools, hospitals, senior citizen<br />
centers, long-term care facilities,<br />
business & industry and individuals.<br />
Public Education: Tornado Safety.<br />
Citizens need to know how to protect<br />
<strong>the</strong>mselves from, prepare for,<br />
respond to and recover from<br />
tornadoes & severe wea<strong>the</strong>r. Proper<br />
knowledge, individual preparation<br />
and care can prevent injury and<br />
potential deaths. Provide public<br />
education talks, seminars, meetings<br />
with various groups, planning<br />
sessions, training, exercises, etc.<br />
Provide information thru websites;<br />
cell phones; newspapers, <strong>the</strong>atres,<br />
billboards, fliers, PSAs, television<br />
ads and o<strong>the</strong>r multimedia sources,<br />
Provide educational <strong>material</strong>s to<br />
schools, hospitals, senior citizen<br />
centers, long-term care facilities,<br />
business & industry and individuals.<br />
Public Education: Winter Wea<strong>the</strong>r<br />
Driving. Citizens need to know<br />
correct preparation and safety<br />
procedures for driving during winter<br />
wea<strong>the</strong>r conditions. Citizens need to<br />
know how to protect <strong>the</strong>mselves<br />
from, prepare for, respond to and<br />
recover from winter wea<strong>the</strong>r driving<br />
conditions. Proper knowledge,<br />
individual preparation and care can<br />
prevent accidents, injury, illness and<br />
potential deaths. Provide public<br />
education talks, seminars, meetings<br />
with various groups, planning<br />
sessions, training, exercises, etc.<br />
Provide information thru websites;<br />
cell phones; newspapers, <strong>the</strong>atres,<br />
billboards, fliers, PSAs, television<br />
H 1,2,3 Tornadoes On-going,<br />
Open<br />
Ended<br />
H 1,2,3 Winter Storms On-going,<br />
Open<br />
Ended<br />
Emergency Management<br />
Department Director<br />
Emergency Management<br />
Department Director<br />
Cost: Depends on magnitude of<br />
public education program being<br />
conducted<br />
Funds: Grants, local, combination<br />
Completion Date: Continuous<br />
Cost: Depends on magnitude of <strong>the</strong><br />
public education program being<br />
conducted<br />
Funds: Grants, Local, combination<br />
Completion Date: Continuous<br />
4.97
WyCo 19<br />
WyCo 20<br />
ads and o<strong>the</strong>r multimedia sources,<br />
Provide educational <strong>material</strong>s to<br />
schools, hospitals, senior citizen<br />
centers, long-term care facilities,<br />
business & industry and individuals.<br />
Public Education: The Dangers of<br />
Lightning. Citizens need to be aware<br />
of <strong>the</strong> dangers in<strong>here</strong>nt with<br />
lightning. Citizens need to know how<br />
to protect <strong>the</strong>mselves and <strong>the</strong>ir<br />
property from and respond to<br />
damaging lightning strikes. Proper<br />
knowledge, individual preparation<br />
and care can prevent personal<br />
injury, limit property damage and<br />
avoid potential deaths. Provide<br />
public education talks, seminars,<br />
meetings with various groups,<br />
planning sessions, training,<br />
exercises, etc. Provide information<br />
thru websites; cell phones;<br />
newspapers, <strong>the</strong>atres, billboards,<br />
fliers, PSAs, television ads and o<strong>the</strong>r<br />
multimedia sources, Provide<br />
educational <strong>material</strong>s to schools,<br />
hospitals, senior citizen centers,<br />
long-term care facilities, business &<br />
industry and individuals.<br />
Public Education: Encourage ALL<br />
citizens to have a disaster kit which<br />
contains food, water, flashlight,<br />
batteries, battery operated radio,<br />
medications, etc. Citizens in<br />
Wyandotte County face many<br />
potential hazards, some that will<br />
require <strong>the</strong>m to survive on <strong>the</strong>ir own<br />
for possibly one to three days or<br />
more until additional help can arrive.<br />
Citizens need to take responsibility<br />
for <strong>the</strong>ir own health, safety and<br />
welfare by planning ahead and being<br />
ready to care for <strong>the</strong>mselves, <strong>the</strong>ir<br />
families and <strong>the</strong>ir neighbors during<br />
all emergencies/disasters. Continue<br />
to provide information about <strong>the</strong> true<br />
need for and contents of personal /<br />
family disaster kits through<br />
Emergency Preparedness talks &<br />
training, various media sources,<br />
literature, websites and by o<strong>the</strong>r<br />
means.<br />
H 1,2,3 Lightning On-going,<br />
Open<br />
Ended<br />
H 1,2,3 All Hazards On-going,<br />
Open<br />
Ended<br />
Emergency Management<br />
Department Director<br />
Emergency Management<br />
Department Director<br />
WyCo 21 Continue Review / Revision of <strong>the</strong> H 4 All Hazards On-going, Emergency Management Cost: NA<br />
Cost: Depends on <strong>the</strong> magnitude of<br />
<strong>the</strong> public education program being<br />
conducted<br />
Funds: Grants, local, combination<br />
Completion Date: Continuous<br />
Cost: NA<br />
Funds: Individual Funds<br />
Completion Date: Continuous<br />
4.98
WyCo 22<br />
WyCo 23<br />
Wyandotte County Emergency<br />
Operations Plan (EOP). Local<br />
government planning, preparedness,<br />
response, recovery and mitigation<br />
operations to provide services to <strong>the</strong><br />
public must continue regardless of<br />
initial, temporary disruptions by an<br />
incident or disaster. The health,<br />
safety and welfare of <strong>the</strong> public<br />
depend on continued operation of<br />
<strong>the</strong>se local government services.<br />
Continue Review / Revision of <strong>the</strong><br />
Wyandotte County Emergency<br />
Operations Plan (EOP). Review plan<br />
annually and following all incidents<br />
and exercises to determine if<br />
changes need to be made. Conduct<br />
formal <strong>review</strong>s of each ESF every<br />
five years as scheduled in <strong>the</strong> plan.<br />
Train on and exercise <strong>the</strong> plan.<br />
Continue Review / Revision of <strong>the</strong><br />
Wyandotte County Metropolitan<br />
Medical Response System (MMRS)<br />
Plan. Local government healthrelated<br />
services to <strong>the</strong> public must<br />
continue regardless of initial,<br />
temporary disruption by an incident<br />
or disaster. The health, safety and<br />
welfare of <strong>the</strong> public depend on<br />
continuation of <strong>the</strong>se local<br />
government services. Wyandotte<br />
County partners with all o<strong>the</strong>r metro<br />
area (Greater KC Region) counties<br />
and MARC for provision of seamless<br />
health-related services to <strong>the</strong> public.<br />
Continue Review / Revision of <strong>the</strong><br />
Wyandotte County Metropolitan<br />
Medical Response System (MMRS)<br />
Plan. Review plan annually and<br />
following all incidents and exercises<br />
to determine if changes need to be<br />
made. Conduct formal <strong>review</strong>s every<br />
five years. Continue working with<br />
MARC and <strong>the</strong> Greater KC Counties<br />
on MMRS<br />
Develop and maintain a Continuity of<br />
Operations Plan (COOP) for <strong>the</strong><br />
Unified Government. Local<br />
government services to <strong>the</strong> public<br />
must continue regardless of<br />
initial, temporary disruption by an<br />
incident or disaster. The health,<br />
Open<br />
Ended<br />
H 4 All Hazards On-going,<br />
Open<br />
Ended<br />
Department Director<br />
Emergency Management<br />
Director<br />
H 1,2,3,4 All Hazards On-going Wyandotte County<br />
emergency management<br />
Director<br />
Funds: Local<br />
Completion Date: Continuous<br />
Cost: Unknown<br />
Funds: DHS Grant, UASI Grant,<br />
Local, Combination<br />
Completion Date: Continuous<br />
Cost: Unknown<br />
Funds: Grant DHS, Federal & State<br />
Grants, Local, combination<br />
Completion Date: 1 to 1 ½ years<br />
after start.<br />
4.99
WyCo 24<br />
WyCo 25<br />
WyCo 26<br />
safety and welfare of <strong>the</strong> public<br />
depend on continuation of local<br />
government services. Develop and<br />
maintain a Continuity of Operations<br />
Plan (COOP) for <strong>the</strong> Unified<br />
Government. Include all departments<br />
and divisions in <strong>the</strong> plan; however,<br />
begin planning with <strong>the</strong> ones<br />
providing <strong>the</strong> most critical (life<br />
saving, etc.) services and work thru<br />
all departments.<br />
Develop and maintain a Multi-<br />
Hazards Evacuation Plan. T<strong>here</strong> are<br />
many hazards located in, and<br />
traveling through, Wyandotte<br />
County that could create immediate,<br />
temporary or permanent disruptions<br />
that would threaten <strong>the</strong> lives and<br />
well-being of <strong>the</strong> public, requiring<br />
<strong>the</strong>m to evacuate to a safer area.<br />
The health, safety and welfare of <strong>the</strong><br />
public depend on an orderly, planned<br />
evacuation to a safer area during a<br />
life-threatening incident. Develop<br />
and maintain a Multi-Hazards<br />
Evacuation Plan Include all<br />
departments and divisions in <strong>the</strong><br />
planning process to include o<strong>the</strong>r<br />
jurisdictions and agencies.<br />
Removal of Debris from Floodways<br />
to Mitigate Floodwater Back-up.<br />
Debris reduces or sometimes even<br />
stops water flow thru floodways<br />
causing floodwater to back-up. This<br />
back-up results in flooded roads,<br />
homes, businesses and land areas<br />
not normally designed to contain<br />
water. Remove debris from<br />
floodways to mitigate floodwater<br />
back-up and prevent fur<strong>the</strong>r<br />
damages.<br />
Removal of Debris from Storm water<br />
Systems to Mitigate Floodwater<br />
Back-up. Debris reduces or<br />
sometimes even stops water flow<br />
thru storm water systems causing<br />
floodwater to back-up. This back-up<br />
results in flooded roads, homes,<br />
businesses and land areas not<br />
normally designed to contain water.<br />
Remove debris from storm water<br />
systems to mitigate floodwater back-<br />
H 1,2,3,4 All Hazards On-going Wyandotte County<br />
Emergency Management<br />
Director<br />
H 1,2 Flood On-going,<br />
Open<br />
Ended<br />
H 1,2 Flood On-going,<br />
Open<br />
Ended<br />
UG Public Works<br />
Department Director<br />
Water Pollution Control<br />
Director, Public Works of<br />
Bonner Springs, and<br />
Edwardsville<br />
Cost: Unknown<br />
Funds: DHS Grant, Federal and<br />
State Grants, Local, combination<br />
Completion Date: 1 to 1 1 /2 years<br />
after start.<br />
Cost: Unknown<br />
Funds: Local, Grant<br />
Completion Date: Continuous<br />
Cost: Unknown<br />
Funds: Local, Grant<br />
Completion Date: Continuous<br />
4.100
WyCo 27<br />
WyCo 28<br />
WyCo 29<br />
up and prevent fur<strong>the</strong>r damages.<br />
Coordinate with NASCAR to develop<br />
a formal emergency response plan<br />
for <strong>the</strong> Kansas Speedway…including<br />
tornado sheltering. Spring event at<br />
<strong>the</strong> Kansas Speedway resulted in<br />
tornado warning requiring sheltering<br />
in place. No written plan for tornado<br />
response exists. Establish a working<br />
group to discuss and develop a<br />
written tornado response and<br />
sheltering in place plan.<br />
Continue Participation in <strong>the</strong><br />
Community Emergency Response<br />
Team (CERT) program by recruiting,<br />
training, equipping and fielding<br />
CERT Teams. Emergency services<br />
personnel may not be available to<br />
help for up to 72+ hours following a<br />
disaster due to <strong>the</strong> size of <strong>the</strong> area<br />
affected lost communications and<br />
impassable roads. Since help may<br />
not be immediately available<br />
following a disaster; it is imperative<br />
that individuals be trained and<br />
equipped to help <strong>the</strong>mselves,<br />
<strong>the</strong>ir families and <strong>the</strong>ir neighbors.<br />
• Most citizens know very little about<br />
<strong>the</strong> basic skills needed to help<br />
<strong>the</strong>mselves and o<strong>the</strong>rs in a disaster<br />
when emergency services are not<br />
available. Continue recruiting,<br />
training, equipping and fielding<br />
personnel as members of <strong>the</strong><br />
Community Emergency Response<br />
Teams (CERT). Provide on-going<br />
training, exercises and events for<br />
CERT members to help <strong>the</strong>m<br />
maintain <strong>the</strong>ir proficiencies.<br />
Construction of a boat ramp to <strong>the</strong><br />
Kansas River near <strong>the</strong> I-435 Bridge.<br />
Currently, <strong>the</strong>re is only one boat<br />
ramp accessing <strong>the</strong> Kansas River<br />
and it’s located at KAW Point near<br />
<strong>the</strong> confluence of <strong>the</strong> Kansas and<br />
Missouri Rivers. Time is always of<br />
<strong>the</strong> essence during an emergency<br />
and especially on <strong>the</strong> river it could<br />
very well become <strong>the</strong> meaning<br />
between life and death. Joint use of<br />
<strong>the</strong> boat ramp is needed by KDOT,<br />
local law enforcement and fire<br />
H 1,2 All Hazards On-going Emergency Management<br />
Director<br />
H 1,2,3 Flood On-going,<br />
Open<br />
Ended<br />
Emergency Management<br />
Director<br />
H 1,2 All Hazards On-going UG Public Works<br />
Department Director<br />
Cost: $30,000<br />
Funds: Nascar<br />
Completion Date: 3 months<br />
Cost: $4,000 per class of 25<br />
Funds: Grant, Local, Individual,<br />
combination<br />
Completion Date: Continuous<br />
Cost: Unknown<br />
Funds: HMGP, DHS Grant, CMIP,<br />
local<br />
Completion Date: 2 – 5 years<br />
4.101
WyCo 30<br />
WyCo 31<br />
WyCo 32<br />
department use plus o<strong>the</strong>r potential<br />
first responders. Construction of <strong>the</strong><br />
boat ramp to <strong>the</strong> Kansas River near<br />
<strong>the</strong> I-435 Bridge will provide more<br />
timely access to incidents on and<br />
along <strong>the</strong> river to include <strong>the</strong> areas<br />
near Edwardsville and Bonner<br />
Springs, KS.<br />
Construction of a boat ramp to <strong>the</strong><br />
Kansas River beneath <strong>the</strong> Turner<br />
Diagonal Bridge and @ 7 th St.<br />
Currently, <strong>the</strong>re is only one boat<br />
ramp accessing <strong>the</strong> Kansas River<br />
and it’s located at KAW Point near<br />
<strong>the</strong> confluence of <strong>the</strong> Kansas and<br />
Missouri Rivers. Travel time for water<br />
search and rescue is undesirably<br />
long. Time is always of <strong>the</strong> essence<br />
during an emergency and especially<br />
on <strong>the</strong> river it could very well become<br />
<strong>the</strong> meaning between life and death.<br />
KDOT would also use <strong>the</strong> boat ramp<br />
for bridge inspections, increasing<br />
<strong>the</strong> reliability of major transportation<br />
crossings. Joint use of <strong>the</strong> boat ramp<br />
is needed by KDOT, local law<br />
enforcement and fire department use<br />
plus o<strong>the</strong>r potential first responders.<br />
This project is currently scheduled<br />
for design throughout <strong>the</strong> remainder<br />
of 2009 and into 2010. Construction<br />
of <strong>the</strong> boat ramp to <strong>the</strong> Kansas River<br />
beneath <strong>the</strong> Turner Diagonal Bridge<br />
will provide more timely access to<br />
incidents on and along <strong>the</strong> river.<br />
Streng<strong>the</strong>n / Upgrade utility power<br />
lines / distribution systems. To<br />
reduce power failures and reliance<br />
on generators To reduce suffering<br />
and economic loss. Streng<strong>the</strong>n /<br />
Upgrade power distribution systems<br />
and power lines Bury utility lines<br />
Establish Priority reconnects with<br />
local utility companies after outages<br />
created by severe storms or o<strong>the</strong>r<br />
type incidents. Numerous agencies<br />
depend on continual utility support<br />
for <strong>the</strong> health, safety and welfare of<br />
<strong>the</strong>ir personnel / clientele to include<br />
life support issues. Critical facilities<br />
also depend on continual utility<br />
support for <strong>the</strong>ir operations. In some<br />
H 1,2 All Hazards On-going,<br />
in –<br />
progress of<br />
being built<br />
H 1,2 Utility/Infrastructure Failure On-going,<br />
Open<br />
Ended<br />
UG Public Works Director Cost: $60,000<br />
Funds: HMGP, DHS Grant, CMIP,<br />
local<br />
Completion Date: 2 – 5 years<br />
Board of Public Utilities,<br />
KCP&L, o<strong>the</strong>r utilities as<br />
needed<br />
H 1,2 Utility/Infrastructure Failure On-going County Emergency<br />
Management Director/all<br />
utilities in Wyandotte<br />
County<br />
Cost: Unknown<br />
Funds: HMGP Funding/Local<br />
Match, Local<br />
Completion Date: Continuous<br />
Cost: Unknown<br />
Funding: NA<br />
Completion Date: 6 month – 2<br />
years<br />
4.102
WyCo 33<br />
WyCo 34<br />
cases, failed utility support can mean<br />
<strong>the</strong> advent of even more lifethreatening<br />
incidents, i.e.: loss of life<br />
support equipment; chemical<br />
releases, food spoilage, etc. Partner<br />
with all local utility companies in<br />
identifying critical facilities for priority<br />
reconnects following outages and<br />
toge<strong>the</strong>r establish a detailed plan to<br />
accomplish all reconnects in an<br />
orderly manner by that priority<br />
Public Education—Promote<br />
Wyandotte County Multi-<br />
Jurisdictional All-Hazards<br />
Mitigation Plan to <strong>the</strong> Public.<br />
Wyandotte County is subject to a<br />
wide range of natural, man-made<br />
and technological hazards ranging<br />
from flooding to hazardous <strong>material</strong>s<br />
incidents, to tornadoes and severe<br />
wea<strong>the</strong>r. All citizens need to be<br />
aware of and plan for <strong>the</strong>se potential<br />
hazards. Citizen awareness and<br />
input is important during <strong>the</strong> planning<br />
process in order to develop a<br />
comprehensive countywide plan.<br />
Promote <strong>the</strong> Wyandotte County<br />
Multi-Jurisdictional All-Hazards<br />
Mitigation Plan to <strong>the</strong> Public and<br />
seek <strong>the</strong>ir comments. Promotion of<br />
<strong>the</strong> plan will be made thru news<br />
releases; various websites including<br />
a special page on <strong>the</strong> UG website;<br />
emails; neighborhood group<br />
announcements / newsletters;<br />
information to volunteer groups;<br />
public comment access areas at<br />
local libraries & city offices; and by<br />
o<strong>the</strong>r means—all to be addressed in<br />
<strong>the</strong> final Mitigation Plan.<br />
Continue Periodic Reviews / Updates<br />
of Wyandotte County Multi-<br />
Jurisdictional All-Hazards Mitigation<br />
Plan conducting a major <strong>review</strong><br />
every five years. A Complete<br />
Review & Update of <strong>the</strong> plan is<br />
required by FEMA at least once<br />
every Five years in order for<br />
Jurisdictions to continue <strong>the</strong>ir<br />
mitigation compliance and remain<br />
eligible for mitigation funding thru <strong>the</strong><br />
Hazard Mitigation Grant Program<br />
H 3 All Hazards On-going Wyandotte county<br />
Emergency Management<br />
Director<br />
H 1,2 All Hazards On-going Wyandotte County<br />
Emergency Management<br />
Director<br />
Cost: included in <strong>the</strong> currently<br />
funded HMGP grant<br />
Funds: Local, HMGP<br />
Completion Date: 2009<br />
Cost: NA<br />
Funds: NA<br />
Completion Date: On-going<br />
4.103
WyCo 35<br />
WyCo 36<br />
WyCo 37<br />
(HMGP). Conduct an annual <strong>review</strong><br />
of <strong>the</strong> Mitigation Plan ensuring all<br />
jurisdictions are involved. Maintain a<br />
running account on <strong>the</strong> status of<br />
mitigation actions. Conduct a<br />
complete <strong>review</strong> & update of <strong>the</strong><br />
entire plan at least once every five<br />
years for IAW FEMA mitigation<br />
compliance requirements. Forward<br />
<strong>the</strong> updated plan (or changes) to<br />
FEMA thru KDEM’s Mitigation<br />
Planning Section—same procedure<br />
as before. (At <strong>the</strong> present time, no<br />
formal jurisdiction adoptions are<br />
required for changes to <strong>the</strong> plan.)<br />
Identify <strong>the</strong> locations of special<br />
needs populations and develop a<br />
disaster early warning system for<br />
<strong>the</strong>m. Currently <strong>the</strong>re are no<br />
completely adequate notification<br />
systems available for <strong>the</strong> special<br />
needs population. Many special<br />
needs individuals need more<br />
advance warning to respond<br />
adequately and in a timely manner<br />
than do o<strong>the</strong>r individuals. A<br />
significant portion of Wyandotte<br />
County’s population falls into <strong>the</strong><br />
special needs category. Identify <strong>the</strong><br />
locations of special needs<br />
populations and develop a disaster<br />
early warning system for <strong>the</strong>m.<br />
Develop a plan for evacuating<br />
special needs populations during<br />
disasters. Currently <strong>the</strong>re are no<br />
special needs population evacuation<br />
plans for Wyandotte County special<br />
needs population presents different<br />
and additional resource needs in<br />
order to be moved / evacuated than<br />
o<strong>the</strong>rs normally do. The health,<br />
safety and welfare of special needs<br />
population depends on a well<br />
planned evacuation during disasters.<br />
Federal requirements (DOJ) stipulate<br />
<strong>the</strong> need for written evacuation plans<br />
for special needs population. Meet<br />
with all stakeholders and develop a<br />
detailed plan for evacuating special<br />
needs populations during disasters.<br />
Adopt / Implement / Enforce Building<br />
Code standards for <strong>the</strong> installation of<br />
1,2 High All Hazards On-going,<br />
open<br />
ended<br />
H 1,2 All Hazards On-going,<br />
Open<br />
Ended<br />
Wyandotte County<br />
Emergency Management<br />
Director<br />
Wyandotte County<br />
Emergency Management<br />
Director, MARC Regional<br />
Plan<br />
H 1,2 Lightning On-going UG, Bonner Springs,<br />
Edwardsville Planning<br />
Cost: Unknown<br />
Funds: State & Federal Grants,<br />
Local, combination, KSERV<br />
Completion Date: 6 – 24 months,<br />
<strong>the</strong>n continuous<br />
Cost: Unknown<br />
Funds: State and Federal Grants,<br />
Local, Combination<br />
Completion Date: 6 – 24 months<br />
and <strong>the</strong>n continuous<br />
Cost: Unknown<br />
Funds: Unknown<br />
4.104
WyCo 38<br />
WyCo 39<br />
WyCo 40<br />
lightning protection systems.<br />
Lightning is <strong>the</strong> # 1 under-rated killer<br />
and a major cause of injuries and<br />
damages during thunderstorms. The<br />
Magellan Tank Fire, numerous<br />
house & structure fires and grass<br />
fires have been caused by lightning<br />
strike incidents. Adopt / Implement /<br />
Enforce Building Code standards for<br />
<strong>the</strong> installation of lightning protection<br />
systems Include a spot on <strong>the</strong> Fire<br />
Inspector’s Checklist for Lightning<br />
Protection Systems<br />
Create a public notification system to<br />
alert <strong>the</strong> public about an epidemic<br />
and how To prevent or treat <strong>the</strong><br />
disease. Currently <strong>the</strong>re is no<br />
adequate public notification system<br />
to alert individuals about an epidemic<br />
or how to prevent or treat <strong>the</strong><br />
disease. Research available<br />
options, choose <strong>the</strong> best option that<br />
can be funded and fur<strong>the</strong>r develop it<br />
for use.<br />
Offer / provide Damage Assessment<br />
Team Training annually for<br />
designated Damage Assessment<br />
personnel. Personnel properly<br />
trained in current Damage<br />
Assessment methods / procedures<br />
are required following all disasters to<br />
assist Emergency Management in<br />
assessing countywide damages to<br />
help determine initial damage cost<br />
estimates. KDEM requires an Initial<br />
Situation Report (Sit-Rep) with this<br />
information following a disaster.<br />
Damage Assessment procedures<br />
often change, requiring individuals to<br />
take annual and/or refresher training.<br />
Offer / provide Damage Assessment<br />
Team Training annually for<br />
designated Damage Assessment<br />
personnel.<br />
Identify large venues, ball fields,<br />
parks and o<strong>the</strong>r areas countywide for<br />
installation of lightning detectors and<br />
develop a program for <strong>the</strong>ir<br />
installation. Lightning is <strong>the</strong> # 1<br />
under-rated killer that results in<br />
hundreds of needless deaths and<br />
property destruction annually.<br />
Departments, Director of<br />
Neighborhood Resource<br />
Center<br />
H 1,2,4 Major Disease Outbreak On-going Wyandotte county<br />
Emergency Management<br />
Director, Wyandotte county<br />
Public Health Department<br />
Director<br />
H 4 All Hazards On-going,<br />
Open<br />
Ended<br />
Wyandotte County<br />
Emergency management<br />
Director<br />
H 1,2 Lightning On-going Wyandotte County<br />
emergency Management<br />
Director<br />
Completion Date: 2 – 5 years<br />
Cost: Unknown<br />
Funds: Federal, State Grant funding<br />
through DHS/MMRS<br />
Local, combination<br />
Completion Date: 6 months – 1 ½<br />
years<br />
Cost: NA<br />
Funds: KDEM, IAW FEMA<br />
guidelines<br />
Completion Date: Continuous<br />
Cost: Unknown<br />
Funds: HMGP, DHS Grant, Local,<br />
Combination<br />
Completion Date: 1 – 3 years<br />
4.105
WyCo 41<br />
WyCo 42<br />
WyCo 43<br />
• Lightning can, and does, strike<br />
unaware in areas miles from, and<br />
outside, <strong>the</strong> actual storm area.<br />
Research areas countywide, acquire<br />
and install lightning detectors in<br />
areas as needed and identified.<br />
Conduct periodic site visits to<br />
hazardous <strong>material</strong>s (Haz-Mat)<br />
critical facilities for familiarization<br />
with <strong>the</strong> facility and to determine site<br />
capabilities and limitations for<br />
response. Wyandotte County has<br />
numerous Hazardous Materials<br />
storage / usage facilities that could<br />
require emergency response at any<br />
time. As with most incidents—Time is<br />
of <strong>the</strong> essence; however, Time is<br />
even more important when dealing<br />
with <strong>the</strong> dangers in<strong>here</strong>nt in Haz-Mat<br />
issues. Local responders conduct<br />
periodic site visits to hazardous<br />
<strong>material</strong>s critical facilities to<br />
familiarize <strong>the</strong>mselves with <strong>the</strong><br />
facility and its capabilities and<br />
limitations.<br />
Partner with local school districts to<br />
ensure <strong>the</strong>y have coordinated, wellprepared<br />
plans for school<br />
evacuations and sheltering-in-place.<br />
Wyandotte County is subject to many<br />
potential hazards. Some of <strong>the</strong>se<br />
would require evacuation of<br />
personnel to a safer place or<br />
sheltering <strong>the</strong>m in place. Providing<br />
for <strong>the</strong> health, safety and welfare of<br />
children, teachers and staff are a key<br />
concern. Partner with local school<br />
districts to ensure <strong>the</strong>y have wellprepared<br />
plans for school<br />
evacuations and sheltering in place.<br />
Assist <strong>the</strong>m in <strong>the</strong>ir planning process<br />
by <strong>review</strong>ing <strong>the</strong>ir current plans and<br />
providing suggestions for potential<br />
revisions.<br />
Develop adequate communications<br />
systems among and between<br />
disaster response agencies and <strong>the</strong><br />
EOC. Wyandotte County is subject<br />
to many hazards requiring responses<br />
from multiple disaster response<br />
agencies. For an effective response,<br />
<strong>the</strong>se agencies need to be able to<br />
H 1,2 Hazardous Material On-going,<br />
Open<br />
Ended<br />
H 1,2,3,4 All Hazards On-going,<br />
Open<br />
Ended<br />
Kansas City, Kansas Fire<br />
Department Hazmat Team<br />
Wyandotte County<br />
Emergency Management<br />
Director<br />
H 4 All Hazards On-going Wyandotte county<br />
Emergency Management<br />
Director<br />
Cost: None<br />
Funds: None<br />
Completion Date: Continuous<br />
Cost: NA<br />
Funds: NA<br />
Completion Date: Continuous<br />
Cost: Unknown<br />
Funds: DHS Grant, Local,<br />
combination<br />
Completion Date: 1 – 3 years<br />
4.106
WyCo 44<br />
WyCo 45<br />
WyCo 46<br />
WyCo 47<br />
talk with each o<strong>the</strong>r and to <strong>the</strong><br />
operational EOC. Develop adequate<br />
communications systems for use<br />
between disaster response agencies<br />
and <strong>the</strong> EOC.<br />
Support <strong>the</strong> continuation of Tabletop,<br />
Functional and Full Scale Exercises<br />
and o<strong>the</strong>r training events for<br />
responders and support personnel.<br />
Training and Exercises allow and<br />
prepare responders and support<br />
personnel to be better trained and<br />
better prepared for actual response<br />
situations. Continue supporting<br />
training and exercises for all<br />
responders and support personnel.<br />
Create a method for parents to reach<br />
<strong>the</strong>ir children during disaster<br />
emergencies. Communications<br />
means are almost always<br />
overpowered during disaster<br />
emergencies. The first thing that<br />
parents or guardians want to do<br />
following a disaster or incident<br />
involving <strong>the</strong>ir child(ren) is to<br />
immediately self-dispatch to <strong>the</strong>ir<br />
child’s school or location w<strong>here</strong> <strong>the</strong>y<br />
ultimately tend to add to <strong>the</strong> problem<br />
already occurring. Creation of a<br />
means / method for parents to reach<br />
<strong>the</strong>ir children during disaster<br />
emergencies would relieve some of<br />
<strong>the</strong> parent’s fears and possibly stop<br />
<strong>the</strong>m from going to <strong>the</strong>ir child’s<br />
location and adding to <strong>the</strong> already<br />
existing problem <strong>the</strong>re.<br />
Involve <strong>the</strong> Local Emergency<br />
Planning Committee (LEPC) in all<br />
hazard identification and response /<br />
recovery / mitigation planning.<br />
Wyandotte County has many<br />
potential hazards that could affect<br />
personnel and property. A<br />
coordinated planning effort is<br />
required for all hazard identification<br />
and response / recovery / mitigation<br />
planning. Involve <strong>the</strong> Local<br />
Emergency Planning Committee in<br />
all hazard identification and response<br />
/ recovery / mitigation planning.<br />
Install additional lightning arrestors<br />
on power infrastructure. Lightning<br />
H 1,2,4 All Hazards On-going,<br />
Open<br />
Ended<br />
H 4 All Hazards On-going,<br />
Open<br />
Ended<br />
H 4 All Hazards On-going,<br />
Open<br />
Ended<br />
H 1,2 Lightning,<br />
Utility/Infrastructure Failure<br />
On-going<br />
Wyandotte County<br />
Emergency management<br />
Director<br />
Wyandotte County<br />
Emergency Management<br />
DIrector<br />
Wyandotte County<br />
Emergency Management<br />
Director<br />
Board of Public Utilities and<br />
o<strong>the</strong>r utility companies<br />
Cost: None<br />
Funds: None<br />
Completion Date: Continuous<br />
Cost: NA<br />
Funds: NA<br />
Completion Date: Continuous<br />
Cost: NA<br />
Funds: None<br />
Completion Date: Continuous<br />
Cost: Unknown<br />
Funds: Grant, Local, Combination<br />
4.107
WyCo 48<br />
WyCo 49<br />
WyCo 50<br />
occurs with almost every storm and<br />
often occurs outside of, and several<br />
miles from, <strong>the</strong> main storm area.<br />
Lightning has been <strong>the</strong> cause of<br />
major damages to infrastructure and<br />
loss of lives throughout <strong>the</strong> United<br />
States. Install additional lightning<br />
arrestors on power infrastructure<br />
Public Education: Energy<br />
consumption during extreme heat<br />
events; cooling center locations and<br />
free fan programs. Drastic increases<br />
in energy consumption during<br />
extreme heat events present a<br />
demand on energy services that<br />
could (and often does) result in loss<br />
of energy services. Cooling centers<br />
are normally opened for public use<br />
during extreme heat events.<br />
Low-income families may qualify for<br />
<strong>the</strong> Salvation Army’s Free Fan<br />
Program. Provide public messages<br />
thru all media and o<strong>the</strong>r sources on<br />
ways to conserve energy<br />
consumption. Publicize thru media<br />
and o<strong>the</strong>r sources: information on<br />
ways for <strong>the</strong> public to keep cool<br />
locations and information on cooling<br />
centers information on <strong>the</strong> Salvation<br />
Army’s Free Fan Program<br />
Public Education: Home<br />
Improvement programs to conserve<br />
water and electricity usage to help<br />
eliminate hardship on <strong>the</strong><br />
infrastructure and lower consumption<br />
during peak demand periods. A<br />
dramatically increased usage of<br />
water and electric services during<br />
peak demand periods often causes<br />
an overall degradation of services<br />
that could lead to a complete loss of<br />
services and system failure.<br />
Advertise / publicize home<br />
improvement programs that will help<br />
conserve water and electricity usage<br />
such as <strong>the</strong> installation of high<br />
efficiency HVAC systems, installation<br />
of high energy savings windows and<br />
insulation programs.<br />
Public Education: More aggressive<br />
smoke detector installation. Home<br />
and building fires occur daily<br />
H 3 Extreme Temperatures,<br />
Utility/Infrastructure Failure<br />
On-going,<br />
Open<br />
Ended<br />
H 3 Utility/Infrastructure Failure On-going,<br />
Open<br />
Ended<br />
H 3 Wildfire On-going,<br />
Open<br />
Ended<br />
Wyandotte County<br />
emergency Management<br />
Director<br />
Wyandotte County<br />
Emergency Management<br />
Director<br />
Kansas City, Kansas fire<br />
Department, Bonner<br />
Springs, Edwardsville, and<br />
Completion Date: 1 – 5 years<br />
Cost: NA<br />
Funds: None<br />
Completion Date: Continuous<br />
Cost: NA<br />
Funds: NA<br />
Completion Date: Continuous<br />
Cost: Unknown<br />
Funds: Unknown<br />
Completion Date: Continuous<br />
4.108
WyCo 51<br />
WyCo 52<br />
WyCo 53<br />
throughout <strong>the</strong> Metro Area. Smoke<br />
(loss of oxygen) is <strong>the</strong> # 1 Killer<br />
during a fire. Smoke alarms lead to<br />
saved lives. Research avenues for<br />
funding additional smoke detectors<br />
to provide to citizens. Local Fire<br />
Departments partner with o<strong>the</strong>r<br />
agencies (Neighborhood Groups,<br />
Volunteer Groups, etc.) to distribute<br />
and install smoke detectors in more<br />
homes. Media campaign on <strong>the</strong> need<br />
for smoke detectors.<br />
Upgrade / Expand / Improve Storm<br />
water Management Systems.<br />
Development and re-development of<br />
communities creates a continual<br />
need to assess current storm water<br />
management systems and to<br />
upgrade / expand / improve <strong>the</strong>m as<br />
needed. Continue to assess current<br />
storm water management systems<br />
and upgrade / expand / improve<br />
<strong>the</strong>m as needed with available<br />
funding.<br />
Develop / Improve Early Warning<br />
System—work with Media Partners /<br />
Outlets. Personnel in Wyandotte<br />
County receive <strong>the</strong>ir severe wea<strong>the</strong>r<br />
and o<strong>the</strong>r warnings by several<br />
different methods. Not all warning<br />
methods are consistent with each<br />
o<strong>the</strong>r During emergencies it’s very<br />
important for all warning agencies to<br />
speak consistently, with one voice,<br />
so that individuals don’t receive<br />
conflicting messages and not know<br />
how or when to respond to <strong>the</strong> given<br />
emergency. Partner with all media<br />
outlets, <strong>the</strong> National Wea<strong>the</strong>r Service<br />
and o<strong>the</strong>r KC Metro counties to<br />
ensure that <strong>the</strong> same, clear,<br />
consistent message is being sent out<br />
by everyone<br />
Special Events Planning. T<strong>here</strong> is a<br />
need for seminars / training on<br />
planning for special event venues to<br />
include all hazard events, emergency<br />
response plans and continuity of<br />
business plans. Coordinate<br />
meetings with all large venues:<br />
Kansas Speedway, Capitol Federal<br />
Park at Sandstone, Community<br />
H 1,2 Flood On-going,<br />
Open<br />
Ended<br />
Lake Quivira FD, Fire<br />
Inspector<br />
UG Water Pollution Control,<br />
Public Works Departments<br />
of Bonner springs,<br />
Edwardsville, and Lake<br />
Quivira<br />
H 3,4 All Hazards On-going Wyandotte county<br />
Emergency Management<br />
Director<br />
H 1,2,4 All Hazards On-going Wyandotte County<br />
emergency Management<br />
Director<br />
Cost: Unknown<br />
Funding: Grant, Local, combination<br />
Completion Date: Continuous<br />
Cost: NA<br />
Funds: None<br />
Completion Date: Continuous<br />
Cost: $5,000<br />
Funds: Grants, Donations, Local<br />
Completion Date: TBD<br />
4.109
WyCo 54<br />
WyCo 55<br />
America Ballpark, Schlitterbahn’s<br />
Vacation Village, Sunflower Golf<br />
Course, Wyandotte County Park,<br />
The Legends, George Meyen,<br />
Renaissance Festival, Lakeside<br />
Speedway, Camp Naish, Parks,<br />
Museums, Sporting KC and o<strong>the</strong>rs to<br />
discuss <strong>the</strong> need for all hazard<br />
preparedness, event emergency<br />
response plans and continuity of<br />
business planning for all special<br />
events. 2. Design program and<br />
delivery methods based on needs<br />
identified at coordination meeting. 3.<br />
Identify subject matter presenters 4.<br />
Schedule date, time and location of<br />
<strong>the</strong> training 5. Promote training<br />
through <strong>the</strong> Media, Chamber of<br />
Commerce, City officials, and direct<br />
mail 6. Conduct training. 7. Evaluate<br />
effectiveness of <strong>the</strong> training through<br />
<strong>the</strong> use of surveys and one-on-one<br />
interviews.<br />
Invite critical organizations to be part<br />
of <strong>the</strong> KC TEW for advance<br />
notification of terrorist activity in <strong>the</strong><br />
area. Coordinated intelligence<br />
information systems providing law<br />
enforcement organizations in<br />
Wyandotte County a common<br />
operating picture of local threats is a<br />
necessity in preserving <strong>the</strong> safety,<br />
security and well-being of all<br />
individuals. Invite critical<br />
organizations to be part of <strong>the</strong> KC<br />
TEW for advance notification of<br />
terrorist activity in <strong>the</strong> area.<br />
Develop / maintain an Early Warning<br />
System to notify <strong>the</strong> Public on<br />
potential Hazardous Materials (Haz-<br />
Mat) dangers integrating it with<br />
existing early warning capabilities.<br />
Wyandotte County has a large<br />
number of hazardous <strong>material</strong>s<br />
facilities along with numerous hazmat<br />
shipments via both road and rail<br />
traveling in and through <strong>the</strong> county<br />
on a regular daily basis. A serious<br />
haz-mat incident could occur from<br />
any one of <strong>the</strong>se sources, resulting<br />
in an immediate need to notify/warn<br />
<strong>the</strong> public. Research potential<br />
H 1,2,3,4 Terrorism/Agri-Terrorism On-going Wyandotte County Sheriff’s<br />
Chief & KCK Police<br />
Department<br />
H 1,2,4 Hazardous Materials On-going Wyandotte County<br />
emergency Management<br />
Director<br />
Cost: NA<br />
Funds: None<br />
Completion Date: Continuous<br />
Cost: Unknown<br />
Funds: DHS Grant, Local,<br />
Combination<br />
Completion Date: 1 – 3 years<br />
4.110
WyCo 56<br />
WyCo 57<br />
WyCo 58<br />
WyCo 59<br />
hazardous <strong>material</strong>s early warning<br />
systems for notification of <strong>the</strong> public<br />
in partnership with local first<br />
responders and private hazardous<br />
<strong>material</strong>s companies. Acquire and<br />
maintain an appropriate early<br />
warning system for haz-mat Integrate<br />
new warning system with existing<br />
warning system.<br />
Develop / maintain an Early Warning<br />
System to notify Hospitals and o<strong>the</strong>r<br />
critical facilities of impending hazard<br />
threats integrating it with existing<br />
early warning capabilities.<br />
Wyandotte County currently has no<br />
existing Early Warning System to<br />
notify both Hospitals and o<strong>the</strong>r<br />
critical facilities of impending hazard<br />
threats. Research / develop and<br />
maintain an Early Warning System to<br />
notify Hospitals and o<strong>the</strong>r critical<br />
facilities of impending hazard threats.<br />
• Integrate new warning system with<br />
existing warning system.<br />
Implement usage of electronic signs<br />
on highways to notify motorists of<br />
wea<strong>the</strong>r warnings and o<strong>the</strong>r hazards.<br />
Currently, electronic highway<br />
signage is used primarily to warn<br />
motorists of working highway<br />
accidents; expected delays due to<br />
<strong>the</strong>se accidents or large events,<br />
detours for road construction, etc.<br />
• Use of electronic highway signage<br />
for notification of motorists on<br />
wea<strong>the</strong>r warnings and o<strong>the</strong>r hazards<br />
could prevent <strong>the</strong>ir potential injury or<br />
death. Partner, plan and coordinate<br />
with KDOT and MODOT for use of<br />
<strong>the</strong>ir electronic highway signs to<br />
notify motorists of wea<strong>the</strong>r warnings<br />
and o<strong>the</strong>r potential hazards that<br />
could involve <strong>the</strong>m.<br />
Update All Flood Insurance Maps.<br />
Updated flood insurance maps are<br />
required in order for insurance<br />
companies to write and provide flood<br />
insurance for homeowners and<br />
businesses in flood-prone areas.<br />
Notify all homeowners and<br />
businesses in flood prone areas of<br />
<strong>the</strong>ir possible risk. Currently <strong>the</strong>re<br />
H 1,2,4 All Hazards On-going Wyandotte County<br />
Emergency Management<br />
Director<br />
H 1,2, 4 All Hazards On-going Wyandotte County<br />
Emergency Management<br />
Director<br />
H 1,2 Flood On-going UG Planning Department<br />
Director<br />
H 1,2 Flood On-going UG Planning and Zoning<br />
Department; Bonner<br />
springs and Edwardsville<br />
Cost: Unknown<br />
Funds: DHS Grant, Local,<br />
combination<br />
Completion Date: 1 – 3 years<br />
Cost: Unknown<br />
Funds: DHS Grant, Local,<br />
Combination<br />
Completion Date: 6 month – 1 ½<br />
years<br />
Cost: Unknown<br />
Funds: Unknown<br />
Completion Date: 6 months – 1 ½<br />
years.<br />
Cost: Unknown<br />
Funds: Unknown<br />
Completion Date: 1 – 2 years<br />
4.111
WyCo 60<br />
WyCo 61<br />
WyCo 62<br />
are several businesses and many<br />
homeowners located in <strong>the</strong> flood<br />
prone areas of Wyandotte County<br />
who are unaware of <strong>the</strong>ir flood risks<br />
and completely uninsured for any<br />
flood losses. Establish an on-going<br />
program to notify all property owners<br />
(homes and businesses) in <strong>the</strong> flood<br />
prone areas of Wyandotte County of<br />
<strong>the</strong>ir possible risks due to flooding<br />
and encourage <strong>the</strong>m to obtain<br />
adequate flood insurance. “On-going<br />
program” means an on-going<br />
notification plan to notify future<br />
potential new property owners of<br />
flood prone properties of <strong>the</strong>ir risks<br />
prior to, or upon transfer of property<br />
ownership to <strong>the</strong>m.<br />
Ensure that <strong>the</strong> Wyandotte County<br />
Emergency Management<br />
Department has a complete, wellplanned<br />
and coordinated Disaster<br />
Response Plan that is continually<br />
<strong>review</strong>ed and annually updated.<br />
Wyandotte County Emergency<br />
Management is responsible for<br />
timely warning and notification to <strong>the</strong><br />
public about impending disasters and<br />
<strong>the</strong> coordination of resource support<br />
activities to ensure a well-organized,<br />
efficient response prior to / during /<br />
following disasters. Continually<br />
<strong>review</strong> and annually update <strong>the</strong><br />
Emergency Management<br />
Department’s Disaster Response<br />
Plan to ensure a timely, efficient and<br />
coordinated response prior to /<br />
during / following disasters.<br />
Create Redundancy in Utility<br />
Distribution Lines (Loops) and Key<br />
Equipment at Production Facilities.<br />
Redundancy in utility distribution<br />
lines and key equipment at<br />
production facilities is required for<br />
and ensures continual service to<br />
customers.<br />
Require fixed haz-mat facilities to<br />
have <strong>the</strong>ir emergency response<br />
procedures coordinated with <strong>the</strong> city<br />
and county first responder plans.<br />
Facilities generally have internal<br />
procedures and plans ready to<br />
H 1,2 All Hazards On-going,<br />
Open<br />
Ended<br />
H 1,2 Utility/Infrastructure Failure On-going,<br />
Open<br />
Ended<br />
Planning Departments<br />
Wyandotte County<br />
Emergency Management<br />
Director<br />
Board of Public Utilities<br />
(BPU), KCP&L, Operations<br />
H 1,4 Utility/Infrastructure Failure On-going, Wyandotte County<br />
Emergency Management<br />
Director<br />
Cost: NA<br />
Funds: None<br />
Completion Date: Continuous<br />
Cost: Unknown<br />
Funds: Grant, Local, combination<br />
Completion Date: 3 – 5 years,<br />
continuous <strong>the</strong>reafter.<br />
Cost: Unknown<br />
Funds: Unknown<br />
Completion Date: 1+ years<br />
4.112
WyCo 63<br />
WyCo 64<br />
implement in <strong>the</strong> event of an<br />
emergency with a hazardous<br />
chemical. While <strong>the</strong> emergency<br />
responders (fire, police, ambulance)<br />
are aware of <strong>the</strong> chemicals through<br />
<strong>the</strong> Tier II reporting and facility tours,<br />
specific procedures are not shared<br />
between <strong>the</strong> agencies. T<strong>here</strong>fore<br />
during an emergency, expectations<br />
could likely differ between <strong>the</strong><br />
responding agencies and <strong>the</strong> facility<br />
personnel.<br />
Develop/Update Debris Management<br />
Plan to include Memorandums Of<br />
Understanding (MOU’s) for debris<br />
removal between Wyandotte County<br />
and outside / local agencies with<br />
equipment available for this,<br />
establish collection areas and free<br />
mulch program. During most<br />
wea<strong>the</strong>r events some type of debris<br />
resulting from <strong>the</strong> event is usually<br />
produced. During many large events,<br />
a tremendous amount of debris is<br />
often generated blocking roads and<br />
causing extensive damages.<br />
Management, removal and<br />
disposition of this debris requires<br />
careful preplanning, effective<br />
responses and, quite often, written<br />
MOUs with o<strong>the</strong>r agencies. Develop<br />
/ Update an effective Debris<br />
Management Plan for Wyandotte<br />
County to include: MOU’s with o<strong>the</strong>r<br />
agencies, jurisdictions and preidentified<br />
contractors --Identification<br />
of several pre-selected debris<br />
collection sites across <strong>the</strong> --county<br />
for use during <strong>the</strong>se events (with<br />
MOU’s if required) --Establishment of<br />
a countywide “Free Mulch Program”<br />
* Review / Update <strong>the</strong> countywide<br />
Debris Management Plan and all<br />
MOUs on a regularly scheduled<br />
basis.<br />
Create and train volunteer search &<br />
rescue teams to support Professional<br />
First Responders. In large searches<br />
or o<strong>the</strong>r large emergencies,<br />
professional First Responders<br />
resources may need to be supported<br />
by additional personnel. The support<br />
M 4 All Hazards On-going UG Public Works<br />
Department with Wyandotte<br />
County Emergency<br />
Management Director<br />
M 1,2 All Hazards On-going Emergency Management<br />
Director<br />
Cost: Unknown<br />
Funds: Local, Grant<br />
Completion Date: Continuous<br />
Cost: $5,000<br />
Funds: CCP Grant<br />
Completion Date: Continuous<br />
4.113
WyCo 65<br />
WyCo 66<br />
of a trained, certified, team of<br />
volunteers may be necessary.<br />
Wyandotte County, under <strong>the</strong><br />
direction of Emergency<br />
Management, currently has<br />
two trained volunteer groups, <strong>the</strong><br />
Community Emergency Response<br />
Team (CERT) and <strong>the</strong> Radio<br />
Amateur Civil Emergency Service<br />
(RACES). The purpose of this<br />
Mitigation Action is to discuss with<br />
<strong>the</strong> Professional First Responder<br />
organizations on how <strong>the</strong>se<br />
volunteer teams can support <strong>the</strong>ir<br />
operations.<br />
Public Education: Hailstorm Damage<br />
Prevention. Citizens need to be<br />
aware of <strong>the</strong> dangers in<strong>here</strong>nt in<br />
hailstorms. Citizens need to know<br />
how to protect <strong>the</strong>mselves and <strong>the</strong>ir<br />
property from, prepare for, respond<br />
to and recover from damaging<br />
hailstorms. Proper knowledge,<br />
individual preparation and care can<br />
prevent personal injury, limit property<br />
damage and avoid potential deaths.<br />
Provide public education talks,<br />
seminars, meetings with various<br />
groups, planning sessions, training,<br />
exercises, etc. Provide information<br />
thru websites; cell phones;<br />
newspapers, <strong>the</strong>atres, billboards,<br />
fliers, PSAs, television ads and o<strong>the</strong>r<br />
multimedia sources, Provide<br />
educational <strong>material</strong>s to schools,<br />
hospitals, senior citizen centers,<br />
long-term care facilities, business &<br />
industry and individuals.<br />
Identify and develop a list of those<br />
areas susceptible to explosive fires,<br />
such as grain elevators, etc., and<br />
map <strong>the</strong>m. Explosive fires from<br />
areas such as grain elevators, etc.,<br />
present a special and dangerous<br />
challenge to first responders and<br />
o<strong>the</strong>rs. Identification and knowledge<br />
of <strong>the</strong>se locations along with some<br />
prior planning before an incident<br />
occurs could very well provide for a<br />
much safer overall response.<br />
Identify and develop a list of those<br />
areas susceptible to explosive fires,<br />
M 3 Hailstorm On-going,<br />
Open<br />
Ended<br />
M 1,2 Wildfire On-going,<br />
Open<br />
Ended<br />
Emergency Management<br />
Director<br />
Wyandotte County<br />
emergency Management<br />
Director<br />
Cost: Depends on magnitude of<br />
public education program being<br />
conducted.<br />
Funds: Grants, Local, combination<br />
Completion Date: Continuous<br />
Cost: Unknown<br />
Funds: DHS Grant, Local,<br />
combination<br />
Completion Date: 1 – 3 years <strong>the</strong>n<br />
continuous.<br />
4.114
WyCo 67<br />
WyCo 68<br />
WyCo 69<br />
WyCo 70<br />
such as grain elevators, etc., map<br />
<strong>the</strong>m and do some pre-response<br />
planning.<br />
Develop a Memorandum of<br />
Understanding (MOU) with/between<br />
area Building Departments for Post-<br />
Disaster Damage Assessment.<br />
Well-trained and qualified individuals<br />
are needed following every disaster<br />
for post-disaster damage<br />
assessment. An MOU with <strong>the</strong>ir<br />
departments would provide more<br />
assurance of <strong>the</strong>se individuals being<br />
made available by <strong>the</strong>ir agencies for<br />
post-disaster damage assessments.<br />
Map all geological hazards<br />
countywide and make this<br />
information available. T<strong>here</strong> are<br />
several geological hazards in<br />
Wyandotte County that need to<br />
be fur<strong>the</strong>r identified and mapped<br />
such as landslide, land subsidence,<br />
and earthquake. Knowing and having<br />
this information available will assist<br />
us all in countywide planning effort.<br />
Identify and map specific<br />
underground void space areas prone<br />
to collapse failure and limit future<br />
development in <strong>the</strong>se areas.<br />
Numerous underground void space<br />
areas prone to collapse failure exist<br />
Throughout Wyandotte County.<br />
• Identifying, mapping and limiting<br />
future development in <strong>the</strong>se areas<br />
would be cost-effective, potentially<br />
prevent injuries and limit future<br />
damages due to void spaces<br />
collapsing / cave-ins.<br />
Preparedness Planning for Small<br />
Business Owners. Information /<br />
training is needed for small business<br />
owners on planning for all hazards,<br />
preparation of small business<br />
emergency response plans and<br />
continuity of business plans.<br />
Coordinate meetings with Bonner<br />
Springs, Edwardsville, Lake Quivira<br />
and KCK, Chambers of Commerce,<br />
SBA, and o<strong>the</strong>rs as later identified to<br />
discuss <strong>the</strong> need for business<br />
preparedness planning Design a<br />
program and delivery methods based<br />
M 4 All Hazards On-going,<br />
Open<br />
Ended<br />
M 1,2 All Hazards On-going,<br />
Open<br />
Ended<br />
M 1,2 Land Subsidence On-going,<br />
Open<br />
Ended<br />
Wyandotte County<br />
Emergency Management<br />
Director<br />
Wyandotte County<br />
Emergency Management<br />
Director/GIS Director<br />
Wyandotte County<br />
Emergency Management<br />
Director/GIS Director<br />
M 3 All Hazards On-going Wyandotte County<br />
Emergency Management<br />
Director<br />
Cost: NA<br />
Funds: None<br />
Completion Date: 6 month – 1<br />
years <strong>the</strong>n continuous<br />
Cost: Unknown<br />
Funds: DHS Grant, Local,<br />
Combination<br />
Completion Date: Continuous<br />
Cost: Unknown<br />
Funds: DHS Grant, Local,<br />
Combination<br />
Completion Date: Continuous<br />
Cost: $5,000<br />
Funds: Grants, Corporate Sponsors<br />
Completion Date: TBD<br />
4.115
WyCo 71<br />
WyCo 72<br />
WyCo 73<br />
WyCo 74<br />
WyCo 75<br />
on needs identified at coordination<br />
meeting. Identify corporate sponsors<br />
Identify subject matter presenters<br />
Schedule date, time, and location for<br />
<strong>the</strong> training Promote training through<br />
<strong>the</strong> Chamber of Commerce, City<br />
officials, business organizations, and<br />
direct mail. Conduct training<br />
Evaluate effectiveness of <strong>the</strong> training<br />
through <strong>the</strong> use of surveys and oneon-one<br />
interviews<br />
Develop and Enforce Building<br />
Restrictions in Dam Inundation<br />
Areas. When dams are<br />
compromised and break, <strong>the</strong> areas<br />
below <strong>the</strong>m are subject to being<br />
inundated, resulting in buildings and<br />
structures being ei<strong>the</strong>r damaged or<br />
destroyed. Personnel living below<br />
<strong>the</strong>se dams are also at great risk of<br />
injury or<br />
death.<br />
Upgrade power distribution systems<br />
through replacement of porcelain<br />
insulators and switches with polymer<br />
components. Porcelain insulators<br />
and switches are not a durable as<br />
those made with polymer<br />
components.<br />
Install and maintain fog warning<br />
flashing lights and flash flood<br />
warnings (lights and signs) in lowlying<br />
and flood prone areas.<br />
Wyandotte County often experiences<br />
fog and flash flooding events.<br />
• Motorists do not drive carefully<br />
enough during ei<strong>the</strong>r type of event<br />
and often are involved in accidents<br />
or driving <strong>the</strong>ir vehicles into high<br />
water.<br />
Create a website to allow citizens to<br />
communicate with each o<strong>the</strong>r.<br />
Following a large disaster with<br />
numerous families relocated from <strong>the</strong><br />
disaster area, many of <strong>the</strong> families<br />
will find <strong>the</strong> need to communicate<br />
with <strong>the</strong>ir former neighbors and<br />
friends from that area.<br />
Encourage <strong>the</strong> use of flashing fire<br />
alarms for <strong>the</strong> hearing impaired.<br />
Wyandotte County has many home<br />
and business fires. Normal fire<br />
M 1,2 Dam and Levees On-going Wyandotte County<br />
Emergency Management<br />
Director<br />
M 1,2 Utility/Infrastructure Failure On-going Board of Public Utilities and<br />
KCPL<br />
M 1,2 Flood On-going Wyandotte County<br />
Emergency Management<br />
Director<br />
M 4 All Hazards On-going,<br />
Open<br />
Ended<br />
M 1,2 Wildfire On-going,<br />
Open<br />
Ended<br />
Wyandotte County<br />
Emergency Management<br />
Director<br />
KCK Fire Department,<br />
Bonner springs and<br />
Edwardsville FD’s<br />
Cost: Unknown<br />
Funds: None<br />
Completion Date: 1 – 5 years<br />
Cost: Unknown<br />
Funds: Local Utility Funded, Grant<br />
Completion Date: Unknown<br />
Cost: Unknown<br />
Funds: Grant, Local, Combination<br />
Completion Date: Unknown<br />
Cost: Na<br />
Funds: None<br />
Completion Date: Continuous<br />
Cost: Unknown<br />
Funds: Individual Business or<br />
homeowner<br />
Completion Date: Continuous<br />
4.116
WyCo 76<br />
WyCo 77<br />
WyCo 78<br />
WyCo 79<br />
WyCo 80<br />
alarms cannot always be heard by<br />
<strong>the</strong> hearing impaired individual.<br />
Encourage businesses to use<br />
flashing fire alarms for <strong>the</strong> hearing<br />
impaired. Encourage homeowners to<br />
use flashing fire alarms for <strong>the</strong><br />
hearing impaired.<br />
Require Back-up Generators / Backup<br />
Power for all Critical Facilities.<br />
Critical Facilities around <strong>the</strong> county<br />
have been designated as such and,<br />
due to <strong>the</strong>ir critical role, need to<br />
operate continually regardless of <strong>the</strong><br />
situation. Identify those critical<br />
facilities without back-up generators<br />
or back-up power. Partner with<br />
<strong>the</strong>se critical sites to ensure <strong>the</strong>y do<br />
obtain back-up power.<br />
Prepare procedures and sites for<br />
decontamination. Decontamination<br />
of personnel and property is required<br />
during certain hazardous <strong>material</strong>s<br />
incidents. Identify potential<br />
decontamination sites around <strong>the</strong><br />
county. Prepare procedures and<br />
sites for decontamination.<br />
Use Traffic simulations to predict<br />
evacuation problems and plan for<br />
<strong>the</strong>se problems. Routes chosen for<br />
evacuation need to be de-conflicted<br />
to <strong>the</strong> greatest extent possible.<br />
Develop a plan for using school<br />
buses and public transportation to<br />
move people to shelters following an<br />
incident / disaster. During an<br />
incident or disaster people normally<br />
need to be moved out of <strong>the</strong> affected<br />
area to a safer location. Movement of<br />
personnel to safer locations and<br />
sheltering during an incident is<br />
necessary for <strong>the</strong>ir personal health,<br />
safety and well-being. Partner and<br />
plan with local school districts and<br />
public transportation agencies to<br />
develop a viable plan for transporting<br />
people to shelters.<br />
Identify potential landslide areas and<br />
install reinforcement barriers to<br />
nullify potential disasters and protect<br />
infrastructure. Wyandotte County<br />
has several potential landslide areas<br />
throughout <strong>the</strong> county due to its<br />
M 1,2 All Hazards On-going Wyandotte County<br />
Emergency Management<br />
Director<br />
M 1,2 Hazardous Materials On-going Wyandotte County<br />
Emergency Management<br />
Director<br />
M 1 All Hazards On-going Wyandotte County<br />
Emergency Management<br />
Director<br />
M 1,2 All Hazards On-going Wyandotte County<br />
Emergency Management<br />
Director<br />
M 1,2 Landslides On-Going Wyandotte County<br />
Emergency Management<br />
Director, Public Works<br />
Departments of <strong>the</strong> UG,<br />
Bonner springs and<br />
Edwardsville<br />
Cost: Unknown<br />
Funds: Unknown<br />
Completion Date: 1 – 2 years<br />
Cost: Unknown<br />
Funds: Unknown<br />
Completion Date: 1 – 2 years<br />
Cost: Unknown<br />
Funds: Unknown<br />
Completion Date: 1 – 2 years<br />
Cost: Unknown<br />
Funds: Unknown<br />
Completion Date: 6 months – 1 ½<br />
years.<br />
Cost: Unknown<br />
Funds: State, Federal, Local,<br />
Combination<br />
Completion Date: Unknown.<br />
4.117
WyCo 81<br />
WyCo 82<br />
WyCo 83<br />
natural geography and previous land<br />
developments / improvements.<br />
T<strong>here</strong> are some roads and structures<br />
located in/near <strong>the</strong>se potential<br />
landslide areas. Do not allow<br />
building in <strong>the</strong>se areas. Redirect<br />
water with specific planting of deep<br />
root vegetation to mitigate landslides.<br />
Install reinforcement barriers as<br />
needed.<br />
Provide an early warning system on<br />
streams with <strong>the</strong> most potential for<br />
flood damage to structures.<br />
Wyandotte County historically has<br />
had flooding issues along streams<br />
and rivers—mainly resulting in<br />
flooded structures. T<strong>here</strong> is no early<br />
warning system for <strong>the</strong>se streams.<br />
Identify streams that historically have<br />
had flooding issues. Research<br />
potential solutions for early warning<br />
systems for <strong>the</strong>se streams. Install<br />
early warning systems on streams<br />
identified as having a potential<br />
for flooding.<br />
Identify Critical Businesses & Public<br />
Service Agencies and work to ensure<br />
<strong>the</strong>ir Continuity of Operations during<br />
/ following a disaster. Critical<br />
business and public service<br />
agencies, including volunteer<br />
agencies, providing services to <strong>the</strong><br />
public must continue regardless of<br />
initial, temporary disruption by an<br />
incident or disaster. The health,<br />
safety and welfare of <strong>the</strong> public<br />
depend on continuation of <strong>the</strong>se<br />
services. Identify and work with<br />
critical businesses and public service<br />
agencies to assist <strong>the</strong>m in<br />
developing and maintaining a<br />
Continuity of Operations Plan<br />
(COOP) for <strong>the</strong>ir business/agency to<br />
ensure <strong>the</strong>ir continued operations<br />
and support of <strong>the</strong> public.<br />
Create / Develop and Maintain a<br />
Plan for pet and livestock rescue,<br />
care and sheltering during / following<br />
disasters. Pets and livestock are an<br />
integral part of many families and<br />
most families do not want to leave<br />
<strong>the</strong>m in order to seek shelter for<br />
M 1,2 Flood On-going Wyandotte County<br />
Emergency Management<br />
Director<br />
M 4 All Hazards On-going Wyandotte County<br />
Emergency Management<br />
Director<br />
M 2 All Hazards On-going Wyandotte County<br />
Emergency Management<br />
Director<br />
Cost: Unknown<br />
Funds: HMGP, DHS Grants, Local<br />
Completion Date: 3 – 5 years<br />
Cost: Unknown<br />
Funds: HMGP, DHS Grants, Local,<br />
Individual business/agency funding<br />
or donations, combination<br />
Completion Date: 2 – 5 years<br />
Cost: Unknown<br />
Funds: DHS Grants, Local, State,<br />
Federal<br />
Completion Date: 2 – 5 years<br />
4.118
WyCo 84<br />
<strong>the</strong>mselves. The health, safety and<br />
welfare of <strong>the</strong> public and <strong>the</strong>ir pets /<br />
livestock depend on planned support<br />
services for both by local<br />
government and o<strong>the</strong>r agencies.<br />
Develop Emergency Action Plan for<br />
<strong>the</strong> dam on <strong>the</strong> Kansas City Kansas<br />
Community College’s (KCKCC)<br />
campus. If <strong>the</strong> dam is breached, city<br />
drains would probably not hold all <strong>the</strong><br />
water and State Avenue could flood<br />
disrupting traffic and businesses’ in<br />
<strong>the</strong> area. A potential vehicle accident<br />
(or o<strong>the</strong>r type of accident) caused by<br />
<strong>the</strong> dam breaching could even result<br />
in personal injury or death.<br />
M 1,2 Dam and Levees On-going KCK Community college Cost: Unknown<br />
Funds: Grants, Local, combination<br />
Completion Date: 1 – 1 ½ years<br />
WyCo 85<br />
WyCo 86<br />
Develop / Review / Update<br />
Emergency Action Plans (EAPs) for<br />
High & Significant Hazard Dams in<br />
Wyandotte County. Should one of<br />
<strong>the</strong>se dams be breached or<br />
overtopped during extremely<br />
heavy rainfall, <strong>the</strong> area below and<br />
downstream of <strong>the</strong> dam would flood,<br />
potentially causing loss of life and/or<br />
extensive property damage, along<br />
with <strong>the</strong> disruption of traffic and<br />
businesses in <strong>the</strong> area. An EOP with<br />
well-developed emergency<br />
notification procedures and<br />
regularly updated contact numbers<br />
for persons living or owning property<br />
below <strong>the</strong>se dams is paramount to<br />
<strong>the</strong> safety of all.<br />
Public Education—Encourage <strong>the</strong><br />
use of grounded outlets and surge<br />
protectors in homes and businesses.<br />
Improperly grounded electrical<br />
outlets and equipment may result in<br />
fires, equipment damage, personal<br />
injuries and potential loss of life.<br />
Equipment unprotected from power<br />
surges may be damaged, destroyed<br />
or can result in fires which could also<br />
result in <strong>the</strong> loss of life. Provide<br />
public education talks, seminars,<br />
meetings with various groups,<br />
planning sessions, training,<br />
exercises, etc. Provide information<br />
thru websites; cell phones;<br />
newspapers, <strong>the</strong>atres, billboards,<br />
M 1,2 Dams and Levees On-going Owner of Dam – KCK<br />
Community College<br />
M 3 Wildfire On-going,<br />
Open<br />
Ended<br />
Local Fire Departments<br />
Cost: Minimal<br />
Funds: Individual owner<br />
Completion Date: 6 months after<br />
start of plan<br />
Cost: Depends on magnitude of<br />
public education program being<br />
conducted<br />
Funds: Grants, Local, combination<br />
Completion Date: Continuous<br />
4.119
WyCo 87<br />
WyCo 88<br />
fliers, PSAs, television ads and o<strong>the</strong>r<br />
multimedia sources, Provide<br />
educational <strong>material</strong>s to schools,<br />
hospitals, senior citizen centers,<br />
long-term care facilities, business &<br />
industry and individuals<br />
Adopt / Enforce Codes to bury utility<br />
lines in future developments.<br />
Conventional power pole power lines<br />
are subject to damages / outages<br />
from storms, vehicular accidents,<br />
falling tree limbs and o<strong>the</strong>r means<br />
that place <strong>the</strong>m out of service for<br />
varying lengths of time. The lives,<br />
health and well-being of many<br />
citizens across <strong>the</strong> county<br />
require continual use of utility<br />
services to stay healthy / remain<br />
alive. Existing utility lines require<br />
continual maintenance to keep in<br />
operation. Adopt and enforce codes<br />
in all three cities (Bonner Springs,<br />
Edwardsville, Kansas City, Kansas)<br />
requiring builders / developers to<br />
bury all utility lines in future<br />
developments.<br />
Enforce Strict Compliance on Dam<br />
and Levee Deficiencies <strong>found</strong> during<br />
periodic inspections. T<strong>here</strong> are 15<br />
HIGH Hazard Dams and 3<br />
Significant Hazard Dams in<br />
Wyandotte County. The High Hazard<br />
Dams have residences / businesses<br />
below <strong>the</strong>m. Many of <strong>the</strong> High<br />
Hazard Dams DO NOT have <strong>the</strong><br />
required Emergency Action Plans<br />
(EAP) or <strong>the</strong>ir EAP is completely<br />
outdated. (Alert / Notification rosters<br />
are an integral part of <strong>the</strong> plan and<br />
much-needed during a dam failure or<br />
potential failure.) T<strong>here</strong> are 4 Levees<br />
providing 100-year or greater<br />
protection with over $2 billion in<br />
protected structures and $8 billion in<br />
contents/o<strong>the</strong>r protected assets<br />
behind <strong>the</strong>m. T<strong>here</strong> is also one<br />
agricultural levy (Wolcott). Organize<br />
a program to monitor all dam and<br />
levee inspections, <strong>the</strong>ir results<br />
(deficiencies <strong>found</strong>) and corrective<br />
actions taken. Work with dam and<br />
levy owners throughout <strong>the</strong> process<br />
M 1,2 Utility/Infrastructure Failure On-going,<br />
Open<br />
Ended<br />
M 1,2 Dam and Levee On-going,<br />
Open<br />
Ended<br />
Planning and Zoning<br />
Departments for each city<br />
Wyandotte County<br />
Emergency Management<br />
Director<br />
Cost: Unknown<br />
Funds: Grants, Local, Private<br />
developer funding<br />
Completion Date: Continuous<br />
Cost: Unknown<br />
Funds: HMGP, Local, owner of dam<br />
Completion Date: 6 months – 1<br />
year, than Continuous<br />
4.120
WyCo 89<br />
to ensure all corrective actions are<br />
planned / taken. Assist levy owners<br />
in pursuing potential funding to<br />
correct deficiencies thru various<br />
sources—local, state and federal.<br />
• Determine method to induce strict<br />
and full compliance on deficiencies<br />
by <strong>the</strong> owners of all High / Significant<br />
Hazard dams and potential results<br />
for non-compliance—monetary or<br />
o<strong>the</strong>rwise.<br />
Establish locations for emergency<br />
morgues. A mass fatality disaster in<br />
Wyandotte County could far exceed<br />
one local morgue’s capability.<br />
• Pre-identified emergency morgue<br />
locations would assist in a mass<br />
fatality response effort. Meet with all<br />
stakeholders to research and identify<br />
potential emergency morgue<br />
locations Develop a detailed,<br />
coordinated plan for <strong>the</strong> use of <strong>the</strong>se<br />
facilities / locations with proper<br />
MOUs / MOAs as required.<br />
M 3 All Hazards On-going Wyandotte County<br />
Emergency Management<br />
Director, County Coroner<br />
Cost: Unknown<br />
Funds: DHS Grants, Local, State<br />
Completion Date: 1 – 3 years,<br />
Wyandotte County – Wyandotte Health Department<br />
Action ID Action/Description Priority Goal(s)<br />
Hazard Addressed Status Responsible Entity Estimated Cost and funding Source<br />
Addressed<br />
WyHealth 1 Public Education and information:<br />
Public Health. Prior to a public<br />
health emergency and throughout,<br />
<strong>the</strong> public needs to know what<br />
actions to take to prepare for <strong>the</strong><br />
event, prevent illness, and care for<br />
<strong>the</strong> ill. T<strong>here</strong> are a myriad of ways<br />
to disseminate information. A<br />
multimedia approach is required to<br />
reach all venues including special<br />
populations. Newspapers, <strong>the</strong>atres,<br />
billboards, fliers, PSAs, television<br />
ads, educational <strong>material</strong>s for<br />
schools, meetings with various<br />
groups, presentations, and more<br />
are all necessary to get <strong>the</strong> right<br />
message out to citizens.<br />
H 3 All Hazards On-going,<br />
Continuous<br />
Health Department Cost: $100,000<br />
Funds: CDC<br />
Completion Date: Continuous as<br />
needed<br />
WyHealth 2<br />
Develop Protocols for delivering<br />
vaccine / providing vaccinations.<br />
Adequately administering timely<br />
H 1,2,3 Major Disease Outbreak On-going Wyandotte county<br />
Emergency Management<br />
Cost: Unknown<br />
Funds: CDC, KDHE, Local<br />
4.121
vaccinations to individuals prior to<br />
or during a pandemic or o<strong>the</strong>r major<br />
health incident is paramount to <strong>the</strong><br />
overall health, safety and livelihood<br />
of <strong>the</strong> community. Meet with<br />
primary stakeholders and develop a<br />
detailed plan for administering<br />
and/or tracking vaccine /<br />
vaccinations throughout <strong>the</strong><br />
county. Continued Public Health<br />
surveillance to fur<strong>the</strong>r detect <strong>the</strong><br />
potential need for distribution of<br />
vaccine and vaccinations. Public<br />
Education to citizens on required<br />
protective measures / vaccinations<br />
Department, Local Hospitals<br />
& Health Providers, UG and<br />
volunteer personnel<br />
Completion Date: On-going<br />
Wyandotte County – Wyandotte County Sheriff<br />
Action ID Action/Description Priority Goal(s)<br />
Hazard Addressed Status Responsible Entity Estimated Cost and funding Source<br />
Addressed<br />
WySheriff 1 Wyandotte County, Kansas<br />
Sheriff’s Department Adult/Juvenile<br />
Detention Center Evacuation Plan.<br />
The average day <strong>the</strong> detention<br />
centers have a combined<br />
population of approx. 350 inmates.<br />
In <strong>the</strong> event of a natural or man<br />
made compromise of <strong>the</strong> facility,<br />
<strong>the</strong>re needs to be a plan to move<br />
and house <strong>the</strong> inmates. On going<br />
<strong>review</strong> of resources<br />
(communications, and<br />
transportation) also<br />
conducting tabletop exercises.<br />
H 1,2 All Hazards On-going,<br />
Open<br />
Ended<br />
Sheriff Department Chief Cost: Existing Staff<br />
Funds: NA<br />
Completion Date: Continuous<br />
Wyandotte County – Muli-jurisdictional<br />
Action ID Action/Description Priority Goal(s)<br />
Hazard Addressed Status Responsible Entity Estimated Cost and funding Source<br />
Addressed<br />
MultiJ 1 Wildfire public education. Before L 3 Wildfire Deleted Kansas Forest Service and Cost: $500 per workshop<br />
peak conditions and occurrences of<br />
local Fire Departments Funds: KS Forest Service and<br />
wildfire danger occur, homeowners<br />
Grants<br />
living in <strong>the</strong> wildland/urban interface<br />
Completion Date: Deleted<br />
4.122
MultiJ 2<br />
MultiJ 3<br />
need to have <strong>the</strong> knowledge to<br />
prepare <strong>the</strong>ir homes and property to<br />
be as safe and defendable as<br />
possible. Educational workshops<br />
could be delivered for homeowners,<br />
associations and/or in rural<br />
communities to provide<br />
homeowners with property in <strong>the</strong><br />
wildland/urban interface information<br />
on steps that <strong>the</strong>y can take on <strong>the</strong>ir<br />
own to defend <strong>the</strong>ir property from<br />
wildfire. Existing programs such as<br />
<strong>the</strong> FIREWISE Communities USA<br />
program could be used to<br />
supplement local knowledge and<br />
expertise provided by <strong>the</strong> local fire<br />
departments and <strong>the</strong> Kansas Forest<br />
Service in providing <strong>the</strong> needed<br />
information at <strong>the</strong>se workshops<br />
Increase public and fire department<br />
training on wildland urban interface<br />
fires. Wildfires in <strong>the</strong> Wildland<br />
Urban Interface (WUI), or any<br />
location w<strong>here</strong> a fire can spread<br />
from vegetation (wildland fuels) to<br />
man-made (urban fuels) presents a<br />
unique and potentially very<br />
dangerous set of hazards to <strong>the</strong><br />
firefighters that respond to <strong>the</strong>m as<br />
well as <strong>the</strong> public that live in areas<br />
w<strong>here</strong> such fires occur. Several<br />
trainings could be implemented to<br />
increase <strong>the</strong> general, tactical, and<br />
safety knowledge of anyone living<br />
in or responding to fires in <strong>the</strong> WUI.<br />
Topics from tactical decision<br />
making to assistance with preincident<br />
assessments of properties<br />
that may be impacted should be<br />
covered in <strong>the</strong>se training sessions<br />
Reduce hazardous fuels in<br />
prioritized wildfire risk areas. Past<br />
experience has shown that <strong>the</strong>re is<br />
a threat of having wildland/urban<br />
interface (WUI) fires in <strong>the</strong> planning<br />
area. The WUI is any location<br />
w<strong>here</strong> a fire can spread from<br />
vegetation (wildland fuels) to manmade<br />
(urban fuels). As part of<br />
<strong>the</strong> planning process, a wildfire<br />
hazard assessment has been<br />
conducted to begin to identify those<br />
L 1,2,3 Wildfire Deleted Kansas Forest Service Cost: $30 per student per training<br />
session<br />
Funds: KS Forest Service, State,<br />
Federal<br />
Completion Date: Deleted<br />
L 1,2 Wildfire Deleted Kansas Forest Service and<br />
Local Fire Departments<br />
Cost: $85 per acre<br />
Funds: KS Forest Service, Local FDs<br />
Completion Date: Deleted<br />
4.123
locations that might be in need of<br />
some hazard fuel reduction work.<br />
In those areas that have been<br />
prioritized as posing a threat for<br />
wildland/urban interface fires, fuel<br />
reduction should be used to create<br />
fuel breaks between <strong>the</strong> wildland<br />
fuels and <strong>the</strong> urban environment.<br />
Methods used would consist of<br />
mechanical removal of fuel,<br />
mechanical thinning of fuel, and/or<br />
prescribed fire.<br />
Wyandotte County – Board of Public Utilities<br />
Action ID Action/Description Priority Goal(s)<br />
Hazard Addressed Status Responsible Entity Estimated Cost and funding Source<br />
Addressed<br />
BPU 1 Upgrade UG and BPU’s Radio<br />
System. The current radio system<br />
is obsolete and is an unsupported<br />
system for Public Safety between<br />
BPU and <strong>the</strong> Unified Government.<br />
The radio system is scheduled for<br />
replacement in 2014, which<br />
includes Wyandotte County’s<br />
critical support services.<br />
H 4 All Hazards On-going Director – Electric<br />
Transmission and<br />
Distribution Kansas City<br />
Board of Public Utilities<br />
Cost: $20 to $25 million<br />
Funds: Grants, Local<br />
Completion Date: 2 nd Qtr, 2014<br />
Wyandotte County – City of Bonner Springs<br />
Action ID Action/Description Priority Goal(s)<br />
Hazard Addressed Status Responsible Entity Estimated Cost and funding Source<br />
Addressed<br />
BSprings 1 Provide detention along Mission<br />
Creek north of Kaw Dr. (K-32) near<br />
Shawnee Rock. When Mission<br />
Creek floods, <strong>the</strong> floodwaters crest<br />
Kaw Dr. (K-32) near 121 st Street.<br />
The floodwaters cause damage to<br />
<strong>the</strong> businesses in <strong>the</strong> area. The<br />
H 1,2 Flood On-going City of Bonner Springs, City<br />
Planner/Floodplain<br />
Administrator, Public Works<br />
Director<br />
Cost: Unknown<br />
Funds: FEMA, Local, combination<br />
Completion Date: 1 – 3 years<br />
4.124
BSprings 2<br />
BSprings 3<br />
BSprings 4<br />
floodwaters also cause o<strong>the</strong>r issues<br />
downstream in Edwardsville,<br />
Kansas. Upon completion of an<br />
engineering study, it may be<br />
possible to detain Mission<br />
Creek, near <strong>the</strong> entrance to<br />
Shawnee Rock, in times of flood.<br />
Currently, <strong>the</strong> creek flows into three<br />
large tubes. By controlling <strong>the</strong><br />
output of <strong>the</strong>se tubes, floodwater<br />
would be detained in <strong>the</strong> natural<br />
basin outlined roughly by 118th<br />
Street and Steventon Dr<br />
/Metropolitan Ave. These roads<br />
would flood, but <strong>the</strong> areas <strong>the</strong>y<br />
serve could be accessed from <strong>the</strong><br />
north. The detention of <strong>the</strong><br />
floodwater would result in keeping<br />
Kaw Dr. (K-32) from flooding and<br />
prevent flooding issues<br />
downstream.<br />
Continue Compliance with NFIP.<br />
To reduce flood losses and<br />
maintain city’s standing with FEMA.<br />
Continuous monitoring of floodplain<br />
development Participate in <strong>the</strong><br />
NFIP Community Rating System<br />
Promote Flood Insurance at severe<br />
wea<strong>the</strong>r seminars, preparedness<br />
seminars, safety fairs, and severe<br />
wea<strong>the</strong>r week activities.<br />
Provide NOAA wea<strong>the</strong>r radios to all<br />
physical businesses in Bonner<br />
Springs and Edwardsville. Severe<br />
wea<strong>the</strong>r strikes quickly and without<br />
warning. We should enhance <strong>the</strong><br />
early warning capability for all<br />
hazards. By providing NOAA<br />
wea<strong>the</strong>r radios to all businesses<br />
throughout <strong>the</strong> community, we can<br />
provide early warning of severe<br />
wea<strong>the</strong>r and o<strong>the</strong>r hazards to<br />
members of <strong>the</strong> business<br />
community and <strong>the</strong>ir employees.<br />
Mounting camera at Fire<br />
Department for storm Monitoring.<br />
Severe wea<strong>the</strong>r strikes quickly and<br />
without warning. Wea<strong>the</strong>r spotters<br />
from <strong>the</strong> fire department are limited<br />
by terrain and o<strong>the</strong>r factors. By<br />
mounting a camera capable of tilt,<br />
zoom, and pan, (TZP) to <strong>the</strong><br />
H 1,2,4 Flood On-going,<br />
Open<br />
Ended<br />
H 1,2, 4 Hailsotrm, Lightning,<br />
Tornado, Windstorm,<br />
Winter Storm<br />
H 1,2 Hailsotrm, Lightning,<br />
Tornado, Windstorm,<br />
Winter Storm<br />
Delete – no<br />
longer an<br />
active<br />
project<br />
On-going<br />
Bonner springs Planning<br />
Department, City Planning<br />
Director<br />
Bonner Springs Project<br />
Manager<br />
Bonner springs Fire<br />
Department, Fire Chief, and<br />
WYCO Emergency<br />
Management Director<br />
Cost: NA<br />
Funds: NA<br />
Completion Date: Continuous<br />
Cost: $10,530<br />
Funds: FEMA, Civic Org., NOAA<br />
(quantity discount)<br />
Completion Date: Delete<br />
Cost: Unknown<br />
Funds: Unknown<br />
Completion Date: 1 year<br />
4.125
BSprings 5<br />
BSprings 6<br />
BSprings 7<br />
antenna at <strong>the</strong> Bonner Springs Fire<br />
Department, it would enhance <strong>the</strong><br />
early warning capabilities of <strong>the</strong><br />
county and city.<br />
Continuity of Operations.<br />
Continuity of Operations plans are<br />
needed for <strong>the</strong> City of Bonner<br />
Springs Government Identify cost<br />
for plan development. 2. Identify<br />
funding source. 3. Emergency<br />
Management will coordinate with<br />
<strong>the</strong> City of Bonner Springs on<br />
implementation of this project upon<br />
receipt of funding. 4. Select<br />
contractor. 5. Schedule and<br />
conduct kick-off meeting 6. Conduct<br />
departmental interviews. 7. Develop<br />
draft plan. 8. Present <strong>the</strong> draft plan<br />
and solicit input from departments<br />
and elected officials. 9. Make<br />
revisions and finalize plan. 10.<br />
Develop exercise. 11. Exercise <strong>the</strong><br />
plan 12. Conduct After Action and<br />
make any necessary changes to<br />
<strong>the</strong> plan.<br />
Family Preparedness Planning.<br />
Citizens need all hazard<br />
preparedness planning information<br />
to know how to respond in <strong>the</strong><br />
event of a hazard event.<br />
Metropolitan Emergency Mgmt<br />
Committee (MEMC) Citizens<br />
Preparedness Committee will<br />
develop preparedness website to<br />
include family preparedness<br />
procedures and family planning<br />
templates. Make copies available<br />
of <strong>the</strong> planning templates. Develop<br />
family preparedness handbook<br />
Promote family preparedness<br />
planning with brochures, website<br />
and community outreach. Develop<br />
all hazards planning template in<br />
multiple languages Evaluate<br />
program outcomes with surveys<br />
and website<br />
Turn Around Don’t Drown. The<br />
public needs information/reminders<br />
not to drive through floodwaters on<br />
roadways. 1. Adopt Turn Around<br />
Don’t Drown program 2. Develop<br />
promotional brochures, media<br />
H 1,4 All Hazards On-going City of Bonner springs City<br />
Manager<br />
H 1,2,3 All Hazards On-going City of Bonner Springs, City<br />
Manager<br />
H 1,2,3 Flood On-going City of Bonner Springs Fire<br />
Department Fire Chief<br />
Cost: $15,000<br />
Funds: TBD<br />
Completion Date: TBD<br />
Cost: $50,000<br />
Funds: DHS Grant, UASI Homeland<br />
Security Funds<br />
Completion Date: TBD<br />
Cost: $2,000<br />
Funds: Corporate Sponsors<br />
Completion Date: TBD<br />
4.126
BSprings 8<br />
BSprings 9<br />
BSprings 10<br />
releases, and street signs. 3.<br />
Promote program to driver<br />
education in schools. 4. Place signs<br />
along roadways that are prone to<br />
flash flooding<br />
Spring Creek Storm Drainage<br />
Improvements. Improvements are<br />
needed to address flooding that<br />
occurs as a result of inadequate<br />
drainage. Replace and construct<br />
additional culverts to reduce<br />
flooding. 1. Culvert under railroad<br />
Spur Road: replace with double<br />
14’X14’ RCB- $386,600<br />
2. Culvert under railroad tracks:<br />
construct an additional 14’X12’<br />
RCB- $414,850 3. Culvert under<br />
Front Street: construct an additional<br />
14’X12’ RCB $284,150 4. Culvert<br />
under Second Street: construct an<br />
additional 14’X12’ RCB $108,700<br />
Total Cost: $1,194,300<br />
Spring Creek Storm Drainage<br />
/Springdale Avenue to Morse<br />
Avenue. Stream bank<br />
improvements are needed in Spring<br />
Creek located along Pratt Street<br />
and Morse Avenue and in <strong>the</strong> park.<br />
New triple 14’ X 6’ RCB under<br />
Morse Avenue Grading <strong>the</strong> channel<br />
and constructing gabion basket<br />
walls at several locations along <strong>the</strong><br />
creek within <strong>the</strong> park to stabilize <strong>the</strong><br />
creek banks and help prevent<br />
fur<strong>the</strong>r erosion Gabion basket walls<br />
will be constructed adjacent to <strong>the</strong><br />
house at 300 block of Pratt Street to<br />
prevent fur<strong>the</strong>r bank erosion Turf<br />
reinforcement matrix will also be<br />
constructed to stabilize <strong>the</strong><br />
channel slopes in o<strong>the</strong>r locations<br />
Identify funding Place project out for<br />
bid Select contractor Execute<br />
contract Work completed City of<br />
Bonner Springs or designee would<br />
oversee project<br />
Chemical Warning System<br />
Procedures. The public needs<br />
warning information during some<br />
chemical events that could impact<br />
<strong>the</strong>m. Develop procedures to<br />
activate <strong>the</strong> Emergency Alert<br />
M 1,2 Flood On-going City of Bonner Springs<br />
Public Works Director<br />
M 1,2 Flood On-going City of Bonner Springs<br />
Public Works Director<br />
M 1,2,4 Hazardous Materials On-going City of Bonner Springs<br />
Police Chief and Fire Chief<br />
Cost: $1,194,300<br />
Funds: TBD<br />
Completion Date: TBD<br />
Cost: $782,700<br />
Funds: FEMA HMGP, o<strong>the</strong>r Grants<br />
Completion Date: TBD<br />
Cost: None<br />
Funds: None<br />
Completion Date: TBD<br />
4.127
BSprings 11<br />
BSprings 12<br />
BSprings 13<br />
System (EAS) and National<br />
Wea<strong>the</strong>r Service (NWS) All Hazard<br />
Radios for chemical events.<br />
Coordinate meeting with Bonner<br />
Springs Police, Fire, EMS,<br />
Wyandotte County Emergency<br />
Management, NWS, and Union<br />
Pacific Railroad to discuss<br />
implementation of <strong>the</strong> NWS<br />
HazCollect notification system.<br />
Develop implementation policies<br />
and procedures and distribute to<br />
necessary departments Exercise<br />
<strong>the</strong> program Review After Action<br />
and make any necessary changes<br />
Stream Bank Set Back ordinance.<br />
Controlling uses and developments<br />
along stream banks can aid in<br />
lessening impacts as a result of<br />
flooding. An ordinance controlling<br />
development along streambank<br />
would allow vegetation within<br />
setback areas minimizing<br />
streambank erosion as well as<br />
providing natural filters to improve<br />
groundwater quality. Research<br />
stream bank set back ordinances<br />
and determine if this tool should<br />
be implemented in <strong>the</strong> City of<br />
Bonner Springs. 1. Coordinate<br />
meeting with Bonner Springs,<br />
Natural Resources Conservation<br />
Service and Emergency<br />
Management 2. Review existing<br />
cities and sample ordinances<br />
3. Determine if <strong>the</strong>re is a need in<br />
Bonner Springs for a stream bank<br />
set back ordinance.<br />
Storm Drainage Study. Storm<br />
drainage improvements are needed<br />
along Wolf Creek watershed.<br />
Provide Hydrologic and hydraulic<br />
analysis and storm drainage<br />
improvement design along Wolf<br />
Creek watershed.<br />
1. finalize area to be studied<br />
2. select contractor<br />
3. execute contract<br />
4. <strong>review</strong> preliminary findings<br />
5. present study to elected officials<br />
Clark Area Drainage.<br />
Improvements are needed to<br />
M 1,2,4 Flood On-going City of Bonner Springs City<br />
Planning Director<br />
L 2 Flood On-going City of Bonner Springs City<br />
Planning Director<br />
Cost: None<br />
Funds: None<br />
Completion Date: TBD<br />
Cost: $100,000<br />
Funds: FEMA HMGP, County<br />
Completion Date: TBD<br />
L 2 Flood On-going City of Bonner Springs Cost: $1,1753,000<br />
4.128
BSprings 14<br />
address <strong>the</strong> undersized drainage<br />
features in <strong>the</strong> Clark Area Drainage<br />
Watershed. Phase A: Add RCB<br />
under K-7 ramp $174,000 Phase B:<br />
Main line system-Emerson to<br />
Warner $851,000 Phase C: Ditch<br />
re-alignment west of Emerson<br />
$6,600 Phase D: Main line system-<br />
Morse to upstream of Emerson<br />
$388,000 Phase E: Cornell Avenue<br />
system $35,000 Phase F: Emerson<br />
Avenue to Morse Avenue $92,000<br />
Phase G: Northwest of Morse<br />
Avenue $206,000 Total $1,753,000<br />
Shelter-in-Place. A program is<br />
needed to educate individuals on<br />
how to receive notification<br />
regarding a chemical incident and<br />
necessary actions to take. Develop<br />
Shelter-in-Place program. Develop<br />
brochures and kits for sheltering-inplace.<br />
Educate and train residents<br />
on how to shelter-in-place<br />
Public Works Director<br />
L 3 Hazardous Materials On-going City of Bonner Springs<br />
Police Chief and Fire Chief<br />
Funds: TBD<br />
Completion Date: TBD<br />
Cost: $7,500<br />
Funds: TBD<br />
Completion Date: TBD<br />
Wyandotte County – City of Edwardsville<br />
Action ID Action/Description Priority Goal(s)<br />
Hazard Addressed Status Responsible Entity Estimated Cost and funding Source<br />
Addressed<br />
Edward 1 Continued Compliance with <strong>the</strong><br />
National Flood Insurance Program.<br />
The City of Edwardsville joined <strong>the</strong><br />
emergency phase of <strong>the</strong> National<br />
Flood Insurance Program in 1975<br />
and converted to <strong>the</strong> regular<br />
program in 1978. The City remains<br />
in good standing enforcing <strong>the</strong><br />
current floodplain management<br />
ordinance. The City of Edwardsville<br />
intends to continue full compliance<br />
with <strong>the</strong> National Flood Insurance<br />
Program. As such, <strong>the</strong> City will<br />
coordinate with <strong>the</strong> study contractor<br />
during <strong>the</strong> process to produce<br />
digital flood insurance rate maps<br />
H 1,2 Flood On-going,<br />
Open<br />
Ended<br />
City of Edwardsville, City<br />
Administrator<br />
Cost: NA<br />
Funds: NA<br />
Completion Date: Continuous<br />
4.129
Edward 2<br />
Edward 3<br />
Edward 4<br />
(DFIRM). After <strong>the</strong> DFIRM maps<br />
are produced, <strong>the</strong> City will update<br />
<strong>the</strong> floodplain management<br />
ordinance as appropriate.<br />
Install Generator at Community<br />
Center. The Edwardsville<br />
Community Center currently serves<br />
as a storm/emergency shelter for<br />
<strong>the</strong> citizens of Edwardsville.<br />
However, <strong>the</strong>re is currently no<br />
generator to use as an alternate<br />
power source. A permanent<br />
generator is needed at this location<br />
to be able to adequately shelter<br />
citizens that seek refuge in this<br />
facility. Purchase and install a<br />
generator at <strong>the</strong> Edwardsville<br />
Community Center<br />
Development of <strong>the</strong> North Fire<br />
Station into a remote facility that will<br />
support continuation of City<br />
Services. All city facilities (Police,<br />
Fire, City Hall and Community<br />
Center) are centralized within <strong>the</strong><br />
sou<strong>the</strong>rn portion of <strong>the</strong> City. A<br />
significant disaster event could cut<br />
off all services and city operations,<br />
including public safety services.<br />
The City currently has an<br />
unmanned fire station located in <strong>the</strong><br />
nor<strong>the</strong>rn portion of <strong>the</strong> City that can<br />
serve as an emergency operations<br />
center for <strong>the</strong> city should such an<br />
event occur. Renovation of <strong>the</strong><br />
facility, purchase and installation of<br />
necessary equipment to make <strong>the</strong><br />
North Fire Station operable for all<br />
services of <strong>the</strong> city.<br />
Floodprone property acquisition.<br />
Properties along 98th Street flood<br />
have flooded several times in <strong>the</strong><br />
past. Implement a voluntary<br />
purchase project to purchase up to<br />
5 properties along 98 th street. After<br />
purchase, <strong>the</strong> properties would be<br />
demolished and <strong>the</strong> land<br />
maintained as open space.<br />
H 1,2 Extreme Temperatures,<br />
Earthquake, Flood, Utility<br />
Failure, Windstorm, Winter<br />
Storm<br />
On-going<br />
City of Edwardsville, City<br />
Administrator<br />
M 4 All Hazards On-going City of Edwardsville, Fire<br />
Department Chief<br />
L 1,2 Flood Deleted City of Edwardsville, City<br />
Administrator’s Office<br />
Cost: $13,500<br />
Funds: FEMA HMGP, Local, In-Kind<br />
Completion Date: 1 year<br />
Cost: TBD<br />
Funds: DHS Grants, Assistance to<br />
Firefighters Grant<br />
Completion Date: 3 years<br />
Cost: Unknown<br />
Funds: FEMA, Local<br />
Completion Date: Deleted<br />
4.130
Wyandotte County – City of Lake Quivira<br />
Action ID Action/Description Priority Goal(s)<br />
Hazard Addressed Status Responsible Entity Estimated Cost and funding Source<br />
Addressed<br />
LQuivira 1 Emergency Power Back-up<br />
Generator for City Hall Facility.<br />
T<strong>here</strong> is currently no power back-up<br />
system for City Hall that houses <strong>the</strong><br />
Fire, Police and administration<br />
departments. Thus emergency<br />
lighting, communications<br />
equipments are door openers are<br />
all vulnerable during power<br />
outages. T<strong>here</strong> are frequent power<br />
outages in <strong>the</strong> area because of<br />
Westar Energy’s western<br />
substation. Installation of a single<br />
property sized generator behind<br />
City Hall as a single unit could<br />
support all existing circuits.<br />
H 1,2 Lightning, Tornado,<br />
Utility/Infrastructure Failure,<br />
Winter Storm, Windstorm<br />
Deleted,<br />
merged<br />
with<br />
Johnson<br />
County<br />
LQuivira 2<br />
City of Lake Quivira Police<br />
Department<br />
Cost: $25,000<br />
Funds: Local, FEMA<br />
Completion Date: 1 – 2 years<br />
LQuivira 2<br />
Emergency Evacuation Exit for<br />
gated residential community<br />
H 1,2 Hazardous Materials Deleted,<br />
merged<br />
with<br />
Johnson<br />
County,<br />
LQuivira 1<br />
City of Edwardsville, City<br />
Administrator’s Office<br />
Cost: $13,500<br />
Funds: FEMA HMGP, Local, In-Kind<br />
Completion Date: 1 year<br />
Wyandotte County – Wyandotte Nation<br />
Action ID Action/Description Priority Goal(s)<br />
Hazard Addressed Status Responsible Entity Estimated Cost and funding Source<br />
Addressed<br />
WyNation 1 Reconstruction of <strong>the</strong> existing<br />
deteriorated walkways, steps, and<br />
handicapped accessible ramps at<br />
<strong>the</strong> cemetery of <strong>the</strong> Huron Nation.<br />
The Cemetery of The Huron Nation<br />
which not only served as a final<br />
resting place for <strong>the</strong> Native<br />
Americans indigenous to <strong>the</strong> area,<br />
but also countless and in many<br />
cases unnamed Civil War Dead<br />
both Union and Confederate at rest<br />
in <strong>the</strong> heart of <strong>the</strong> community. The<br />
Huron Park and Cemetery are<br />
Landmarks on <strong>the</strong> National<br />
Register of Historic Sites. T<strong>here</strong> is<br />
an issue with drainage from this<br />
H 1,2 Flood, Landslide On-going Wyandotte Nation Cost: Unknown<br />
Funds: Bureau of Indian Affairs,<br />
HMGP<br />
Completion Date: 1 year after<br />
funding is secured<br />
4.131
elevated plot of land and <strong>the</strong><br />
resulting erosion must be curtailed<br />
to halt erosion and land sinking on<br />
adjacent sidewalks, clogging <strong>the</strong><br />
existing drainage system with silt<br />
and debris from <strong>the</strong> water runoff.<br />
Reconstruction of <strong>the</strong> existing<br />
deteriorated walkways, steps, and<br />
handicapped accessible ramps<br />
incorporating retaining walls and<br />
drainage to channel runoff as<br />
outlined below will halt <strong>the</strong><br />
infiltration of silt and debris entering<br />
<strong>the</strong> cities drainage system.<br />
#1. Cemetery, South East Corner:<br />
Replace existing wooden stairways<br />
and landings with reinforced<br />
concrete and an incorporated<br />
retaining wall and drainage<br />
channel. #2 Cemetery North East<br />
Corner: Replace <strong>the</strong> existing<br />
deteriorated wooden handicapped<br />
accessible ramp and promontory<br />
overlook from <strong>the</strong> East Drive up to<br />
an existing outlook and cemetery<br />
level. Replace with a reinforced<br />
concrete ramp, and existing<br />
promontory overlook. #3 Replace<br />
<strong>the</strong> sinking sections of sidewalk<br />
along <strong>the</strong> driveway on <strong>the</strong> east<br />
side of <strong>the</strong> cemetery and dividing<br />
<strong>the</strong> cemetery from <strong>the</strong> Huron Park.<br />
#4 Re-construct <strong>the</strong> drain located at<br />
<strong>the</strong> base of <strong>the</strong> South East Stairway<br />
of <strong>the</strong> Cemetery alongside <strong>the</strong><br />
driveway.<br />
Wyandotte County – USD 202 Turner Schools<br />
Action ID Action/Description Priority Goal(s)<br />
Hazard Addressed Status Responsible Entity Estimated Cost and funding Source<br />
Addressed<br />
USD202 1 Provide Adequate & accessible<br />
storm shelter area(s) (safe-rooms)<br />
for students, faculty and staff of<br />
Turner Schools. No completely<br />
adequate storm shelter area(s)<br />
(safe-rooms) are currently available<br />
for students, faculty and staff of<br />
Turner Schools. Construct new<br />
H 1,2 Windstorm, Winter Storm,<br />
Tornado<br />
On-going USD 202 Cost: Unknown<br />
Funds: Grant (HMGP), in-kind<br />
Completion Date: 1 year after<br />
funding is secured<br />
4.132
safe-rooms to provide adequate<br />
sheltering in accordance with FEMA<br />
standards (per FEMA 361<br />
guidance) for each Turner USD#<br />
202 school with easy access when<br />
sheltering is required. Retrofit, as<br />
deemed appropriate, those schools<br />
already in existence with saferooms<br />
that may also be used as<br />
school multi-purpose meeting<br />
rooms.<br />
Wyandotte County – USD 204 Bonner/Edwardsville Schools<br />
Action ID Action/Description Priority Goal(s)<br />
Hazard Addressed Status Responsible Entity Estimated Cost and funding Source<br />
Addressed<br />
USD204 1 Camera System Updates and<br />
installation. Currently, we have<br />
internet access to camera systems<br />
at all of <strong>the</strong> buildings. The tech<br />
department has worked with <strong>the</strong><br />
Bonner Springs Police Department<br />
on retrofitting Bonner police cars so<br />
that <strong>the</strong>y could web into <strong>the</strong><br />
cameras any time. Provide<br />
communication between USD #204<br />
tech department and <strong>the</strong> local<br />
police departments on<br />
implementation. Pan, tilt, zoom<br />
camera systems for all exterior<br />
portions of <strong>the</strong> buildings including<br />
<strong>the</strong> athletic facilities equipped so<br />
that emergency personnel will be<br />
able to remote into <strong>the</strong> systems to<br />
view what is currently happening at<br />
<strong>the</strong> site. Key areas within <strong>the</strong><br />
building would also have pan, tilt,<br />
and zoom systems so that <strong>the</strong>se<br />
areas can be viewed. All of <strong>the</strong><br />
camera systems will be able to be<br />
controlled remotely by personnel.<br />
Some of <strong>the</strong> key areas will be <strong>the</strong><br />
entrances, stairways, major<br />
hallways, and cafeterias. <strong>the</strong>y need.<br />
We are interested in working with<br />
<strong>the</strong> Edwardsville police department<br />
and KCK police departments<br />
(Delaware Ridge is in KCK) on<br />
access to <strong>the</strong>ir vehicles as well. We<br />
H 1,2,4 Terrorism On-going USD204, IT Department,<br />
Administration, Local Police<br />
Departments<br />
Cost: $70,000<br />
Funds: Unknown<br />
Completion Date: 4 months after<br />
funding is secured<br />
4.133
USD204 2<br />
need upgrades and new cameras to<br />
help ensure a safe environment in<br />
all of <strong>the</strong> buildings.<br />
Safe Rooms for Schools. No<br />
completely adequate storm shelter<br />
area(s) (safe-rooms) are currently<br />
available for students, faculty and<br />
staff of Bonner / Edwardsville USD#<br />
204 schools. Construct new saferooms<br />
to provide adequate<br />
sheltering in accordance with FEMA<br />
standards (per FEMA 361<br />
guidance) for each Bonner /<br />
Edwardsville USD# 204 school with<br />
easy access when sheltering is<br />
required. Retrofit, as deemed<br />
appropriate, those schools already<br />
in existence with safe-rooms that<br />
may also be used as school multipurpose<br />
meeting rooms.<br />
H 1,2 Windstorm & Tornado On-going USD 204 Cost: Unknown<br />
Funds: HMGP, In-kind<br />
Completion Date: Within 1 year of<br />
project approval<br />
Wyandotte County – USD500 Kansas City Schools<br />
Action ID Action/Description Priority Goal(s)<br />
Hazard Addressed Status Responsible Entity Estimated Cost and funding Source<br />
Addressed<br />
USD500 1 Provide adequate & accessible<br />
storm shelter area(s) (safe-rooms)<br />
for students, faculty and staff of<br />
Kansas City, Kansas USD# 500.<br />
schools. No completely adequate<br />
storm shelter area(s) (safe-rooms)<br />
are currently available for students,<br />
faculty and staff of Kansas City,<br />
Kansas USD# 500 schools.<br />
Construct new safe-rooms to<br />
provide adequate sheltering in<br />
accordance with FEMA standards<br />
(per FEMA 361 guidance) for each<br />
Kansas City, Kansas USD# 500<br />
school with easy access when<br />
sheltering is required. Retrofit, as<br />
deemed appropriate, those schools<br />
already in existence with saferooms<br />
that may also be used as<br />
school multi-purpose meeting<br />
rooms.<br />
H 1,2 Windstorm & Tornado On-going USD500 Cost: Unknown<br />
Funds: HMGP, In-kind match<br />
Completion Date: 1 year after<br />
funding is secured<br />
4.134
Wyandotte County – Kansas State School for <strong>the</strong> Blind<br />
Action ID Action/Description Priority Goal(s)<br />
Hazard Addressed Status Responsible Entity Estimated Cost and funding Source<br />
Addressed<br />
KSSB 1 ADA Community Safe Room. The<br />
student population is multiply<br />
disabled including blindness.<br />
Moving <strong>the</strong>m<br />
around as a group is slow and<br />
cumbersome. The school buildings,<br />
w<strong>here</strong> students spend most of <strong>the</strong>ir<br />
day, were built prior to <strong>the</strong> 1950's<br />
and are not equipped with<br />
reinforced construction required to<br />
provide truly safe protection from<br />
tornadoes or o<strong>the</strong>r severe wea<strong>the</strong>r<br />
related incidents. Currently<br />
hallways are designated as tornado<br />
shelter areas. We do this because<br />
many buildings have no basement .<br />
An ADA Safe Room on <strong>the</strong> main<br />
level would allow us to move <strong>the</strong><br />
students to this area in a short<br />
period of time w<strong>here</strong> <strong>the</strong>y were safe<br />
and w<strong>here</strong> <strong>the</strong>y can be <strong>found</strong> easily<br />
by emergency personnel.<br />
H 1,2 Windstorm, Tornado On-going,<br />
Assessme<br />
nt has<br />
been<br />
complete.<br />
Unified Government, KSSB<br />
Superintendent<br />
Cost: Unknown<br />
Funds: FEMA Grant<br />
Completion Date: 12 – 18 months<br />
KSSB 2<br />
Back up Generator. We have<br />
medically fragile students with<br />
multiple handicaps many of whom<br />
live on site. Loss of power would<br />
expose <strong>the</strong>m to danger from health<br />
risks from lowered temperatures<br />
and safety risks from<br />
exposure to alternative heating<br />
sources like kerosene heaters or<br />
o<strong>the</strong>r exposed flames. Over <strong>the</strong><br />
years during loss or power incidents<br />
<strong>the</strong> students have been at risk. The<br />
campus was originally built in mid<br />
l800’s <strong>the</strong> wiring is antiquated. We<br />
have multiple separate power feeds<br />
into <strong>the</strong> campus. The generator<br />
would allow us to better protect <strong>the</strong><br />
students in <strong>the</strong> event of a major<br />
crisis like an Ice Storm – <strong>the</strong><br />
generator would prevent students<br />
being exposed to dangerous<br />
environments such as loss of heat,<br />
open heaters, kerosene heaters,<br />
H 1,2 Utility Failure, Windstorm,<br />
Winter Storm<br />
On-going<br />
Unified Government, KSSB<br />
Superintendent<br />
Cost: $230,000 total<br />
Funds: FEMA HMGP<br />
Completion Date: 8 – 10 months<br />
4.135
KSSB 3<br />
KSSB 4<br />
inadequate food preparation and<br />
safe food storage. Also because of<br />
<strong>the</strong> location and layout of <strong>the</strong><br />
campus we could be an emergency<br />
housing site for neighbourhood<br />
groups living in <strong>the</strong> vicinity. The<br />
campus could also provide<br />
housing for workers such as utility<br />
workers or medical personnel or<br />
even a quarantine location in <strong>the</strong><br />
event of a medical emergency. For<br />
this level of response all 10 or <strong>the</strong><br />
buildings would be need access to<br />
<strong>the</strong> Back up Generator.<br />
Closed Site Clinic. We are a facility<br />
with medically fragile students<br />
some of whom have multiple<br />
disabilities; <strong>the</strong>refore, we have an<br />
onsite Infirmary with 24/5 staffing.<br />
Because many of <strong>the</strong> students<br />
come from out of state Kansas it is<br />
sometimes difficult to impossible for<br />
<strong>the</strong>m to get immunizations for<br />
things like flu in <strong>the</strong>ir home<br />
communities because <strong>the</strong>y live on<br />
<strong>the</strong> campus during <strong>the</strong> week.<br />
Having vaccine available on<br />
campus would facilitate <strong>the</strong>m<br />
getting <strong>the</strong> proper immunization as<br />
well as providing <strong>the</strong> service to <strong>the</strong><br />
staff. In addition we could provide<br />
<strong>the</strong> same service, in cooperation<br />
with <strong>the</strong> Health Dept. To <strong>the</strong><br />
community neighbors. We propose<br />
having a regular scheduled time for<br />
immunizations on <strong>the</strong> campus<br />
using <strong>the</strong> qualified medical staff.<br />
This could be coordinated with <strong>the</strong><br />
Government Health Department<br />
Mass Notification for intruders,<br />
hazards, natural disasters, bomb<br />
and civil disorder events. This<br />
type of notification systems<br />
proves to be effective for deaf<br />
(visual notice) & for blind (audio)<br />
individuals.<br />
H 1,2 Major Disease Outbreak On-going Unified Government, KSSB<br />
Superintendent<br />
H 1,2,4 All Hazards New School for <strong>the</strong> Blind<br />
Operations Director<br />
Cost: Unknown<br />
Funds: FEMA Grant<br />
Completion Date: On-going<br />
Cost: $800,000<br />
Funds: State, FEMA<br />
Completion Date: 5 year phased<br />
implementation<br />
4.136
KSSB 5<br />
All Hazard Staff & Student<br />
Evacuation Plan/Education.<br />
1. Preparing staff and<br />
students for <strong>the</strong>ir role<br />
in all-hazard<br />
preparedness is<br />
paramount to <strong>the</strong><br />
schools capability to<br />
respond to and recover<br />
from potential hazards.<br />
2. Educating staff &<br />
students about safety,<br />
regulations, and<br />
alternative work site is<br />
ano<strong>the</strong>r safety issue<br />
we could potentially<br />
face.<br />
3. Continue to produce,<br />
update annually and<br />
distribute <strong>the</strong> Crisis<br />
Management<br />
Handbook. This is<br />
used in relation to<br />
local emergency<br />
response teams<br />
training as well as<br />
distributed to ??<br />
groups and school<br />
associations.<br />
4. Help continue to<br />
produce update inserts<br />
for <strong>the</strong> August 1 st start<br />
of school all staff inservice.<br />
H 1,3,4 All Hazards New Crisis Management Team and<br />
Emergency Management<br />
Department<br />
Cost: $185 for 20-40 handbooks<br />
Funds: In structural Operational<br />
Funding<br />
Completion Date: FY 2013 On-going<br />
Wyandotte County – Kansas City Kansas Community College<br />
Action ID Action/Description Priority Goal(s)<br />
Hazard Addressed Status Responsible Entity Estimated Cost and funding Source<br />
Addressed<br />
KCKCC 1 Control of groundwater runoff from<br />
KCKCC Campus. The campus of<br />
KCKCC acts as <strong>the</strong> “drain” for<br />
College Blvd from Parallel to <strong>the</strong><br />
College’s east entrance. Also<br />
draining into this area is <strong>the</strong> Painted<br />
Hills Golf Course runoff and<br />
campus runoff from <strong>the</strong> north side<br />
of campus. All runoff water exits <strong>the</strong><br />
campus on <strong>the</strong> south boundary, just<br />
north of State Avenue. Excessive<br />
M 1,2 Flood On-going KCKCC Buildings and<br />
Grounds Department<br />
Cost: $10,000<br />
Funds: College Funds<br />
Completion Date: 8 months.<br />
4.137
unoff could impact traffic on State<br />
Avenue. The College has an<br />
extensive system of flood control,<br />
including 3 retention ponds. Areas<br />
of concern are <strong>the</strong> sediment buildup<br />
in drainage ditches, old concrete<br />
drains, and erosion at sharp<br />
corners of <strong>the</strong> drainage ditches.<br />
The College is dredging <strong>the</strong> ditch to<br />
<strong>the</strong> final retention pond to remove<br />
sediment. The sediment in o<strong>the</strong>r<br />
ditches is being removed,<br />
especially around riprap. Additional<br />
riprap is being installed at sharp<br />
angles in <strong>the</strong> ditches to reduce<br />
erosion. Drains along Campus Blvd<br />
are to be redone.<br />
Wyandotte County – Rainbow Mental Health<br />
Action ID Action/Description Priority Goal(s)<br />
Hazard Addressed Status Responsible Entity Estimated Cost and funding Source<br />
Addressed<br />
RainbowM 1 Upgrade / Replace <strong>the</strong> Current<br />
Communications System to include<br />
a more reliable, redundant system<br />
and establish a communications<br />
plan with protocols for<br />
communicating both within <strong>the</strong> own<br />
agency and outside to <strong>the</strong><br />
supporting agencies. The Daily<br />
Operations, plus Information,<br />
Warning and Notification of<br />
impending or current emergency<br />
situation(s) within or affecting <strong>the</strong><br />
agency requires <strong>the</strong> ability to<br />
immediately contact and remain in<br />
contact with each o<strong>the</strong>r and those<br />
supporting agencies. Currently,<br />
<strong>the</strong>re are no completely reliable,<br />
immediate means of contacting and<br />
remaining in contact with agency<br />
members and supporting agencies<br />
on a day-to-day basis or during<br />
emergencies. The safety and<br />
welfare of <strong>the</strong> clients and staff are<br />
of utmost priority. Research<br />
redundant means of<br />
communications for <strong>the</strong> facility.<br />
Establish a communications plan<br />
H 4 All Hazards On-going,<br />
Open<br />
Ended<br />
Rainbow Mental Health<br />
Facility, Director of Safety<br />
and Environment<br />
Cost: Unknown<br />
Funds: Local, Grants, Donations<br />
Completion Date: 1 – 1 ½ years,<br />
than continuous.<br />
4.138
RainbowM 2<br />
for <strong>the</strong> facility. Procure, install and<br />
maintain appropriate redundant<br />
communications systems that will<br />
enable communication within and<br />
outside <strong>the</strong> agency in a timely and<br />
continual manner.<br />
Construct Food and Water Storage<br />
Shed / Area. Currently, <strong>the</strong> facility<br />
does not have enough storage to<br />
meet <strong>the</strong> storage needs for both<br />
food (perishable and nonperishable)<br />
and water for 96 hours.<br />
Construct a secure Food and Water<br />
Storage Shed / Area with electricity<br />
to include heating, cooling and<br />
plumbing systems, an intrusion<br />
alarm system and adequate<br />
security lighting.<br />
M 1,2 All Hazards On-going Rainbow Mental Health<br />
Facility, Director of Safety<br />
and Environment<br />
Cost: Unknown<br />
Funds: Local, Grants, donations,<br />
combination<br />
Completion Date: 1 – 2 years<br />
Wyandotte County – University of Kansas Hospital<br />
Action ID Action/Description Priority Goal(s)<br />
Hazard Addressed Status Responsible Entity Estimated Cost and funding Source<br />
Addressed<br />
KUHosp 1 Construct Saferoom as part of new<br />
office complex construction. KU<br />
Hospital has plans to construct a<br />
new office complex within <strong>the</strong> next<br />
5 years. As part of that construction<br />
effort, <strong>the</strong> hospital will consider<br />
incorporating a tornado saferoom to<br />
accommodate patients and staff in<br />
that facility. As part of <strong>the</strong><br />
construction planning, <strong>the</strong> hospital<br />
will determine <strong>the</strong> feasibility of<br />
incorporating <strong>the</strong> construction of a<br />
tornado saferoom in <strong>the</strong> design of<br />
<strong>the</strong> planned office complex. If<br />
determined feasible, <strong>the</strong> hospital<br />
will seek funding for <strong>the</strong> saferoom<br />
through FEMA’s Hazard Mitigation<br />
Grant Program<br />
H 1,2 Windstorm, Tornado On-going University of Kansas<br />
Hospital<br />
Cost: $120 sq ft @ 5 ft per person<br />
Funds: FEMA<br />
Completion Date: Unknown<br />
4.139
Wyandotte County – University of Kansas Medical Center<br />
Action ID Action/Description Priority Goal(s)<br />
Hazard Addressed Status Responsible Entity Estimated Cost and funding Source<br />
Addressed<br />
KUMC 1 Public Education – Shelter<br />
Locations. This action is needed<br />
to educate faculty, staff and<br />
visitors of <strong>the</strong> shelter locations<br />
on campus. The University of<br />
Kansas Medical Center is a<br />
complex institution with<br />
many buildings built in close<br />
quarters to each o<strong>the</strong>r which can<br />
create confusion to visitors and<br />
even staff on what to do in case<br />
of an emergency requiring<br />
shelter. This problem will be<br />
solved in a variety of ways<br />
including: implementing <strong>the</strong><br />
Alertus unit in case of disaster<br />
(natural or man made), updated<br />
tornado shelter<br />
signs and emergency maps. It<br />
will also be worked on by putting<br />
information (located on <strong>the</strong><br />
attachment) on <strong>the</strong> KUMC Web<br />
Site and by sending out periodic<br />
e-mails.<br />
M 3 Windstorm, Winter Storm,<br />
Tornado<br />
Completed University Office of<br />
Compliance and <strong>the</strong><br />
Environment, Health &<br />
Safety Office<br />
Cost: $50,000<br />
Funds: Department Funds<br />
Completion Date: Completed<br />
KUMC 2<br />
KUMC 3<br />
Acquire audio and visual<br />
emergency equipment for<br />
exterior and interior grounds on<br />
campus. The campus is located<br />
in an urban environment and is<br />
an open campus made up of<br />
older buildings. Currently <strong>the</strong>re<br />
is no exterior or interior PA<br />
system to warn students, staff,<br />
patients, visitors, and faculty of<br />
<strong>the</strong> multitude of emergencies we<br />
could have on campus. This is<br />
needed for timely notification of<br />
<strong>the</strong> entire campus community.<br />
Conduct regular emergency<br />
preparedness drills for higher<br />
education students, staff, and<br />
faculty, including fire drills and<br />
tornado drills. Action is needed<br />
to properly prepare all campus<br />
members for emergencies that<br />
could happen on campus. Also,<br />
for jurisdictional collaboration<br />
with various first responders.<br />
H 1,2,4 All Hazards New University Emergency<br />
Management<br />
Coordinator<br />
H 1,3,4 All Hazards New University Emergency<br />
Management<br />
Coordinator<br />
Cost: $50,000+<br />
Funds: Grants and Internal<br />
Funding<br />
Completion Date: Approximately<br />
2 years.<br />
Cost: $2,500<br />
Funds: Internally funded<br />
Completion Date: less than one<br />
year<br />
4.140
KUMC 4<br />
Create Saferoom at school and<br />
public Building<br />
H 1,2 Tornado, Windstorm New University Emergency<br />
Management<br />
Coordinator<br />
Cost: $100,000+<br />
Funds: Grants and Internal<br />
funding<br />
Completion Date: 5 years<br />
Wyandotte County – Fairfax Drainage District<br />
Action ID Action/Description Priority Goal(s)<br />
Hazard Addressed Status Responsible Entity Estimated Cost and funding Source<br />
Addressed<br />
FairfaxDD 1 Floodwall Improvements at <strong>the</strong><br />
Quindaro Power Plant owned by<br />
BPU. The US Corps of Engineers<br />
Feasibility Study completed in 2006<br />
determined that <strong>the</strong> concrete<br />
floodwall protecting <strong>the</strong> BPU/<br />
Quindaro Power Plant has a<br />
significant risk of failure when <strong>the</strong><br />
Missouri River approaches <strong>the</strong> top<br />
of <strong>the</strong> floodwall. The problem can<br />
be solved by streng<strong>the</strong>ning or<br />
replacing sections of <strong>the</strong> floodwall.<br />
H 1,2 Flood, Dam & Levee On-going Fairfax Drainage District<br />
General Manager<br />
Cost: $9million<br />
Funds: USACE, 65%, Local 35%<br />
Completion Date: 5 - 10 years<br />
FairfaxDD 2<br />
Financial Assistance in meeting<br />
FEMA requirements relating to<br />
levee 100-year certification.<br />
FEMA requires certification to be<br />
completed within two years of<br />
November 2010 Action is needed<br />
to insure continued participation<br />
in <strong>the</strong> National / Federal Flood<br />
Insurance Program. Partner with<br />
<strong>the</strong> Corps of Engineers to<br />
perform <strong>the</strong> study and data<br />
collection.<br />
H 1,2 Flood, Dam & Levee Completed Fairfax Drainage District Cost: $500,000<br />
Funds: Local, Federal<br />
Completion Date: Completed<br />
Wyandotte County – Kaw Valley Drainage District<br />
Action ID Action/Description Priority Goal(s) Hazard Addressed Status Responsible Entity Estimated Cost and funding Source<br />
4.141
KVDD 1<br />
KVDD 2<br />
Provide adequate communications<br />
& warning system(s) for Kaw Valley<br />
Drainage District (KVDD). No<br />
completely adequate<br />
communications and warning<br />
system(s) are currently available for<br />
KVDD. Effective, timely<br />
communications between KVDD<br />
personnel, first responders,<br />
emergency support personnel and<br />
<strong>the</strong> public are vital in <strong>the</strong> event of<br />
any type of emergency including<br />
flooding. Levees hold back and<br />
prevent <strong>the</strong> water from <strong>the</strong> Kansas<br />
and Missouri Rivers from damaging<br />
<strong>the</strong> homes and businesses behind<br />
<strong>the</strong>m, causing millions of dollars<br />
worth of damage from potential<br />
flooding and possible preventing<br />
<strong>the</strong> loss of lives. Provide a radio<br />
communications system for KVDD<br />
that will enable <strong>the</strong>m to maintain<br />
constant communications with <strong>the</strong>ir<br />
own personnel, first responders,<br />
emergency management and o<strong>the</strong>r<br />
emergency support personnel as<br />
needed both during emergencies<br />
and on a regular day-to-day basis.<br />
Provide an adequate warning<br />
system(s) for KFCC that will enable<br />
<strong>the</strong>m to quickly and properly warn<br />
personnel during impending<br />
dangers or emergencies.<br />
Place/Re-Place Riprap along <strong>the</strong><br />
slopes of <strong>the</strong> levees. Levees are<br />
subject to potential erosive forces if<br />
left unprotected or only partially<br />
protected. A portion of <strong>the</strong> KVDD<br />
levees need an additional build-up<br />
with Rock Riprap to help prevent<br />
erosion. These levees hold back<br />
and prevent <strong>the</strong> water from <strong>the</strong><br />
Kansas/Missouri Rivers from<br />
damaging <strong>the</strong> homes and<br />
businesses behind <strong>the</strong>m causing<br />
millions of dollars worth of damage<br />
from potential flooding and possible<br />
preventing <strong>the</strong> loss of lives.<br />
Place/Re-Place Rock Riprap along<br />
<strong>the</strong> slopes of <strong>the</strong> Kaw Valley<br />
Drainage District’s levees to protect<br />
Addressed<br />
H 1,2,4 Flood, Dam and Levee On-going KVDD and County<br />
Emergency Management<br />
Department<br />
Cost: Unknown<br />
Funds: FEMA, Local, combination<br />
Completion Date: unknown<br />
H 1,2 Flood, Dam and Levee On-going Kaw Valley Drainage District Cost: $18 million<br />
Funds: FEMA, Local, combination<br />
Completion Date 2 years<br />
4.142
KVDD 3<br />
KVDD 4<br />
<strong>the</strong>m from erosive forces.<br />
Raise <strong>the</strong> top of <strong>the</strong> levees 4 – 5’ in<br />
order to meet <strong>the</strong> requirements for<br />
<strong>the</strong> 500-year flood event. An<br />
overtopping of <strong>the</strong> Levees by river<br />
waters during a 500-year flood<br />
event could result in catastrophic<br />
losses in personnel, property and<br />
economically. These levees hold<br />
back and prevent <strong>the</strong> water from<br />
<strong>the</strong> Kansas/Missouri Rivers from<br />
damaging <strong>the</strong> homes and<br />
businesses behind <strong>the</strong>m causing<br />
millions of dollars worth of damage<br />
from potential flooding and possible<br />
preventing <strong>the</strong> loss of lives. Raise<br />
<strong>the</strong> top of <strong>the</strong> Levees 4-5’ feet in<br />
order to meet <strong>the</strong> requirements for<br />
<strong>the</strong> 500-year flood event.<br />
Financial Assistance in meeting<br />
FEMA requirements relating to<br />
levee 100-year certification. FEMA<br />
required certification to be<br />
completed within two years of<br />
November 2010. Action is needed<br />
to insure Federal Flood Insurance<br />
Program. Partner with Corps of<br />
Engineers to perform <strong>the</strong> study and<br />
data collection.<br />
H 1,2 Flood, Dam and Levee On-going Kaw Valley Drainage District Cost: $250 million<br />
Funds: FEMA, Local, Combination<br />
Completion Date: 10 years<br />
H 1,2 Flood, Dam and Levee On-going Kaw Valley Drainage District Cost: $1.3 million total<br />
Funds: Federal, Local<br />
Completion Date: 2 years<br />
Wyandotte County – Leavenworth Rural Water District #7<br />
Action ID Action/Description Priority Goal(s)<br />
Hazard Addressed Status Responsible Entity Estimated Cost and funding Source<br />
Addressed<br />
LVRWD7 1 Maintain, Repair, and collect GPS<br />
locations of fire hydrants within <strong>the</strong><br />
area served by Leavenworth RWD7<br />
with Wyandotte County, KS.<br />
T<strong>here</strong> is no GIS mapping of <strong>the</strong> fire<br />
hydrants located in Leavenworth<br />
RWD7 boundaries. District<br />
personnel could repair and map fire<br />
hydrants using GPS mapping<br />
equipments and provide that<br />
information to <strong>the</strong> Fire Department.<br />
M 4 Wildfire On-going Operations, Leavenworth<br />
RDW7<br />
Cost: Staff Time<br />
Funds: District Funds<br />
Completion Date: 6 months<br />
4.143
Action ID Action/Description Priority Goal(s)<br />
Addressed<br />
WaterOne 1 Remote Monitoring of Fire/Smoke<br />
Alarms at WaterOne Unmanned<br />
Facilities. WaterOne has 13<br />
unmanned facilities. Within each<br />
facility is electrical and pumping<br />
equipment necessary to deliver<br />
water to WaterOne customers.<br />
Each facility contains a fire and<br />
smoke detection system with local<br />
alarms. In <strong>the</strong> event of a fire, no<br />
notice would come through <strong>the</strong><br />
SCADA system to <strong>the</strong> manned<br />
control room. The first notice would<br />
be from equipment failures alarming<br />
on SCADA or from observation by<br />
personnel that are occasionally onsite.<br />
Incorporate instrumentation<br />
into <strong>the</strong> smoke/fire alarm systems<br />
at each unmanned facility to send<br />
signals back to SCADA.<br />
Wyandotte County – WaterOne<br />
Hazard Addressed Status Responsible Entity Estimated Cost and funding Source<br />
M 1,2,4 Wildfire On-going WaterOne Cost: Unknown<br />
Funds: Unknown<br />
Completion Date: Unknown<br />
Wyandotte County – Private Non-Profits<br />
Action ID Action/Description Priority Goal(s)<br />
Hazard Addressed Status Responsible Entity Estimated Cost and funding Source<br />
Addressed<br />
BSA 1 Shelter during Wea<strong>the</strong>r Events<br />
Provide adequate & accessible<br />
sheltering areas for Scouts,<br />
Scouters and campers at Boy<br />
Scout Camp Theodore Naish,<br />
BSA. No completely adequate<br />
sheltering areas are currently<br />
available for<br />
campers and staff at Camp<br />
Theodore Naish, BSA. Camp<br />
Naish conducts year-round<br />
camping with <strong>the</strong> heaviest<br />
number of campers on-site<br />
during <strong>the</strong> summer months,<br />
mainly late May thru early<br />
August. Camping also occurs<br />
throughout <strong>the</strong> year. Provide<br />
adequate FEMA approved<br />
sheltering (per FEMA 361<br />
H 1,2 Hailstorm, Lightning,<br />
Tornado, Windstorm,<br />
Winter Storm<br />
completed Wyandotte county<br />
Emergency Management<br />
Department<br />
Cost: $700,000<br />
Funds: Grant, In-kind,<br />
Contributions<br />
Completion Date: Completed<br />
4.144
BSA 2<br />
LakeForest 1<br />
LakeForest 2<br />
guidance) for each populated<br />
area (campsites & main areas) of<br />
camp to ensure all Scouts /<br />
Scouters / campers are within<br />
easy access of a shelter when<br />
sheltering is required.<br />
Provide adequate<br />
communications system(s) for<br />
Scouts, Scouters and campers<br />
at Boy Scout Camp Theodore<br />
Naish, BSA. No completely<br />
adequate communications<br />
system(s) are currently<br />
available for campers, leaders<br />
and staff at Camp Naish.<br />
• Camp Naish conducts yearround<br />
camping with <strong>the</strong><br />
heaviest number of campers<br />
on-site during <strong>the</strong> summer<br />
months, mainly late May thru<br />
early August. Camping also<br />
occurs throughout <strong>the</strong> year.<br />
Provide better communications<br />
equipment to ensure <strong>the</strong> camp<br />
has contact with local<br />
government public safety<br />
entities and with each o<strong>the</strong>r<br />
throughout <strong>the</strong> camp.<br />
Develop a plan to cover all aspects<br />
of a flood making <strong>the</strong> entrance road<br />
to Lake of <strong>the</strong> forest unusable.<br />
With only one road leading both into<br />
and out of Lake of <strong>the</strong> Forest<br />
emergency vehicles would be<br />
prevented from helping residents in<br />
case of fire or medical situations.<br />
Permission for emergency use<br />
could be obtained from a neighbour<br />
whose property adjoins Lake of <strong>the</strong><br />
Forest on <strong>the</strong> East side of <strong>the</strong><br />
maintenance yard. A clear path<br />
through <strong>the</strong> Lake’s maintenance<br />
area should always be available.<br />
Lake Forest should have a boat and<br />
motor available to evacuate people<br />
if <strong>the</strong> need should arise. A list of<br />
residents with phone numbers who<br />
are trained in CPR and o<strong>the</strong>r<br />
medical areas could be maintained.<br />
Develop a plan to assist residents<br />
after a tornado. It is unlikely only<br />
one home would be damaged so<br />
High 4 All Hazards Deleted<br />
from<br />
Wyandotte<br />
Co.<br />
Moved to<br />
BSA1 –<br />
NEW<br />
Wyandotte County<br />
Emergency Management<br />
Director<br />
Cost: Unknown<br />
Funds: Grant funding with in-kind<br />
match, contributions of local<br />
<strong>material</strong>, manpower & monetary<br />
resources.<br />
Completion Date: Unknown<br />
H 1,2 Flood On-going President, Lake Forest Cost: Negligible<br />
Funds: None<br />
Completion Date: 6 months<br />
M 1,2 Tornado, Windstorm On-going President, Lake Forest Cost: Cost of a portable generator<br />
Funds: Lake Forest General<br />
Operating Budget<br />
4.145
Providence 1<br />
WyHC 1<br />
many people could need<br />
temporary accommodations. It is<br />
probable everyone at Lake Forest<br />
including <strong>the</strong> public buildings would<br />
be without utilities. Roads would<br />
need to be cleared. A list of<br />
residents with phone numbers who<br />
are trained in CPR and o<strong>the</strong>r<br />
medical areas could be maintained.<br />
Lake Forest could purchase a<br />
portable generator that would be<br />
capable of providing electricity to<br />
<strong>the</strong> Clubhouse.<br />
Develop Vaccination Strategy.<br />
Healthcare workers are necessary<br />
to <strong>the</strong> care and recovery of those<br />
affected. A hospital mass<br />
prophylaxis plan is in place and is<br />
currently being <strong>review</strong>ed<br />
Ability to continue to provide<br />
outpatient Mental Health services<br />
to current consumers, as well as<br />
provide services to those<br />
affected<br />
H 1,2 Major Disease Outbreak On-going,<br />
Open<br />
Ended<br />
County, Manager Infection<br />
Control Director, Health<br />
Department, Administrator<br />
M 1, 2, All Hazards New Community Mental Health<br />
Center Director<br />
Completion Date: 6 months<br />
Cost: TBD<br />
Funds: MMRS, and <strong>the</strong> SNS<br />
Completion Date: Continuous<br />
TBD<br />
Goal 1: Reduce or eliminate risk to <strong>the</strong> people and property of Region L from <strong>the</strong> impacts of <strong>the</strong> identified hazards in<br />
this plan.<br />
Goal 2: Strive to protect all of <strong>the</strong> vulnerable populations, structures, and critical facilities in Region L from <strong>the</strong> impacts<br />
of <strong>the</strong> identified hazards.<br />
Goal 3: Improve public outreach initiatives to include education, awareness and partnerships with all entities in order<br />
to enhance understanding of <strong>the</strong> risk <strong>the</strong> Region faces due to <strong>the</strong> impacts of <strong>the</strong> identified hazards.<br />
Goal 4: Enhance communication and cooperation among all agencies and between agencies and <strong>the</strong> public.<br />
4.146
5 Plan Maintenance Process<br />
Requirement §201.6(c)(4)(i): [The plan maintenance process shall include a] section<br />
describing <strong>the</strong> method and schedule of monitoring, evaluating, and updating <strong>the</strong><br />
mitigation plan within a five-year cycle.<br />
5.1 Plan Monitoring and Evaluation<br />
The Region L Mitigation Plan, consisting of Johnson, Leavenworth, and Wyandotte Counties,<br />
will be monitored and evaluated on a quarterly basis, beginning in <strong>the</strong> quarter following approval<br />
and adoption. These meetings will consist of information ga<strong>the</strong>ring on any changes that are<br />
critical to <strong>the</strong> plan, along with <strong>the</strong> updating of existing action items. Staying current and<br />
monitoring any changes that affect <strong>the</strong> plan is paramount to <strong>the</strong> success of <strong>the</strong> plan. By<br />
initiating quarterly <strong>review</strong>s and evaluations, <strong>the</strong> planning committee will stimulate conversation<br />
on each jurisdictions wants, needs, and status.<br />
The monitoring and evaluation of <strong>the</strong> Regional Plan will be facilitated through <strong>the</strong> Kansas<br />
Division of Emergency Management Planning Section and will consist of a variety of methods to<br />
engage <strong>the</strong> members of <strong>the</strong> community – public and private. Some of <strong>the</strong>se methods consist of:<br />
1. Surveys to all participating jurisdictions for information regarding any significant changes<br />
that have been noted since <strong>the</strong> last plan update.<br />
2. Meeting(s) of <strong>the</strong> Regional Hazard Mitigation Planning Committee will be convened to<br />
discuss <strong>the</strong> survey feedback, any changes in <strong>the</strong> regions risks, and action updates.<br />
3. The Kansas Division of Emergency Management will write and submit an annual report<br />
to be included as an addendum to <strong>the</strong> current plan, and <strong>the</strong> quarterly reports will be filed<br />
by <strong>the</strong> Emergency Management committee that holds <strong>the</strong> quarterly meeting. These<br />
meetings will be held in conjunction with <strong>the</strong> applicable KEMA meetins, and/or <strong>the</strong><br />
LEPC.<br />
5.2 Plan Updating<br />
FEMA requires that a multi-jurisdictional hazard mitigation plan be updated and approved<br />
every five years. This five year period begins with <strong>the</strong> date by FEMA of <strong>the</strong> first adoption<br />
resolution submitted for a plan.<br />
With <strong>the</strong> approval and adoption of <strong>the</strong> current plan in 2013, <strong>the</strong> Region L Hazard Mitigation<br />
Plan will be scheduled for updating and approval by FEMA in <strong>the</strong> year 2018.<br />
The quarterly maintenance and evaluation of <strong>the</strong> plan will set <strong>the</strong> stage for <strong>the</strong> five year<br />
update. This will also enable any changes in personnel involved in <strong>the</strong> planning committee<br />
5.1
to be kept apprised of <strong>the</strong> process and to be aware of any changes or updates that will<br />
enable <strong>the</strong>m to be a viable and informed partner.<br />
The system that will store <strong>the</strong> plan, <strong>the</strong> Super System, will enable <strong>the</strong> plan updates to be<br />
seamless and kept current. This is particularly important to <strong>the</strong> updating of <strong>the</strong> mitigation<br />
actions.<br />
Data gaps in <strong>the</strong> current plan will be addressed during <strong>the</strong> yearly maintenance scheduled<br />
meetings. A few of <strong>the</strong>se gaps are:<br />
Rankings – a plausible ranking system that takes <strong>the</strong> place of <strong>the</strong> STAPLEE criteria as it<br />
pertains to <strong>the</strong> actions each jurisdiction has put forward. Each jurisdiction ranks <strong>the</strong>m as a<br />
high, medium, or low depending on what <strong>the</strong>ir mission is. It can only benefit <strong>the</strong> whole<br />
community to ensure everyone is on <strong>the</strong> same page.<br />
Maps – Maps are a critical component of <strong>the</strong> mitigation plan as it enables <strong>the</strong> reader to<br />
visualize <strong>the</strong> story <strong>the</strong> plan writer is telling. While each county within <strong>the</strong> Region has a GIS<br />
department, as does KDEM, maps were a struggle to obtain during this plan update. By<br />
addressing this issue well ahead of time <strong>the</strong> planning committee should have a seamless<br />
process for <strong>the</strong> acquisition of maps.<br />
5.3 Public Participation in Plan Maintenance<br />
Requirement §201.6(c)(4)(iii): [The plan maintenance process shall include a]<br />
discussion on how <strong>the</strong> community will continue public participation in <strong>the</strong> plan<br />
maintenance process.<br />
The Regional Hazard Mitigation Plan for Region L will be made available to <strong>the</strong> public via<br />
each counties website, in order to ensure <strong>the</strong> public has a <strong>review</strong> and comment forum.<br />
Should any interested groups within <strong>the</strong> county desire a presentation of <strong>the</strong> plan than <strong>the</strong><br />
Kansas Division of Emergency Management will facilitate <strong>the</strong> meeting ei<strong>the</strong>r with <strong>the</strong><br />
cooperation of <strong>the</strong> county <strong>the</strong> interested party resides in, or as a lone entity. Some of <strong>the</strong>se<br />
interested parties could include: School Districts, Local Emergency Planning Committees,<br />
City Officials, or any o<strong>the</strong>r public venue that desires knowledge of <strong>the</strong> plan.<br />
5.2
Appendix A: Signed Resolutions<br />
Model Resolution<br />
Resolution # ______ Adopting <strong>the</strong> Region L Multi-Hazard Mitigation Plan<br />
W<strong>here</strong>as, <strong>the</strong> (Name of Government/District/Organization seeking FEMA approval of hazard<br />
mitigation plan) recognizes <strong>the</strong> threat that natural hazards pose to people and property within our<br />
community; and<br />
W<strong>here</strong>as, undertaking hazard mitigation actions will reduce <strong>the</strong> potential for harm to people and<br />
property from future hazard occurrences; and<br />
W<strong>here</strong>as, <strong>the</strong> U.S. Congress passed <strong>the</strong> Disaster Mitigation Act of 2000 (“Disaster Mitigation<br />
Act”) emphasizing <strong>the</strong> need for pre-disaster mitigation of potential hazards;<br />
W<strong>here</strong>as, <strong>the</strong> Disaster Mitigation Act made available hazard mitigation grants to state and local<br />
governments; and<br />
W<strong>here</strong>as, an adopted Multi-Hazard Mitigation Plan is required as a condition of future funding<br />
for mitigation projects under multiple FEMA pre- and post-disaster mitigation grant programs;<br />
and<br />
W<strong>here</strong>as, <strong>the</strong> (Name of Government/District/Organization) fully participated in <strong>the</strong><br />
FEMAprescribed mitigation planning process to prepare this Multi-Hazard Mitigation Plan; and<br />
W<strong>here</strong>as, <strong>the</strong> Kansas Division of Emergency Management and <strong>the</strong> Federal Emergency<br />
Management Agency Region VII officials have <strong>review</strong>ed <strong>the</strong> “Region L Multi-Hazard<br />
Mitigation Plan,” and approved it contingent upon this official adoption of <strong>the</strong> participating<br />
governing body; and<br />
W<strong>here</strong>as, <strong>the</strong> (Name of Government/District/Organization) desires to comply with <strong>the</strong><br />
requirements of <strong>the</strong> Disaster Mitigation Act and to augment its emergency planning efforts by<br />
formally adopting <strong>the</strong> Region L Multi-Hazard Mitigation Plan; and<br />
W<strong>here</strong>as, adoption by <strong>the</strong> governing body for <strong>the</strong> (Name of Government/District/Organization)<br />
demonstrates <strong>the</strong> jurisdictions’ commitment to fulfilling <strong>the</strong> mitigation goals and objectives<br />
outlined in this Multi-Hazard Mitigation Plan.<br />
W<strong>here</strong>as, adoption of this legitimizes <strong>the</strong> plan and authorizes responsible agencies to carry out<br />
<strong>the</strong>ir responsibilities under <strong>the</strong> plan;<br />
Now, <strong>the</strong>refore, be it resolved, that <strong>the</strong> (Name of Government/District/Organization) adopts <strong>the</strong><br />
“Region L-Hazard Mitigation Plan” as an official plan; and
Be it fur<strong>the</strong>r resolved, <strong>the</strong> (Name of Government/District/Organization) will submit this<br />
Adoption Resolution to <strong>the</strong> Kansas Division of Emergency Management and Federal Emergency<br />
Management Agency Region VII officials to enable <strong>the</strong> plan’s final approval.<br />
Passed: ___________<br />
__________ _______<br />
Certifying Official
Appendix D: References and Contacts<br />
• The following individuals were contacted in reference to <strong>the</strong> Region L Hazard Mitigation<br />
Plan. Phone numbers are provided should verification be needed:<br />
• Steve Samuelson – Kansas Department of Agriculture – Contacted on CRS program,<br />
NFIP stats and program. 785-296-4622. 25 March 2013 – 16 July 2013.<br />
• Erika Stanley – Kansas Department of Agriculture Division of Water Resources.<br />
Contacted on maps, levees and ams. 785-296-2513. 22 April 2013 – 29 April 2013.<br />
• Michael McNulty – Director of Homeland Security Operations bureau of community<br />
Health systems Kansas Department of Health and Environment. 785-291-3065.<br />
Contacted on Major Disease Outbreak and statistics related to extreme temperature. 20<br />
March 2013 – 12 July 2013.<br />
• Jack Baines – Wyandotte County Deputy Appraiser. 913-573-8400. Contacted for <strong>the</strong><br />
Wyandotte County Abstract of Values. 10 June 2013 – 13 June 2013.<br />
• Jamie Schwartz – Environmental Scientist, KS Division of Emergency Management.<br />
785-274-1423. Contacted about RMP by county.<br />
• Jennifer Clark – Technological Hazards and Critical Infrastructure Section Chief, KS<br />
Division of Emergency Management. 785-274-1394. Contacted for hazardous <strong>material</strong><br />
spills and incidents. 4 April 2013 – 18 July 2013.<br />
• Kimberly A. Hunninghake, Dam Safety Team Leader, Kansas Department of Agriculture,<br />
Division of Water Resources. 785-296-4625. Contacted for Dam and Levee<br />
information. 13 March 2013.<br />
• Kent Schierkolk – Response/Restoration Unit Manager, Bureau of Environmental<br />
Remediation, KDHE. 785-368-7301. Contacted for information of hazardous <strong>material</strong><br />
spills and incidents. 8 April 2013 – 9 April 2013.<br />
• Kim Steves – KS Department of Health and Environment Radiation Control Program.<br />
785-296-4359. Contacted for stats on radiological spills, accidents, etc. for <strong>the</strong> planning<br />
area. 25 March 2013 – 5 April 2013.<br />
• Brian T. Rast – Senior Planner and Senior Project Manager silver Jackets Coordinator,<br />
Kansas & Missouri, USACE. 816-389-3337. April 2013 – 24 July 2013. Levee’s and<br />
Dams information.<br />
• Chad Omitt – National Wea<strong>the</strong>r Service, Warning Coordination Meteorologist. 785-232-<br />
1493. Contacted in regards to various natural hazard climatology questions. 11 Dec<br />
2012 – on-going.
• Kari Valentine, Laurie Bestgren, Susan Belt - AMEC, Mitigation Planner’s. 785-272-<br />
6878. Contacted in regards to various data and stats in <strong>the</strong> State Mitigation Plan that<br />
directly affected Region L’s HMP. Time period – on going.<br />
• Rob Ladner, Captain – KDWPT – Region 2 Office. 785-273-6740. Environmental,<br />
endangered species, wildfire. 29 January 2013.<br />
• John W. Maddox – Freight and Rail Program Manager, Bureau of Transportation<br />
Planning, Kansas Department of Transportation. 785-296-3228. Number of Kansas<br />
Regulated Pipeline Mileage. 5 Dec 2012.<br />
• Kim Gant – KS Historical Society. 29 Jan 2013 – 12 June 2013.<br />
• Jeremy Jackson – Director – Kansas Intelligence Fusion Center, 785-274-1805.<br />
Contacted in regards to cybersecurity, terrorism. 29 April 2013 – on-going.<br />
• Margaret Fast – Kansas Water Office. 785-296-0865. 1 February 2013. Requested<br />
info on drought.<br />
•<br />
•<br />
•<br />
•<br />
•<br />
•<br />
•<br />
•<br />
•<br />
•<br />
•<br />
•<br />
•<br />
•<br />
•
•<br />
•<br />
•<br />
•<br />
•<br />
•<br />
•<br />
•<br />
•<br />
• 2011 Kansas Crop Insurance Profile. Rep. USDA Risk Management Agency, n.d. Web.<br />
5 Mar. 2013. www.rma.usda.gov/pubs/2012/stateprofiles/kansas11.pdf.<br />
• Bureau of Reclamation. Managing Water in <strong>the</strong> West. Dam Safety Public Protection<br />
Guidelines. www.usbr.gov/ssle/damsafety/documents/PPG201108.pdf<br />
• Centers for Disease Control and Prevention (CDC). “Preparing for and Responding to<br />
Extreme Heat and Cold Events.” www.cdc.gov/nceh/hsb/disaster/heatandcold.htm.<br />
• Department of Homeland Security. Various. www.FEMA.gov<br />
• EMCAPS. Electronic Mass Casualty Assessment and Planning Scenario’s.<br />
www.hopkins-cepar.org/EMCAPS/EMCAPS.html<br />
• Federal Bureau of Investigation (FBI). www.fbi.gov/stats-services/publications/terrorism-<br />
2002-2005<br />
• FEMA’s Policy and Claim Statistics for Flood Insurance. www.fema.gov/policy-claimstatistics-flood-insurance/policy-claim-statistics-flood-insurance/policy-claim-13<br />
• Johnson County Multi-Hazard Mitigation Plan, 2009.<br />
• Kansas Adjutant General’s Department<br />
• Kansas Department of Health and Environment Bureau of Surveillance<br />
and Epidemiology. www.kdheks.gov/epi/index.html.<br />
• Kansas Department of Agriculture, Division of Water Resources (KDS-DWR).<br />
www.ksda.gov/dwr.
• Kansas Department of Agriculture. Emerald Ash Borer Information. N.p., n.d. Web. 5<br />
Mar. 2013. www.ksda.gov/plant_protection/content/379.>.<br />
• Kansas Department of Agriculture. High and Significant Hazard Dams.<br />
• Kansas Department of Agriculture, Plant Protection and Weed Control Division, 2011,<br />
www.ksda.gov/includes/document_center/plant_protection/Insect_Survey_Reports/Insec<br />
tReportN1V59.pdf.<br />
• Kansas Department of Corrections. Inmate Populations.<br />
www.doc.ks.gov/publications/fiscal-year-2012-offender-population-report/view<br />
• Kansas Department of Health and Environment.<br />
www.kdheks.gov/environment/index.html<br />
• United States Department of Transportation, Pipeline & Hazardous Materials Safety<br />
Administration.<br />
primis.phmsa.dot.gov/comm/reports/safety/KS_detail1.html?nocache=3112#_OuterPane<br />
l_tab_6<br />
• Kansas Department of Health and Environment. “Subsurface Void Space<br />
and Sinkhole/Subsidence Area Inventory for <strong>the</strong> State of Kansas.” 2006.<br />
• Kansas Division of Emergency Management (KDEM). Technological<br />
Hazards. Primary Locations of Hazardous Materials Incidents.<br />
• Kansas Geological Survey, Earthquakes in Kansas.<br />
www.kgs.ku.edu/Publications/GeoRecord/2001/vol7.3/Page1.html<br />
• Kansas State Hazard Mitigation Plan 2013.<br />
• Kansas Historical Society. National and State Registers. www.kshs.org.<br />
• Kansas State Research and Extension, Climatic Maps of Kansas.<br />
http://www.ksre.ksu.edu/wdl/ClimaticMaps.htm<br />
• Kansas State University. “Forrest Action Plan.Revised Web. 2011.<br />
www.kansasforests.org/documents/stateagency/Kansas_FRAS.pdf and<br />
www.kansasforests.org/assessment.shtml.<br />
• Kansas Water Office. Drought/Climate Report.<br />
www.kwo.org/Reports%20&%20Publications/Drought/Tbl_drought_declarations_051107<br />
_twl.pd and http://governor.ks.gov/kansasdrought-resources.<br />
• Leavenworth County Multi-jurisdictional Mitigation Plan, Jul 2010.<br />
• Local Mitigation Planning Handbook. Federal Emergency Management Agency. FEMA.<br />
Mar. 2013. Print.
• National Climatic Data Center. Various.<br />
http://www.ncdc.noaa.gov/stormevents/choosedates.jsp?statefips=20%2CKANSAS<br />
• National Oceanic and Atmospheric Administration. Drought. www.drought.gov/drought/.<br />
• National Wea<strong>the</strong>r Service (NWS). Heat Index Chart.<br />
www.crh.noaa.gov/images/unr/preparedness/heatindex.pdf<br />
• NCAR, Climate and Global Dynamics Division. Palmer Drought Index.<br />
www.cgd.ucar.edu/cas/catalog/climind/pdsi.html.<br />
• Pepitone, John. "Community Activist Calls for Stop to HS "Fight Club"" Fox4kccom. N.p.,<br />
12 Nov. 2012. Web. 22 Jan. 2013. http://fox4kc.com/2012/11/12/community-activistcalls-for-stop-to-hs-fight-club/.<br />
• Sou<strong>the</strong>rn Poverty Law Center. 2012. www.splcenter.org/what-we-do/hate-andextremism<br />
• "'So, You Live Behind a Levee!' New ASCE Guide Helps Communities Tackle Flood<br />
Protection, Risk Issues." American Society of Civil Engineers. N.p., n.d. Web. Jan.-Feb.<br />
2013. .<br />
• Stanford University’s National Performance of Dams Program. http://ce-npdpserv2.stanford.edu/DamDirectory/DamIncidentQuery/IncidentForm.jsp<br />
• State of Kansas, K.S.A. 82a-301 et seq. Definitin of a jurisdictional dam.<br />
http://damsafety.org/media/Documents/STATE_INFO/LAWS_&_REGS/Kansas_L&R.pdf<br />
• The Annual impact of seasonal influenza in <strong>the</strong> US: Measuring disease<br />
burden and costs, by Molinari et al.<br />
• Tornado Project. www.tornadoproject.com.<br />
• United States Army Corps of Engineer, KC District.<br />
http://www.nwk.usace.army.mil/Portals/29/docs/emergencymanagement/leveerehab/200<br />
9-LeveeRepairs-Status-MO.pdf<br />
• United States Army Corps of Engineers. National Levee Database.<br />
http://nld.usace.army.mil/egis/f?p=471:1:0::NO<br />
• United States Census Bureau. Various. 2010. www.census.gov.<br />
• USDA. Animal and Plant Health Inspection Service. Map. USDA, n.d. Web. 5 Mar. 2013.<br />
www.aphis.usda.gov/plant_health/plant_pest_info/emerald_ash_b/downloads/eab_quara<br />
ntine_map.pdf .<br />
• USDA, 2007 Census of Agriculture. www.agcensus.usda.gov.
• United States Environmental Protection Agency (EPA), RMPs,<br />
www.rtknet.org/rmp/ks.php.<br />
• United States Geological Survey, National Atlas of <strong>the</strong> United States.<br />
www.nationalatlas.gov. and Swelling Soils.<br />
http://arcvoid.com/surevoid_web/soil_maps/ks.html<br />
• United States Geological Survey. PSHA Model.<br />
http://earthquake.usgs.gov/hazards/apps/<br />
• Unites States of Homeland Security/FEMA, GIS Department.<br />
• Vaisala’s National Lightning Detection Network (NLDN). Cloud to Ground Lightning<br />
Incidence in <strong>the</strong> Continental U.S. (1997-2010).<br />
http://www.vaisala.com/en/products/thunderstormandlightningdetectionsystems/Pages/N<br />
LDN.aspx<br />
• Wyandotte County Multi-jurisdictional Hazard Mitigation Plan. Jul 2010.