02020602 - Cafet Innova
02020602 - Cafet Innova
02020602 - Cafet Innova

You also want an ePaper? Increase the reach of your titles
YUMPU automatically turns print PDFs into web optimized ePapers that Google loves.
484 International Journal of Earth Science and Engineering<br />
ISSN 0974-5904, Vol. 02, No. 06, December 2009, pp. 484-498<br />
Water Balance of Haromaya Watershed, Oromiya<br />
Region, Eastern Ethiopia<br />
NATA TADESSE and ABDUL AZIZ MOHAMMED<br />
Department of Earth Science, College of Natural and Computational Sciences, Mekelle<br />
University, P.O. Box 1604, Mekelle, Ethiopia<br />
Email: tafesse24603@yahoo.com, amennata@gmail.com<br />
Abstract: The main purpose of this study was to conduct the water balance of Haromaya<br />
watershed, located in Oromiya Regional State, eastern part of Ethiopia, having an area of<br />
about 53.8 km 2 . The hydrology of the area was characterized based on land use, soil,<br />
rainfall, temperature, evapotranspiration, runoff and infiltration. In order to determine the<br />
basic hydrologic parameters, meteorological data was collected from a station inside the<br />
watershed. The rainfall coefficient method was used to determine the monthly distribution<br />
of rainfall and then to distinguish between rainy and dry months. The Thornthwaite and<br />
modified Penman methods were used to compute the potential evapotranspiration. Water<br />
balance model was used for determination of the actual evapotranspiration. The catchment<br />
is characterized by one rainy season and two dry seasons during the year. The rainy season<br />
has eight months whereas the dry seasons have four months. The mean annual rainfall of<br />
the catchment is 770.5 mm. Rains in the rainy season accounts for 93% of the mean annual<br />
rainfall whereas the amount of rainfall that occurs during the dry seasons accounts only 7<br />
%. The mean annual actual evapotranspiration of the watershed is 693.14 mm. Haromaya<br />
watershed is a closed basin and the actual evapotranspiration is the only outflow<br />
component. The net total amount of water which is actually available to recharge the<br />
groundwater circulation within the watershed is 2.01 million cubic meter. In general, the<br />
watershed has very good groundwater potential, and needs proper development and<br />
utilization under a controlled scientific manner.<br />
Keywords: Evapotranspiration, Ethiopia, groundwater, rainfall, surplus, water budget.<br />
1. Introduction:<br />
1.1. General:<br />
The demand of water in developing<br />
countries like Ethiopia is ever increasing day<br />
by day with rapid population growth.<br />
Supplying adequate water with a reasonable<br />
quality is a major constraint in both local<br />
and regional planning for urban and rural<br />
areas. Domestic consumptions, industrial<br />
and irrigation activities mainly relay on<br />
water. In most cases, in Ethiopia, the<br />
demand for water exceeds the supply from<br />
various resources such as surface waters<br />
and groundwater. This is not due to lack of<br />
water resources but due to inefficient water<br />
resources utilization practices. Meaningful<br />
planning to utilize and conserve water<br />
resources in a particular area, should be<br />
based on the assessment of its available<br />
water resources. Ethiopia has abundant<br />
water resources with estimated 111 billion<br />
cubic meters of mean annual runoff from its<br />
major river basins, and preliminary studies<br />
and professional estimates indicate that the<br />
country has a yearly refreshing groundwater<br />
of 2.56 billion cubic meters (Ministry of<br />
Water Resource, 2001). However, the<br />
country is known by famine and drought.<br />
Assessment of available water resources can<br />
be done through a means of water balance<br />
analyses. The water balance is an<br />
accounting of the inputs and outputs of<br />
water (Ritter, 2006). In other words, the<br />
study of the water balance is the application<br />
in hydrology of the principle of conservation<br />
of mass, often referred to as the continuity<br />
equation. This states that, for any arbitrary<br />
volume and during any period of time, the<br />
difference between total input and output<br />
will be balanced by the change of water<br />
storage within the volume. In general,<br />
therefore, use of a water-balance technique<br />
implies measurements of both storages and<br />
#<strong>02020602</strong> Copyright © 2009 CAFET-INNOVA TECHNICAL SOCIETY. All rights reserved.
.<br />
Water Balance of Haromaya Watershed, Oromiya Region,<br />
Eastern Ethiopia<br />
485<br />
fluxes (rates of flow) of water, though by<br />
appropriate selection of the volume and<br />
period of time for which the balance will be<br />
applied, some measurements may be<br />
eliminated (UNESCO, 1974).<br />
The water balance equation for any natural<br />
area (such as a river basin) or water body<br />
indicates the relative values of inflow,<br />
outflow and change in water storage for the<br />
area or water body. In general, the inflow<br />
part of the water balance equation<br />
comprises precipitation (P) as rainfall and<br />
snow actually received at the ground<br />
surface, and surface and subsurface water<br />
inflow into the basin or water body from<br />
outside (Q si and Q ux ). The outflow part of the<br />
equation includes evaporation from the<br />
surface of the water body (E) and surface<br />
and subsurface outflow from the basin or<br />
water body (Q so and Q up ). When the inflow<br />
exceeds the outflow, the total water storage<br />
in the body (Δs) increases; an inflow is less<br />
than the outflow resulting in decreased<br />
storage. Consequently the water balance for<br />
any water body and any time interval in its<br />
general form may be represented by the<br />
following equation (UNESCO, 1974): P + Q si<br />
+ Q ux - E - Q so - Q up - Δs = 0 (1)<br />
For application to a variety of water-balance<br />
computations Eq. 1 may be simplified or<br />
made more complex, depending on the<br />
available initial data, the purpose of the<br />
computation, the type of body (river basin<br />
or artificially separated administrative<br />
district, lake or reservoir, etc.), and the<br />
dimensions of the water body, its<br />
hydrographic and hydrologic features, the<br />
duration of the balance time interval, and<br />
the phase of the hydrological regime (flood,<br />
low flow) for which the water balance is<br />
computed.<br />
On the other hand, depending on the<br />
specific problem, the terms of Eq. 1 may be<br />
subdivided also. For example, in the<br />
compilation of water balance for short time<br />
intervals, the change in total water storage<br />
(Δs) in a small river basin may be<br />
subdivided into changes of moisture storage<br />
in the soil (ΔM), in aquifers (ΔG), in lakes<br />
and reservoirs (Δs l ), in river channels (Δs ch ),<br />
in glaciers (Δs gl ) and in snow cover (Δs sn ).<br />
Thus in this case the water balance equation<br />
becomes;<br />
P + Q si + Q ux - E - Q so - Q up - ΔM - ΔG - Δs l -<br />
Δs ch - Δs gl - Δs sn = 0 (2)<br />
where Q si represents the net surface water<br />
diversion from other basins.<br />
Determining the components of the water<br />
balance has a great contribution in the<br />
water budgeting of an area. A water<br />
resource development which is carried out<br />
on the basis of water budget information will<br />
definitely minimize and/or avoid the<br />
wastage of water resources that are going to<br />
be exposed to risk and mismanagement,<br />
and hence will led to a proper utilization of<br />
this precious resource.<br />
In Ethiopia, water balance study was<br />
conducted only in few areas (Kebede et. al.,<br />
2006; Kebede and Travi, 2004; Johnson and<br />
Curtis, 1994; Nata, 2006; Shahin, 1988;<br />
Valet-Coulomb et. al., 2001). Most of these<br />
studies were conducted for purpose of<br />
academic achievement rather than being<br />
utilized for the proper development of water<br />
resource of the country.<br />
The Haromaya watershed is a source of<br />
water supply for three major towns (Harar,<br />
Alemaya and Awaday) and also to one main<br />
University of the country called Haromaya<br />
University. Currently the groundwater is<br />
extracted through twenty boreholes and<br />
more than 180 hand dug wells that are<br />
drilled and dugged in different parts of the<br />
watershed. The boreholes were drilled to<br />
supply water to the three towns and the<br />
university, whereas the hand dug wells were<br />
constructed by the farmers for the domestic,<br />
irrigation and livestock purposes.<br />
Even though such a huge exploitation of<br />
groundwater is going on there, the water<br />
balance which accounts the whole Haromaya<br />
watershed has not yet been established so<br />
far. Consequently, the total amount of water<br />
which is actually available to recharge the<br />
groundwater circulation in the watershed is<br />
not yet been determined. This research work<br />
is designed to fill such a gap and by then<br />
give quantitative information about the<br />
water budget components and its analyses<br />
that can be used for further development<br />
and utilization plan for this precious<br />
resource in the area.<br />
International Journal of Earth Science and Engineering<br />
ISSN 0974-5904, Vol. 02, No. 06, December 2009, pp. 484-498
486 NATA TADESSE and ABDULAZIZ MOHAMMED<br />
1.2 Objective:<br />
The major objective of the research was to<br />
conduct the water balance of the Haromaya<br />
watershed.<br />
2. Methodology:<br />
2.1 Description of the Study Area:<br />
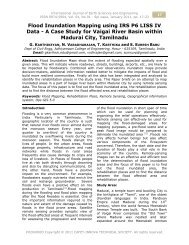
2.1.1 Location:<br />
The study area, Haromaya watershed, is<br />
located in Oromiya Regional State, eastern<br />
part of Ethiopia, about 505 km east of Addis<br />
Ababa, which is the capital city of country.<br />
Geographically, it is bounded between 9° 21'<br />
40'' to 9° 27' 13'' E and 42° 05' 16'' to 43°<br />
55' 12'' N. The Haromaya watershed is a<br />
closed basin, and has an aerial coverage of<br />
about 53.8 sq. km (Fig. 1).<br />
SUDAN ERITREA<br />
Red<br />
Sea<br />
N<br />
UGANDA<br />
Mekelle<br />
Tan a<br />
Gulf of<br />
H ayk DJIBOUTI<br />
Aden<br />
B lu e N ile<br />
SOMALIA<br />
Addis Ababa<br />
ETHIOPIA<br />
L ake R u d o lf<br />
KENYA<br />
0 200 KM<br />
SOMALIA<br />
Indian<br />
Ocean<br />
TIG RAY<br />
AMHARA<br />
AFAR<br />
BENSHANGUL<br />
DIRE DAWA<br />
ADDIS ABABA HARARI<br />
GAMBELA<br />
S.N.N.P.R.S.<br />
SOMALI<br />
O RO M I YA<br />
N<br />
1044000<br />
1041000<br />
1038000<br />
165000 168000 171000 174000 177000 180000<br />
Legend<br />
0 4 Kilometer<br />
Swampy area<br />
Watershed boundary<br />
Intermittent Streams<br />
Figure 1: Location map of the Haromaya watershed (After Nata et. al, 2006).<br />
International Journal of Earth Science and Engineering<br />
ISSN 0974-5904, Vol. 02, No. 06, December 2009, pp. 484-498
Water Balance of Haromaya Watershed, Oromiya Region,<br />
Eastern Ethiopia<br />
487<br />
2.1.2 Physiography and Drainage:<br />
The Haromaya watershed is located in the<br />
Harerghe plateau in the southeastern<br />
highlands and lowlands physiographic unit of<br />
the country. The watershed consists of vast<br />
depressed area bounded by adjacent<br />
highlands. The surrounding mountains are<br />
characterized by gentle to steep slopes<br />
covered with scattered bushes. The<br />
elevation of the area ranges from 2420 m<br />
above sea level at extreme northeastern<br />
parts to 2020 m above sea level near to the<br />
central depressed area. Steep to very steep<br />
slope, hilly and mountainous area, which<br />
covers 18% of the total area, characterizes<br />
the eastern and northeastern parts of the<br />
watershed. Flat to gentle slopes, which<br />
cover 82% of the total area and has a slope<br />
ranging 0-15%, characterizes the remaining<br />
parts of the watershed. The watershed<br />
includes a swampy area that lies in its<br />
southwestern parts. The slope of the<br />
watershed rises slowly in all directions away<br />
from the swampy area. The slopes, hills and<br />
mountains surrounding the study area have<br />
created a drainage network, which takes the<br />
surface flow towards the swampy area (Fig.<br />
1). All the streams that drained the<br />
watershed are intermittent, and the<br />
drainage pattern of the area is dendritic type<br />
(Fig. 1)<br />
2.1.3 Geology:<br />
The geology of the watershed is constituted<br />
by the rocks ranging in age from<br />
Precambrian to Recent. Stratigraphically,<br />
from the bottom to the top are the<br />
Precambrian basement rock (Granite),<br />
Mesozoic sedimentary rocks (Sandstone and<br />
Limestone) and Recent Quaternary<br />
sediments. The Precambrian basement rock<br />
of the watershed is granite, which is an<br />
Archean intrusive volcanic rock that<br />
penetrates the gneissic rocks. The fresh<br />
granite is light pinkish, massive, and coarse<br />
grained, having a batholithic size. It is<br />
characterized by well developed white<br />
colored quartz crystals and pinkish colored<br />
angular orthoclase crystal. It covers 46.3%<br />
of the total area of watershed, having a<br />
maximum thickness of more than 100m in<br />
the southeastern parts (Nata et. al, 2006).<br />
The Mesozoic sedimentary successions of<br />
the watershed consist of two formations, the<br />
sandstone and limestone.The sandstone,<br />
which occupies 14.3% of the total area, is a<br />
yellowish to pink, fine to medium grained<br />
quartz sandstone with well sorted, rounded<br />
grains weathering to red on the surface. It is<br />
non-calcareous except at the top near the<br />
contact with the overlying limestone, where<br />
thin beds of limestone have developed. The<br />
thickness of the sandstone ranges from 20<br />
to 200 meters, and shows deep vertical<br />
jointing (Nata et. al, 2006). The limestone,<br />
which occupies 5.1% of the mapped area<br />
having a maximum thickness of 180m, is<br />
fossiliferous, micritic limestone having very<br />
fine grain calcite crystals containing thin<br />
beds of light brownish marl bands having a<br />
thickness ranging from 3-5m (Nata et. al,<br />
2006). It has gray color when fresh and light<br />
yellowish to black color after weathering.<br />
Alluvium occurs in the central part of the<br />
watershed and as thin strip along the<br />
margins of the major rivers and their<br />
tributaries, and constitutes about 16.7% of<br />
the total area (Nata et. al, 2006).The lake<br />
deposits are found occupying the dried and<br />
disappeared Haromaya lake position in the<br />
current swampy area in the depressed part<br />
of the watershed, and constitute about<br />
17.7% of the total area (Nata et. al, 2006).<br />
Compositionally the deposits are comprised<br />
of clay, silty clay and silt in different<br />
proportion.<br />
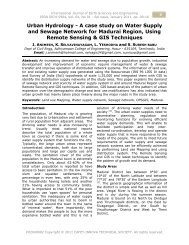
2.1.4 Soil:<br />
On the basis of USDA soil textural<br />
classification scheme, the soil in the<br />
watershed was grouped in to four different<br />
classes: clay, clay-loam, sandy clay loam<br />
and sandy-loam. In addition to these soil<br />
covers swampy area is found at the central<br />
part of the area. The spatial distribution and<br />
areal coverage of these soil types is given in<br />
Table 1 and Fig. 2.<br />
Table 1: Types of soil and their<br />
corresponding area coverage.<br />
International Journal of Earth Science and Engineering<br />
ISSN 0974-5904, Vol. 02, No. 06, December 2009, pp. 484-498
488 NATA TADESSE and ABDULAZIZ MOHAMMED<br />
1044000 N<br />
1041000<br />
1038000<br />
165000 168000 171000 174000 177000 180000<br />
Legend<br />
Clay<br />
Clay loam<br />
Sandy clay loam<br />
Sandy loam<br />
0 4 Kilometer<br />
Swampy area<br />
Watershed boundary<br />
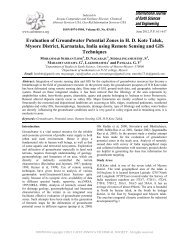
2.1.5 Land Use and Vegetation:<br />
Figure 2: Soil map of the watershed (Nata et. al, 2006).<br />
Six major land use types were identified<br />
from the present land use during the field<br />
assessment made on the watershed. These<br />
are cultivated land, grazing land, forest,<br />
settlement (homestead), shrub and swampy<br />
area. The distribution and areal coverage of<br />
each land use is given in Table 2 and Fig. 3.<br />
Table 2: Land use type with their area<br />
proportion.<br />
78.25% of the total area of the watershed is<br />
constituted by cultivated land. The major<br />
crops grown in the area are sorghum and<br />
maize. Moreover, chat, a cash crop<br />
intercropped within sorghum and maize is<br />
also produced by farmers. There is also a<br />
good amount of vegetable production<br />
specifically around the swampy part by<br />
using irrigation water from hand dug wells.<br />
International Journal of Earth Science and Engineering<br />
ISSN 0974-5904, Vol. 02, No. 06, December 2009, pp. 484-498
Water Balance of Haromaya Watershed, Oromiya Region,<br />
Eastern Ethiopia<br />
489<br />
1044000 N<br />
1041000<br />
1038000<br />
165000 168000 171000 174000 177000 180000<br />
Legend<br />
Cultivated land<br />
Grazing land<br />
Forest<br />
Shrub<br />
0 4 Kilometer<br />
Settlement (Homestead)<br />
Swampy area<br />
Watershed boundary<br />
2.2 Data Collection:<br />
Figure 3: Land use map of the watershed (Nata et. al, 2006).<br />
Extensive work was carried out by collecting<br />
pertinent primary data of the area in the<br />
field and secondary data from different<br />
offices.<br />
The topographic map with a scale of<br />
1:50,000 was used as a base map. Different<br />
thematic maps of the area were prepared<br />
using this as a base map. The hydrology of<br />
the catchment was characterized by land<br />
use, soil, rainfall, temperature,<br />
evapotranspiration, runoff and infiltration. In<br />
order to determine the basic hydrologic<br />
parameters, meteorological data was<br />
collected from a meteorological station. Data<br />
for land use, soil, geology and root depth<br />
were collected in the field with the help of<br />
GPS. Using ArcView GIS 3.3 and CorelDRAW<br />
12 software’s, various thematic maps such<br />
as location, soil and land use were<br />
produced.<br />
Meteorological data were collected from<br />
Haromaya meteorological station, which is<br />
located in the study area. The Haromaya<br />
meteorological station, which is owned by<br />
the National Meteorological Service Agency,<br />
is the first class station.<br />
2.3 Data Processing:<br />
For textural analyses nineteen disturbed soil<br />
samples were collected and analyses was<br />
made by Pipette method. The analyses were<br />
carried out at the soil laboratory of the<br />
Haromaya University. The soil classification<br />
was done on the basis of USDA soil texture<br />
classification system. The average depth of<br />
the root zone was measured in the field.<br />
In this study the suggested values of<br />
available water capacities for combinations<br />
of soil texture and vegetation by<br />
Thornthwaite and Mather (1957) was used<br />
to determine the available water capacity of<br />
the different soils in the watershed.<br />
The rainfall coefficient method (Daniel,<br />
1974) was used to determine the monthly<br />
distribution of rainfall in the studied area<br />
and then to distinguish between rainy<br />
months and dry months. This method<br />
involved the calculation of "rainfall<br />
International Journal of Earth Science and Engineering<br />
ISSN 0974-5904, Vol. 02, No. 06, December 2009, pp. 484-498
490 NATA TADESSE and ABDULAZIZ MOHAMMED<br />
coefficient" for each month at the station,<br />
the coefficient being the ratio between the<br />
mean monthly rainfall and one-twelfth of the<br />
annual mean (the latter referred to as<br />
"rainfall module").<br />
Potential evapotranspiration was estimated<br />
by modified Penman and Thornthwaite<br />
methods.<br />
The Penman equation, which was later<br />
modified by MAFF (Shaw, 1994) and called<br />
modified Penman equation, is given by:<br />
<br />
H T<br />
E at<br />
<br />
<br />
PET<br />
………………. (3)<br />
<br />
1<br />
<br />
Where<br />
PET = Potential evapotranspiration<br />
(mm/day)<br />
Δ = Slope of saturated vapor pressure Vs<br />
temperature curve (mmHg/ O C)<br />
γ = Hygrometric constant (mmHg/ O C)<br />
H 0 .75R<br />
(1 r)<br />
R (4)<br />
T<br />
I<br />
<br />
r 0. R f <br />
<br />
RI 75<br />
a<br />
a<br />
o<br />
n<br />
<br />
N<br />
1 (5)<br />
r = Albedo (for the study area it was taken<br />
to be 0.25)<br />
n <br />
<br />
N <br />
f a<br />
for the study area (within<br />
latitudes south of 54/2 0 N) equals<br />
<br />
<br />
<br />
n <br />
.16 0.62 <br />
N <br />
0 (Shaw, 1994)<br />
(6)<br />
0.47<br />
0.075 e (0.17 0.83n<br />
/ )<br />
R<br />
a<br />
<br />
4<br />
0<br />
T<br />
correction N factor.<br />
(7)<br />
= Stefan-Boltzman constant (5.67*10 -8<br />
Wm -2 K -4 )<br />
T = Mean monthly temperature ( O C)<br />
E<br />
at<br />
u2<br />
<br />
0.351<br />
( es<br />
ea<br />
) (8)<br />
100 <br />
U 2 = wind speed at 2 m height (mile/hr)<br />
e a = Actual vapor pressure (mm Hg)<br />
e s = Saturated vapor pressure (mm Hg)<br />
N = Maximum possible sunshine hours (hr)<br />
n = Sunshine hours (hr)<br />
The Thornthwaite method (Thornthwaite and<br />
Mather, 1957) uses air temperature as an<br />
index of the energy available for<br />
evapotranspiration, assuming that air<br />
temperature is correlated with the<br />
integrated effects of net radiation and other<br />
controls of evapotranspiration, and that the<br />
available energy is shared in fixed<br />
proportion between heating the atmosphere<br />
and evapotranspiration. There is no<br />
correction for different vegetation types.<br />
The Thornthwaite's empirical equation is:<br />
International Journal of Earth Science and Engineering<br />
ISSN 0974-5904, Vol. 02, No. 06, December 2009, pp. 484-498<br />
E<br />
t<br />
10Tn<br />
<br />
1 .6<br />
J<br />
<br />
<br />
a<br />
(9)<br />
Where<br />
E t = Potential evapotranspiration in<br />
centimeter per month.<br />
T n = Mean monthly air temperature (ºC).<br />
n = 1,2,3,......12 is the number of the<br />
considered months.<br />
J = Annual heat index and it is given by the<br />
equation:<br />
12<br />
<br />
J j<br />
(10)<br />
n1<br />
j = is the monthly heat index and it is<br />
expressed as:<br />
<br />
<br />
<br />
T n<br />
<br />
5 <br />
1.514<br />
j (11)<br />
a = 0.49 + 0. 0179J - 0.0000771J 2 +<br />
0.000000675J 3 (12)<br />
The computed monthly potential<br />
evapotranspiration in Eq. 9 is for a standard<br />
month with 360 hours of daylight. It must<br />
be corrected for the varying length of day<br />
with latitude using the appropriate<br />
Actual evapotranspiration data are not<br />
available in the stations employed in this<br />
study. Due to the almost complete lack of<br />
field instruments such as lysimeters, the<br />
Thornthwaite water balance model (Leopold<br />
and Dunne, 1978) was used to estimate the<br />
actual evapotranspiration of the watershed.<br />
The required parameters to determine<br />
actual evapotranspiration using this model<br />
are mean monthly precipitation, mean<br />
monthly potential evapotranspiration, water<br />
holding capacity of the dominant soil type<br />
and monthly soil moisture storage. The<br />
actual evapotranspiration, AET, for the
Water Balance of Haromaya Watershed, Oromiya Region,<br />
Eastern Ethiopia<br />
491<br />
dominant soil types and the respective land<br />
use in the area was weighted according to<br />
the proportion of the area it represents, and<br />
the weighted AET that is the over all actual<br />
evapotranspiration of the watershed was<br />
calculated as<br />
AET<br />
T<br />
AETi<br />
* a<br />
<br />
A<br />
i<br />
………………<br />
(13)<br />
Where AET T = Total Evapotranspiration;<br />
AET i = Annual evapotranspiration<br />
from each soil type<br />
a i = Area of each soil coverage:<br />
A = Total watershed area<br />
Since the watershed is a closed basin where<br />
the surplus entirely goes to infiltration, the<br />
water balance for the study area was<br />
determined by using the following equation.<br />
P - ET - I = 0 (14)<br />
Where ET = Evapotranspiration<br />
I = Infiltration<br />
P = Precipitation<br />
3. Results and Discussions:<br />
3.1 Hydrology:<br />
The hydrology of the catchment has been<br />
examined in terms of rainfall, temperature,<br />
potential evapotranspiration, actual<br />
evapotranspiration and runoff. Detailed<br />
sections on each of these topics follow.<br />
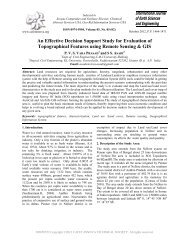
3.1.1 Rainfall:<br />
3.1.1.1 Mean Annual Rainfall:<br />
The rainfall data of the study area was taken<br />
from Haromaya University meteorological<br />
station. The data was collected from the last<br />
26 years records (1979-2005), and the<br />
mean is tabulated and presented in the<br />
Table 3. Accordingly, the mean annual<br />
rainfall of the study area is 770.5 mm. The<br />
mean monthly rainfall averaged over the<br />
twenty-six years period of record for the<br />
Haromaya University station is shown in Fig.<br />
4. The highest rainfall of the area is<br />
recorded in April, May, August and<br />
September which accounts above 62.5% of<br />
the total mean annual rainfall of the area<br />
whereas the minimum rainfall is exhibited in<br />
and January, February, November and<br />
December, which only accounts about 7 %<br />
of the total mean annual rainfall.<br />
3.1.1.2 Seasonality of Rainfall:<br />
The areal pattern of the seasonality of<br />
rainfall in the study area was determined by<br />
analyzing mean monthly rainfall data for one<br />
station in the study area. To compare the<br />
monthly distribution of rainfall at this<br />
station, the method employed here was<br />
adapted from a study of precipitation data<br />
for the Awash River Basin (Daniel, 1974).<br />
This involved the calculation of "rainfall<br />
coefficient" for each month at the station,<br />
the coefficient being the ratio between the<br />
mean monthly rainfall and one-twelfth of the<br />
annual mean (the latter referred to as<br />
"rainfall module"). To distinguish between a<br />
"rainy" month and a "dry" month in the<br />
Awash Basin study, a month is designated<br />
"rainy" when the monthly rainfall coefficient<br />
reaches 0.6 (60 % of the rainfall module),<br />
and distinctly rainy when it exceeds 0.8.<br />
Extremely rainy months have a coefficient of<br />
more than 1 (that is, the rainfall exceeds the<br />
module value) (Daniel, 1974).<br />
In this study, a month was designated<br />
"rainy" if the rainfall coefficient is 0.6 or<br />
over, as in the Awash Basin study. The term<br />
"small rains" is employed to refer to those<br />
months with a rainfall coefficient of 0.6 to<br />
0.9; and the term "big rains" to those<br />
months where the coefficient is 1.0 and<br />
above. The "big" rainy months are further<br />
classified into three groups: those with<br />
"moderate concentration" of rainfall<br />
(coefficient of 1.0 to 1.9); those with "high<br />
concentration" of rainfall (coefficient of 2.0<br />
to 2.9); and those with "very high<br />
concentration" of rainfall (coefficient of 3.0<br />
and above). This scheme of classification is<br />
presented in Table 4.<br />
Table 3: Mean monthly rainfall at Haromaya University station (mm).<br />
Months Jan Feb Mar Apr May Jun Jul Aug Sep Oct Nov Dec MAR<br />
MMR 12 20 54 109 108 46 95 151 114 41 15 7.3 771<br />
Where MMR is Mean monthly rainfall: and, MAR is Mean annual rainfall.<br />
International Journal of Earth Science and Engineering<br />
ISSN 0974-5904, Vol. 02, No. 06, December 2009, pp. 484-498
Mean Monthly Rainfall (mm)<br />
492 NATA TADESSE and ABDULAZIZ MOHAMMED<br />
160<br />
140<br />
120<br />
100<br />
80<br />
60<br />
40<br />
20<br />
0<br />
Jan Feb Mar Apr May Jun Jul Aug Sep Oct Nov Dec<br />
Monthes<br />
Figure 4: Mean monthly rainfall at Haromaya University station (1979-2005).<br />
Table 4: Classification scheme of monthly rainfall values.<br />
Source: Daniel, 1974.<br />
Table 5: Rainfall coefficient at the Haromaya University station.<br />
On the basis of this classification, as<br />
depicted in Table 5, the watershed is<br />
characterized by one rainy season during<br />
the year, i.e., at this station rainy months<br />
are not separated into more than one group<br />
of rainy months by dry months. There are<br />
two dry seasons during the year. The rainy<br />
season in total have eight months: March,<br />
April, May, June, July, August, September<br />
and October.<br />
The rains in March, June and October are<br />
small rain and accounts 18.14 % of the<br />
International Journal of Earth Science and Engineering<br />
ISSN 0974-5904, Vol. 02, No. 06, December 2009, pp. 484-498
Temperature (ºC)<br />
Water Balance of Haromaya Watershed, Oromiya Region,<br />
Eastern Ethiopia<br />
493<br />
average annual rainfall of the watershed.<br />
Big rains with moderate concentration occur<br />
in April, May, July and September and these<br />
accounts 55.24 % of the average annual<br />
rainfall of the watershed. Big rains with a<br />
high concentration occur in August, and this<br />
accounts for 19.57 % of the average annual<br />
rainfall of the watershed.<br />
The watershed is characterized by two dry<br />
seasons. The first dry season starts in<br />
January and ends in February. The second<br />
one starts in November and ends in<br />
December. The amount of rainfall that<br />
occurs during the four months of dry<br />
seasons in total accounts for 7.05% of the<br />
average annual rainfall of the watershed.<br />
The study area has not experienced very<br />
high concentration of rainfall.<br />
3.1.2 Temperature:<br />
Like the rainfall data, temperature data<br />
were taken from Haromaya University<br />
meteorological station. A twenty-six years<br />
(1979-2005) maximum and minimum<br />
temperature data were taken and analyzed.<br />
The mean annual minimum temperature of<br />
the study area is 9.6 ºC and the mean<br />
annual maximum temperature is 23.8 ºC<br />
.The mean annual air temperature of the<br />
area is 16.7 ºC. The mean monthly<br />
maximum and minimum temperature are<br />
observed in March and December, which are<br />
25.2°C and 3.8°C, respectively.<br />
Table 6: Mean monthly temperatures at Haromaya University meteorological station.<br />
Where, MMMxT=Mean monthly maximum temperature (ºC);<br />
MMMnT=Mean monthly minimum temperature (ºC);<br />
MMT=Mean monthly air temperature (ºC); and,<br />
MA: Mean Annual (ºC).<br />
As it is shown in the above table, the minimum air temperature is 13.2ºC in December and<br />
the maximum air temperature is 19.1ºC in June. The annual range of temperature is 5.9ºC.<br />
MMMxT MMMnT MMT<br />
100<br />
10<br />
1<br />
J F M A M J J A S O N D<br />
Months<br />
Figure 5: Mean temperatures at Haromaya University meteorological station.<br />
International Journal of Earth Science and Engineering<br />
ISSN 0974-5904, Vol. 02, No. 06, December 2009, pp. 484-498
MMR (mm)<br />
Temperature (ºC)<br />
494 NATA TADESSE and ABDULAZIZ MOHAMMED<br />
Where, MMMxT=Mean monthly maximum temperature (ºC); MMMnT=Mean monthly<br />
minimum temperature (ºC); and, MMT=Mean monthly air temperature (ºC).<br />
MMR<br />
MMT<br />
160<br />
140<br />
120<br />
25<br />
20<br />
100<br />
80<br />
60<br />
40<br />
20<br />
0<br />
J F M A M J J A S O N D<br />
Months<br />
15<br />
10<br />
5<br />
0<br />
Figure 6: Temperature and rainfall relation at Haromaya University meteorological station.<br />
Where, MMT=Mean monthly air<br />
temperature; and, MMR is Mean Monthly<br />
Rainfall. Figure 6 shows the temperature<br />
and rainfall relations over the period (1979-<br />
2005) for the study area. Even though the<br />
maximum air temperature occurs only in<br />
May and June, high temperature values are<br />
observed during the rainy seasons. Months<br />
in the rainy seasons are warmer than<br />
months in dry seasons. The minimum<br />
temperatures as well as rainfall are also<br />
occurring almost in a similar range of<br />
months.<br />
Table 7: Other important climate data of Haromaya watershed.<br />
Months Jan Feb Mar Apr May Jun Jul Aug Sep Oct Nov Dec<br />
WS 1.8 2 2 1.9 2 2.7 2.6 2.2 1.4 1.2 1.4 1.6<br />
RH 60 61 63 67 72 75 78 77 76 66 62 64<br />
SH 9.4 8.9 8.3 7.2 7.8 7.4 6.9 6.9 6.9 7.8 9.6 9.4<br />
SR 21 22 22 21 21 20 19 20 20 21 22 21<br />
Where<br />
WS is Mean monthly wind speed (m/s);<br />
RH is Mean monthly relative humidity (%);<br />
SH is Mean monthly sunshine hours (Hrs);<br />
and, SR is Mean monthly solar Radiation<br />
(MJ/m 2 /d).<br />
3.1.3 Evapotranspiration:<br />
Evapotranspiration is that portion of the<br />
precipitation which returns back to the<br />
atmosphere through evaporation from a free<br />
water surface, a bare soil or interception on<br />
a vegetal cover and other objects and<br />
transpiration from plants. In this study an<br />
attempt was made to estimate both the<br />
potential evapotranspiration and actual<br />
evapotranspiration for the Haromaya<br />
watershed.<br />
Potential Evapotranspiration:<br />
Both Thornthwaite method (Eq.9) and<br />
modified Penman method (Eq.3) were used<br />
to estimate the potential evapotranspiration<br />
of the watershed.<br />
International Journal of Earth Science and Engineering<br />
ISSN 0974-5904, Vol. 02, No. 06, December 2009, pp. 484-498
Water Balance of Haromaya Watershed, Oromiya Region,<br />
Eastern Ethiopia<br />
495<br />
Thornthwaite Method:<br />
Potential evapotranspiration rates calculated<br />
for the station employed in this study is<br />
given in Table 8. Based on this method the<br />
mean annual potential evapotranspiration of<br />
the study area is 756.3 mm.<br />
Modified Penman Method:<br />
Based on this method (Table 9) the mean<br />
annual potential evapotranspiration of the<br />
study area is 1081.17 mm.<br />
Table 8: Potential evapotranspiration in Haromaya watershed.<br />
Month Jan Feb Mar Apr May Jun Jul Aug Sep Oct Nov Dec Annual<br />
T 14 16 18 18 19 19 18 18 18 16 13 13 16.7<br />
j 4.9 5.7 6.9 7.1 7.6 7.6 7 7 6.8 5.6 4.4 4.3 74.9<br />
LCF<br />
at 1 1 1 1 1.1 1.1 1.1 1 1 1 1 1<br />
10º N<br />
CPET 46 55 68 74 81 82 74 74 70 54 41 40 756.3<br />
Where T = Mean Monthly Air Temperature<br />
(ºC); j = Monthly Heat Index; LCF at 10º N<br />
= Latitude Correction Factor at 10º N;<br />
CPET = Corrected or Adjusted Potential<br />
Evapotranspiration (mm).<br />
Table 9: Potential evapotranspiration (PET) of Haromaya watershed.<br />
Actual Evapotranspiration:<br />
The actual evapotranspiration was computed<br />
based on water balance method. In this<br />
method, the input variables are precipitation<br />
and temperature; the only parameter is the<br />
available water capacity of the soil. The<br />
available water capacity (AWC) of the soil is<br />
the total amount of water held in the soil<br />
between the -15 bar (wilting point) and 0.33<br />
bar (field capacity) potentials (Stephen,<br />
1999). The available water capacity is<br />
determined per unit depth of soil. The<br />
available water capacity can be measured,<br />
or it can be estimated from figure or table.<br />
The amount of water available to a crop can<br />
be determined from the product of rooting<br />
depth and available water capacity. In this<br />
study the suggested values of available<br />
water capacities for combinations of soil<br />
texture and vegetation by Thornthwaite and<br />
Mather (1957) was used. The different land<br />
use together with their respective soil and<br />
International Journal of Earth Science and Engineering<br />
ISSN 0974-5904, Vol. 02, No. 06, December 2009, pp. 484-498
496 NATA TADESSE and ABDULAZIZ MOHAMMED<br />
aerial coverage, and available water capacity<br />
of the root zone is summarized and given in<br />
the table below.<br />
The available water capacity for each soil<br />
type and the respective land use in the area<br />
was weighted according to the proportion of<br />
the area they represent, and the weighted<br />
available water capacity was calculated by<br />
utilizing Eq. 15 to determine the available<br />
water capacity of the soil for the entire<br />
watershed. Accordingly, the AWC of the soil<br />
in the watershed is 100 mm.<br />
AWCw = ∑AWCi * ai/A …….(15)<br />
AWCw = AWC of the soil in the watershed<br />
AWCi = AWC of each soil type and its<br />
respective land use<br />
Ai = area of each soil type and its respective<br />
land use<br />
A = area of the watershed (irrespective of<br />
the swampy and settlement areas)<br />
Table 10: Available water capacity of root zone of each land use with the respective soil<br />
type<br />
Land use<br />
Soil type<br />
AWC Root<br />
Area<br />
(Km 2 Depth<br />
) (%)<br />
(mm)<br />
AWCRZ<br />
Cultivated<br />
land<br />
Sandy loom(fine sand) 4.5 10 350 35<br />
Cultivated<br />
land<br />
Clay loom 21.7 25 350 87.5<br />
Cultivated<br />
land<br />
Clay 12.8 30 350 105<br />
Cultivated Sandy clay loom<br />
land<br />
(fine sand loom)<br />
3.2 15 350 52.5<br />
Forest Clay loom 0.3 25 2000 500<br />
Grazing land Clay loom 0.5 25 250 62.5<br />
Grazing land Clay 1.3 30 250 75<br />
Grazing land<br />
Sandy clay loom<br />
(fine sand loom)<br />
2.3 15 250 37.5<br />
Settlement On different soil types 2.4 …. …. …<br />
Shrub Sandy loom(fine sand) 0.01 10 1500 150<br />
Shrub Clay loom 2.4 25 1500 375<br />
Swampy area Sandy clay loom 2.4 … … ….<br />
Total 53.8<br />
Through the calculation of an average water<br />
balance, actual evapotranspiration was<br />
estimated for the watershed irrespective of<br />
the swampy and settlement area. The result<br />
is summarized and is given in Table 11.<br />
Accordingly, the mean annual actual<br />
evapotranspiration of the watershed without<br />
considering the swampy and settlement<br />
area is 659.4 mm.<br />
Table 11: Water balance for Haromaya watershed (without swampy area and settlement).<br />
All values are in millimeter.<br />
International Journal of Earth Science and Engineering<br />
ISSN 0974-5904, Vol. 02, No. 06, December 2009, pp. 484-498
Water Balance of Haromaya Watershed, Oromiya Region,<br />
Eastern Ethiopia<br />
497<br />
Where P = Mean Monthly Precipitation; CPET<br />
= Corrected Potential Evapotranspiration;<br />
P - CPET = is Difference by Subtraction;<br />
ACPWL = Accumulated Potential Water Loss;<br />
SM = Soil Moisture; ΔSM = Change in Soil<br />
Moisture During the Month; AETactual =<br />
Actual Evapotranspiration.<br />
The land uses that are not taken into<br />
consideration through the water balance<br />
calculation are settlement and swampy<br />
areas. It is difficult to quantify the<br />
evapotranspiration from settlement areas.<br />
According to Reichert (2001), the results of<br />
different modeled land use set-ups reveal<br />
that the mean annual evapotranspiration<br />
difference between the extreme-agricultureand<br />
extreme-settlement-scenario is only 16<br />
mm, which is insignificant to affect the over<br />
all results. On the basis of Reichert (2001)<br />
idea, the actual evapotranspiration of the<br />
settlement area, which is 4.46 % of the<br />
total, is considered as negligible. The<br />
swampy area was assumed to have<br />
evapotranspiration at potential rate all over<br />
the year. The actual evapotranspiration for<br />
the entire watershed was computed using<br />
Eq. 13. Accordingly, the mean annual actual<br />
evapotranspiration of the watershed is<br />
693.14 mm<br />
3.1.4 Runoff:<br />
The study area is a closed basin. There is no<br />
runoff that leaves the watershed.<br />
Consequently, the surplus water, which is<br />
readily available for both runoff and<br />
infiltration, entirely goes to the infiltration<br />
component:<br />
3.2 Water Balance:<br />
The main purpose of this computation is to<br />
make a quantitative evaluation of the<br />
amount of water that percolate into the<br />
ground to recharge the groundwater<br />
circulation occurring in the investigated<br />
area. Various assumptions have been made<br />
to derive the water balance equation for the<br />
studied area and these are summarized<br />
below:<br />
1. Since the computations are made on<br />
annual basis, net change of soil moisture<br />
and groundwater storage is assumed to be<br />
zero.<br />
2. Subsurface water exchange with<br />
neighboring basins is assumed to be zero.<br />
3. Assuming no artificial diversion from<br />
other basins.<br />
Since the basin is a closed basin, the main<br />
outflow pathway of the water that comes in<br />
the form of rain is chiefly through<br />
evapotranspiration. Consequently, the water<br />
balance equation for the studied area is<br />
written as follows, which is Eq. 14;<br />
P - ET - I = 0<br />
Where ET = Evapotranspiration;<br />
I = Infiltration; and P = Precipitation.<br />
From the budget equation, Eq. 14, the<br />
amount of water that percolates into the<br />
ground in the Haromaya watershed as a<br />
groundwater accretion has been calculated<br />
as follows:<br />
P = 770.5 mm, ET = 693.14 mm<br />
From Eq. 14 ,<br />
I = P - ET (16)<br />
Therefore,<br />
I = (770.5 – 693.14) mm = 77.36 mm<br />
In terms of water volume measured in cubic<br />
meter, I expressed as:<br />
A s = Area of the watershed = 53.8 x 10 6 m 2<br />
ET = 37.29 x 10 6 m 3<br />
P = 41.45 x 10 6 m 3<br />
Therefore,<br />
I = (41.45 – 37.29) x 10 6 m 3<br />
= 4.16 x 10 6 m 3<br />
Annual discharge of groundwater from<br />
boreholes and hand dug wells for domestic<br />
and non-domestic uses in the watershed is<br />
2149131 cubic meter. Therefore, the net<br />
amount of water that percolates into the<br />
ground, In, is given by:<br />
In = I - 2149131 m 3 (17)<br />
In = 2.01 x 10 6 m 3<br />
Based on the above calculation, therefore, it<br />
is possible to say that the net total amount<br />
of water which is actually available to<br />
recharge the groundwater circulation within<br />
the Haromaya hydrological basin is 2.01<br />
million cubic meter.<br />
4. Conclusion:<br />
The study area receives a mean annual<br />
rainfall of 770.5mm. The mean annual<br />
actual evapotranspiration is 89.96 % of the<br />
mean annual rainfall. Since the watershed is<br />
a closed basin, the main and the only<br />
outflow component is evapotranspiration.<br />
International Journal of Earth Science and Engineering<br />
ISSN 0974-5904, Vol. 02, No. 06, December 2009, pp. 484-498
498 NATA TADESSE and ABDULAZIZ MOHAMMED<br />
The mean annual surplus, which is available<br />
only for infiltration is 10.04% of the mean<br />
annul rainfall. The net total amount of water<br />
which is actually available to recharge the<br />
groundwater circulation within the<br />
Haromaya hydrological basin is 2.01 million<br />
cubic meter. In general, the Haromaya<br />
watershed has very good groundwater<br />
potential, if it is developed and utilized in<br />
controlled manner.<br />
5. Acknowledgment:<br />
The Hare Town Water Supply and Sewerage<br />
Authority is duly acknowledged for funding<br />
this research project and also providing the<br />
necessary data. Thanks are also due to all<br />
those friends who helped during field, and<br />
lab and for going through the manuscript<br />
and providing constructive suggestions.<br />
6. Reference:<br />
[1] Daniel Gamachu (1974). Aspects of<br />
climate and water budget in Ethiopia,<br />
Addis Ababa University Press, Addis<br />
Ababa.<br />
[2] Johnson, P.A., and Curtis, P.D (1994).<br />
Water Balance of Blue Nile River Basin in<br />
Ethiopia-.Journal of Irrigation and<br />
Drainage Engineering, vol. 120-pp. 573–<br />
589.<br />
[3] Kebede, S. and Travi, Y (2004).<br />
Applications and limitations of stable<br />
isotopes of water in evaporation studies:<br />
the case of Ethiopian lakes. Paris,<br />
International workshop on the<br />
application of isotope techniques in<br />
hydrological and environmental studies,<br />
September 6–8. UNESCO, pp. 143–144.<br />
[4] Kebede, S., Y. Travi, T. Alemayehu, V.<br />
Marc (2006). Water balance of Lake<br />
Tana and its sensitivity to fluctuations in<br />
rainfall, Blue Nile basin, Ethiopia -<br />
Journal of Hydrology, vol. 316-pp. 233–<br />
247.<br />
[5] Leopold, L. B. and Dunne, T. (1978).<br />
Water in environmental planning, W. H.<br />
Freeman and Company, San Francisco.<br />
[6] Ministry of Water Resources (2001).<br />
Initial national communication of<br />
Ethiopia to the United Nations<br />
Framework Convention on Climate<br />
Change (UNFCCC), A report submitted to<br />
the conference of parties of the UNFCCC<br />
under the GEF support Climate Change<br />
Enabling Activities Project of Ethiopia,<br />
Ethiopia, Addis Ababa.<br />
[7] Nata Tadesse (2006). Surface Waters<br />
Potential of the Hantebet Basin, Tigray,<br />
Northern Ethiopia - Agricultural<br />
Engineering International: CIGR<br />
Ejournal, Manuscript LW 05 010. Vol.<br />
VIII,<br />
[8] Nata T., Dubey N., Mintesnot K. and<br />
Shami M. (2006).<br />
Water Balance of<br />
Haromaya Basin, Unpublished Report,<br />
Department of Applied Geology, Mekelle<br />
University, Mekelle.<br />
[9] Reichert D. (2001). Der Einfluß der<br />
Landnutzung auf Verdunstung und<br />
Grundwasserneubildung - Modellierungen<br />
und Folgerungen für das Einzugsgebiet des<br />
Glan, The Potsdam Institute for Climate<br />
Impact Research (PIK) Report; Report No.<br />
73; Potsdam, Germany.<br />
[10] Ritter, Michael E. (2006). The Physical<br />
Environment: an Introduction to Physical<br />
Geography.<br />
http://www.uwsp.edu/geo/faculty/ritter/<br />
geog101/textbook/title_page.html,<br />
Accessed date 03/02/2009.<br />
[11] Shahin, M. (1988). Hydrology of the<br />
Nile basin. The Netherlands:<br />
International Institute for Hydraulic and<br />
Environmental Engineering, Elsevier.<br />
[12] Shaw, Elizbeth M. (1994). Hydrology in<br />
practice: 3 rd Edition, Chapman & Hall,<br />
London.<br />
[13] Stephen A. Thompson (1999).<br />
Hydrology for Water Management, A. A.<br />
Balkema, Rotterdam.<br />
[14] Thornthwaite, C.W and Mather, J.R.<br />
(1957). Instructions and tables for<br />
computing potential evapotranspiration<br />
and the water balance, Publication in<br />
Climatology, Center ton, X, No3, pp.<br />
185-204, New Jersey.<br />
[15] UNESCO (1974). Methods for Water<br />
Balance Computations, Beugnet, pp. 1-<br />
127, Paris.<br />
[16] Valet-Coulomb, C., Legesse, D., Gasse,<br />
G., Travi, Y., Chernet, T. (2001). Lake<br />
evaporation estimates in tropical Africa<br />
(Lake Ziway, Ethiopia), Journal of<br />
Hydrology, vol. 245-pp. 1–17.<br />
International Journal of Earth Science and Engineering<br />
ISSN 0974-5904, Vol. 02, No. 06, December 2009, pp. 484-498