02050552 - Cafet Innova
02050552 - Cafet Innova
02050552 - Cafet Innova

You also want an ePaper? Increase the reach of your titles
YUMPU automatically turns print PDFs into web optimized ePapers that Google loves.
www.cafetinnova.org<br />
Indexed in<br />
Scopus Compendex and Geobase Elsevier, Chemical<br />
Abstract Services-USA, Geo-Ref Information Services-USA<br />
ISSN 0974-5904, Volume 05, No. 05 (02)<br />
October 2012, P.P. 1464-1471<br />
An Effective Decision Support Study for Evaluation of<br />
Topographical Features using Remote Sensing & GIS<br />
P. V. S. VARA PRASAD 1 and S S. ASADI 2<br />
1 Dept.of. Civil Engineering,C.M.J.University,Shillong<br />
2 Dept.of. Civil Engineering, KL University, Green fields, Vaddeswaram-522502, Guntur (D.t), A.P, India<br />
Email: asadienviron.asadi@gmail.com<br />
Abstract: Land resources are required for agriculture, forestry, rangeland, urbanization and many other<br />
developmental activities satisfying human needs. creation of Landuse/Landcover mapthese resources information<br />
system with the help of Remote sensing and Geographic Information System (GIS) tools could be helpful in getting<br />
the precise and valuable spatial information in understanding the present scenario contemplating with the past data<br />
and predicting the future trends. The main objective of the study is to evaluate and map the Land use/Land cover<br />
characteristics in the study area and to develop methods for its efficient utilization. The Land use/Land cover map of<br />
the study area was prepared from linearly enhanced fused data of IRS-ID PAN and LISS-III merged satellite<br />
imagery and Survey Of India (SOI) toposheets on 1:50,000 scale using visual interpretation technique using<br />
AutoCad and Arc/Info GIS software forming the spatial database.The study of topographical characterization of an<br />
area is useful to plan the basic minimum needs of farmers, thereby improving their socio-economic conditions and<br />
helps in evolving a broad national policy which can be applied by decision makers for sustainable development of<br />
any given area.<br />
Keywords: topographical futures, characterization, Land use /Land cover, Remote sensing, Geographical<br />
Information System.<br />
1. Introduction:<br />
Water is a vital natural resource, water is a key resource<br />
in all-economic activities ranging from agriculture to<br />
industry. Only a tiny fraction of the planet’s abundant<br />
water is available to us as fresh water (Hassan, A.A<br />
et.al, 1974). About 97% is found in the oceans and is<br />
too salty for drinking, irrigation, or industry. The<br />
remaining 3% is fresh water. About 2.997% of it is<br />
locked up in ice caps or glaciers or is buried so deep that<br />
it costs too much to extract. Only about 0.0035 of<br />
Earth’s total volume of water is available.In India of<br />
total available water resource 1869 bcm, the usable,<br />
water resources are only 1122 bcm, which consists<br />
surface water 690bcm, ground water 432 bcm, which<br />
the present per capita available water resources is<br />
1122cm and by 2050 it is likely to reduce to 748 cm.<br />
When the countries per capita water availability is less<br />
than 1700 cm it is considered as water stress country<br />
(Seetharaman.R, 2004). Andhra Pradesh being<br />
predominantly an agricultural state. Necessitates the<br />
practice of conjunctive use of surface and ground water<br />
in its deltas. Pennar river in Nellore district is no<br />
exemption of impact due to Land use/Land cover<br />
changes. Increasing population in Nellore and its<br />
surrounding areas are resulting in ground water<br />
consumption its effects the water quality and quantity.<br />
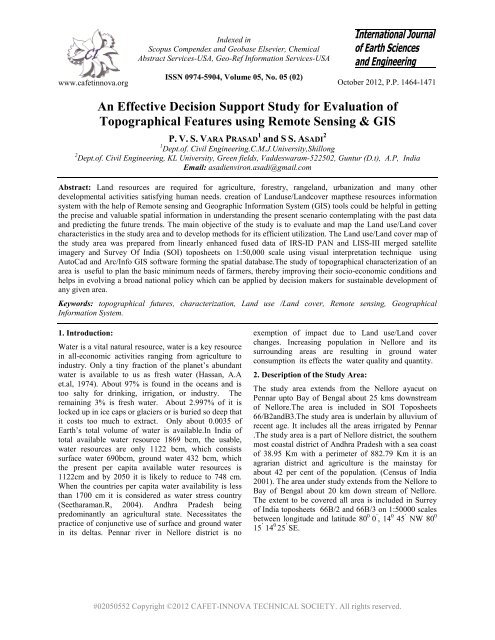
2. Description of the Study Area:<br />
The study area extends from the Nellore ayacut on<br />
Pennar upto Bay of Bengal about 25 kms downstream<br />
of Nellore.The area is included in SOI Toposheets<br />
66/B2andB3.The study area is underlain by alluvium of<br />
recent age. It includes all the areas irrigated by Pennar<br />
.The study area is a part of Nellore district, the southern<br />
most coastal district of Andhra Pradesh with a sea coast<br />
of 38.95 Km with a perimeter of 882.79 Km it is an<br />
agrarian district and agriculture is the mainstay for<br />
about 42 per cent of the population. (Census of India<br />
2001). The area under study extends from the Nellore to<br />
Bay of Bengal about 20 km down stream of Nellore.<br />
The extent to be covered all area is included in Surrey<br />
of India toposheets 66B/2 and 66B/3 on 1:50000 scales<br />
between longitude and latitude 80 0 0 ’ , 14 0 45 ’ NW 80 0<br />
15 ’ 14 0 25 ’ SE.<br />
#<strong>02050552</strong> Copyright ©2012 CAFET-INNOVA TECHNICAL SOCIETY. All rights reserved.
1465 P. V. S. VARA PRASAD and S S. ASADI<br />
2.1 Study Objectives:<br />
To extract and understand the topographical<br />
characteristics of the study area for effective<br />
management and future development<br />
To create spatial digital database consisting of Land<br />
use/Land cover, Drainage, Watershed, Base maps<br />
using IRS-ID PAN & LISS-III merged satellite<br />
data, SOI toposheets and ground data on<br />
ARC/INFO GIS platform<br />
To generate attribute data base consisting of<br />
statistical details of each of the above thematic<br />
layers<br />
3.Methodology:<br />
3.1 Data collection:<br />
Different data products required for the study include<br />
Survey of India (SOI) toposheets bearing with numbers<br />
66B/2 and 66B/3 on 1:50,000 scale. Fused data of IRS–<br />
1D PAN and LISS-III satellite imagery obtained from<br />
National Remote Sensing centre (NRSC), Hyderabad,<br />
India. Collateral data collected from related<br />
organizations, comprises of demographic data.<br />
3.2 Data Creation:<br />
In GIS, topology is the term used to describe the<br />
geometric characteristic of objects, which do not change<br />
under transformations and are independent of any<br />
coordinate system. The topological characteristics of an<br />
object are also independent of scale of measurement.<br />
Topology as it relates to spatial data and non-spatial<br />
data consists of three elements, namely adjacency,<br />
containment and connectivity. Broadly, topology can be<br />
explained in two ways. Topology consists of metric<br />
aspects of spatial relations, such as size, shape, distance<br />
and direction. Many spatial relations between objects<br />
are topological in nature, including adjacency,<br />
containment and overlap. The geometric relationship<br />
between spatial entities and corresponding attributes are<br />
very crucial for spatial analysis and integration in GIS.<br />
In topology creation both the spatial and attribute data<br />
are linked from which different parameter maps are<br />
Figure 1: Location Map of Study Area<br />
generated. These maps depict the spatial distribution of<br />
non-spatial information on spatial locations.<br />
3.3 Digital Thematic Mapping:<br />
The procedure consists of a set of above image<br />
elements or characteristics which help in the<br />
recognition or interpretation of various land use /land<br />
cover, Drainage map, Watershed map, Base map<br />
features systematically on the enhanced satellite<br />
imagery during the classification of features (Lillesand,<br />
2000) The land use/ Land cover .The classification<br />
system used in this study is the system which is<br />
pioneered by United States Geological Survey (USGS)<br />
and is modified by National Remote Sensing<br />
Agency(NRSC) according to Indian conditions. The<br />
details of this LU/LC system is beyond this study and<br />
one can be referred NRSC, LU/LC book. A preliminary<br />
image classification key is prepared for the fussed<br />
pictorial data and is used during interpretation process.<br />
Using the image interpretation key, preliminary<br />
interpretation of satellite imagery is carried by<br />
transferring the features from base map on to the<br />
transparency. This transparency with base line data<br />
features is then overlaid on the satellite imagery. Then<br />
the features of LU/LC are extracted and transferred<br />
from the satellite pictorial data.<br />
The doubtful areas (due to similar spectral response and<br />
spectral signature) identified during the preliminary<br />
image classification are listed out before ground<br />
verification. After finalizing the ground traverse plan<br />
the doubtful areas are physically verified and field<br />
observation about terrain condition and land use pattern<br />
are noted. Ground photographs taken during field data<br />
collection is enclosed for understanding its use in image<br />
classification for Land use / Land cover system.Based<br />
on the ground information collected, corrections and<br />
modifications of miss classified land use/land cover<br />
details and doubtful areas are carried out on enhanced<br />
imageries for final land use/land cover classification.<br />
The final land use/land cover classes are separated by<br />
assigning standard colors with respect to each one of the<br />
land use/land cover classes.<br />
International Journal of Earth Sciences and Engineering<br />
ISSN 0974-5904, Vol. 05, No. 05 (02), October 2012, pp. 1464-1471
An Effective Decision Support Study for Evaluation of<br />
Topographical Features using Remote Sensing & GIS<br />
1466<br />
3.4 Data Integration:<br />
The work schedule gives the following principle steps<br />
involved.<br />
1) Collection of toposheet from survey of India<br />
(1:50000 scale).<br />
2) Collection of data from satellite fused data of IRS–<br />
1D PAN and LISS-III satellite obtained from<br />
NRSC.<br />
3) Delineation of the study area and conversion of<br />
raster data into vector data.<br />
4) Preparation of thematic maps with the help of<br />
secondary data and primary data.<br />
5) the above data is then exported to ARC/INFO and<br />
further processed in ArcView GIS software to create<br />
digital database for subsequent data analysis.<br />
6) Study of the Land use/Land cover ,Drainage,<br />
watershed, Base features and their influence on the<br />
study area<br />
3.5 Spatial Database:<br />
The spatial database relevant for this study are thematic<br />
maps of the present study area.<br />
1) Base map<br />
2) Land use / Land cover map<br />
3) Watershed map<br />
4) Drainage map<br />
4. Results and Discussion:<br />
4.1 Base map:<br />
Maps are representation of features on the surface of the<br />
earth drawn to a scale.A topographic map is a<br />
representation of the shape, size, position and relation of<br />
the physical features of an area. A base map consists of<br />
various features like the road network, settlements,<br />
water bodies, canals, railway track, vegetation etc.<br />
which are delineated from the toposheet. The map thus<br />
drawn is scanned and digitized to get a digital output.A<br />
map which depicts the outline structure of the district is<br />
called as base map. The base map is prepared using<br />
Survey of India (SOI) toposheets 66B/2 and 66B/3) on<br />
1:50000 scale and updated with the help of satellite<br />
imagery. The information content of this map is used as<br />
a baseline data to finalize all the other physical features<br />
of maps. The features included in the base map in<br />
general are district boundary, taluk/ block/mandal<br />
boundary, rivers / water bodies, district / mandal<br />
headquarters, major settlements, major roads, railways<br />
and other towns. The characteristic features of the study<br />
area are:<br />
• Major Roads<br />
• Settlements<br />
• Rivers<br />
• Water bodies<br />
Since the toposheets are very old and prepared long<br />
back, the major roads, railways and the other<br />
settlements which are recently developed are updated<br />
using satellite image and existing maps.The major<br />
settlements in the present study area are Nellore,<br />
Utukuru, Vidavalure,Chankacherla, Mudiratipalem,<br />
Gangapatnam etc. and the major water bodies<br />
represented in the base map include Penna river and<br />
Vidavalure tank. The south central railway line passes<br />
through the study area along with the NH-5.which<br />
connect different places.<br />
4.2 Drainage Network Map:<br />
The drainage map consists of all water bodies, rivers,<br />
tributaries, perennial & ephemeral streams, reservoirs,<br />
tanks, ponds and the entire drainage network from first<br />
order originating in the area to the last order joining the<br />
rivers, tributaries and tanks based on topography.<br />
Understanding the importance of drainage depends on<br />
the purpose and the objective of the project. For the<br />
present study purpose the following factors have to be<br />
understood and extracted from the study of the drainage<br />
pattern. Drainage network helps in delineation of<br />
watersheds. Drainage density and type of drainage gives<br />
information related to runoff, infiltration relief and<br />
permeability. In the study area has been observed<br />
Dendritic,Trellis,Rectangular,Parallel drainage patron.<br />
Dendritic drainage indicates homogenous rocks, the<br />
trellis, rectangular and parallel drainage patterns<br />
indicate structural and lithological controls. The coarse<br />
drainage texture indicates highly porous and permeable<br />
rock formations whereas fine drainage texture is more<br />
common in less pervious formations. Weathering profile<br />
controls of ground water and above all discharge of<br />
surface water along the major streams and rivers.<br />
Fractured pattern and other structural features control<br />
drainage pattern in hard rocks. Slope/gradient of area<br />
coupled with drainage density decides the weathering<br />
profile. These two factors synthesized with rainfall (of a<br />
given area) provide information on the ground water<br />
potential (weathering profile, structural factors) and<br />
discharge of surface water along streams. Weathering<br />
profile increases groundwater potential, slope/gradient<br />
together with runoff controls the thickness of weathered<br />
zone.Major faults, lineaments sometimes connects two<br />
are more watersheds and act as conduits<br />
(Interconnecting channel ways). Flow of groundwater<br />
along these week zones is an established fact. A proper<br />
understanding of the major faults, their influence of<br />
groundwater flow has to be understood from drainage<br />
system and its controls. The study of the drainage for<br />
the present purpose is to understand that, to what extent<br />
the ground water would be affected by the water<br />
pollutants. Survey of India topomaps, satellite data of<br />
summer season are the main input data for preparation<br />
of drainage map. The drainage map is prepared using<br />
International Journal of Earth Sciences and Engineering<br />
ISSN 0974-5904, Vol. 05, No. 05 (02), October 2012, pp. 1464-1471
1467 P. V. S. VARA PRASAD and S S. ASADI<br />
toposheets of Survey of India in 1:50,000 scale and<br />
updated using latest satellite data wherever deviations<br />
and new developments are observed. Step I: All the<br />
rivers its tributaries and drainage network shown on the<br />
toposheets are captured. The boundaries of all<br />
rivers/water bodies with names appearing are captured<br />
from toposheets. The drainage is drawn from whole to<br />
part, i.e., from the rivers to tributaries to first drains to<br />
second order drains to third order drains. Step II: Based<br />
on the post monsoon satellite image extent of water<br />
spread and dry parts are updated. The water bodies<br />
which did not exist at the time of survey of toposheets,<br />
if any are also captured based on satellite imagery.The<br />
study area forms lower part of Pennar basin and the<br />
river Pennar flows through the middle of the area from<br />
western part, towards East. All these rivers and rivulets<br />
get dry for major part of the year and carry heavy floods<br />
during rainy season. The Pennar river is most<br />
important river, a boon to the eastern half of the taluks<br />
of Nellore and Kovvur. It flows for about 112 kms in<br />
the area through Atmakur and between Kovvur and<br />
Nellore and falls into the Bay of Bengal.The Penner<br />
river confluence with Cheyyeru three km before<br />
Somasila gorge and is traversed and enters the Nellore<br />
district. The Somasila anicuts is at this point the border<br />
of Nellore and Kudapa Dist. Flows slightly towards<br />
north east up to Sangam Anicut, The River turns in a<br />
south-easterly direction towards Nellore Anicut. A few<br />
kilometers below Nellore town, the course takes a sharp<br />
turn to the north-east and falls into the Bay of Bengal<br />
Sea at Utukur estuarine region. The Pennar Delta is<br />
having a four major, fourteen medium and forty-one<br />
minor drains. The main drain basins are Maldevi, the<br />
Alluri swamp, Nakklavagu and Paideru vagu. The<br />
Paideru traversing for distance of 43.2 Km joins the Sea<br />
at Ponnapudi village at Vidavaluru mandal. The rest<br />
three drains, River Pennar, Chippaleru and Uppateru,<br />
which finally empties into sea.The Penner and its<br />
tributaries are practically dry before the on set of SW<br />
monsoon and they begin to flow after the rains. The<br />
maximum flow in the river will be during the months of<br />
August, September and October. After December, the<br />
rivers are practically dry. It has two old anicuts<br />
constructed by British one at Sangam and the other at<br />
Nellore and a Major Irrigation project the Somasila<br />
constructed recently.<br />
4.3 Watershed Map:<br />
Watersheds are hydrological units that are considered to<br />
be efficient and appropriate for assessment of available<br />
resources and subsequent planning and implementation<br />
of various development programmes. The watershed<br />
map is prepared in accordance with the National<br />
Watershed Atlas (1990). India is divided into 6 regions<br />
out of which the present study area comes under<br />
Region-4 i.e. the river flowing into Bay of Bengal. The<br />
total area occupied by this region is 1130.48 lakh.<br />
Present study area falls under basin-C i.e. between<br />
Cauvery and Krishna basin which has a total area of<br />
14,606 hectares. The total catchment is divided as 3 and<br />
4 which includes Pennar (5740 ha) and Pennar Krishna<br />
(2426 ha). The 3 catchment is further divided into A, B,<br />
C, D etc sub-catchments. The sub-catchment-A i.e.<br />
Lower Pennar 536 ha consists of the present study area<br />
and occupies the 1(Right Bank Pennar) and 2 (Left<br />
Bank Pennar) watersheds. The 4 catchment is further<br />
divided into A, B, C, and D etc sub-catchments. The<br />
sub-catchment-A i.e. Maneru 479 ha consists of the<br />
present study area and occupies the 1(Bungale) and<br />
2(Upputeru) watersheds. For a detailed study the<br />
4C3A1, 4C3A2 and 4C4A1 watersheds are further<br />
divided into sub-watersheds (4C3A1a etc.), miniwatersheds<br />
(4C3A1a1 etc.) and micro-watersheds<br />
(4C3A1a1a etc.).<br />
Table: Land Use / Land Cover Classification<br />
Landuse / Landcover<br />
Double Crop 12305<br />
Single Crop 8615<br />
Aquaculture 10812<br />
Dry river 1921<br />
Scrub forest 831<br />
Land with Scrub 910<br />
Fallow lands 11<br />
Plantations 750<br />
Scrub forest 784<br />
Marshy/Swamp lands 220<br />
Saltpans 131<br />
Settlements 726<br />
Dry tank /River 1343<br />
River/tank with water 1546<br />
Sand area 775<br />
Water logged area 25<br />
4.4 Land Use / Land Cover Map:<br />
Area In Ha<br />
The LU/LC map (Fig.) of the study area is prepared<br />
from satellite imagery using visual interpretation<br />
technique. This technique consists of a set of image<br />
elements, which help in the recognition or interpretation<br />
of various land use /land cover features systematically<br />
on the enhanced satellite imagery during the<br />
classification of features (Lillesand and Kiefer 1994).<br />
A preliminary image classification key is prepared for<br />
the fused pictorial data and is used during interpretation<br />
process. The base map is overlaid on the satellite<br />
imagery. Then the features of LU/LC classes are<br />
International Journal of Earth Sciences and Engineering<br />
ISSN 0974-5904, Vol. 05, No. 05 (02), October 2012, pp. 1464-1471
An Effective Decision Support Study for Evaluation of<br />
Topographical Features using Remote Sensing & GIS<br />
1468<br />
extracted and transferred from the satellite pictorial<br />
data. The doubtful areas (due to similar spectral<br />
response and spectral signature) identified during the<br />
preliminary image classification are listed out before<br />
ground verification. The doubtful areas are physically<br />
verified by field observation, based on which,<br />
corrections and modifications of misclassified land<br />
use/land cover details are carried out for preparation of<br />
final maps so as to extract the entropy or information<br />
content in accordance with the above thematic maps.<br />
Land use / land cover map showing the spatial<br />
distribution of various categories and their aerial extent<br />
is vital for the present study. The spatial distributions of<br />
various land uses are interpreted based on IRS–1D<br />
PAN and LISS-III satellite data. The land use/land<br />
cover major categories such as built-up land,<br />
agriculture, forest, water body and wastelands has been<br />
observed on the study area.<br />
4.4.1Settlements:<br />
Figure 2: Pie Chart Showing Land Use / Land Cover Distribution<br />
It is defined as an area of human habitation developed<br />
due to non agricultural use and that which has a cover of<br />
buildings, transport, and communication, utilities in<br />
association with water, vegetation and vacant lands<br />
Settlements appears as dark bluish green in the core and<br />
bluish on the periphery on satellite imagery. It may be<br />
either big or small in size, irregular in shape with coarse<br />
or mottled texture. The total settlements area in the<br />
present study is about 726 Ha, which includes some<br />
parts of Nellore, Utukuru, Vidavalure,Chankacherla,<br />
Mudiratipalem, Gangapatnam etc.<br />
4.4.2Agriculture Area:<br />
It is defined as the land primarily used for farming and<br />
for production of food, fiber, commercial and<br />
horticultural crops. It include land under crops (irrigated<br />
and unirrigated), fallow and plantations etc.<br />
4.4.3Crop Land:<br />
It is evident from the study of the two seasons data that<br />
most of the double cropped area is seen under canal<br />
command or ground water irrigation area. The cropping<br />
intensity is high in these areas because of the physical<br />
factors like flat terrain, good alluvial soils, good rainfall<br />
and assured irrigation from delta canals of Somasila<br />
reservoir. Most of the double cropped area was found in<br />
both banks of Pennar river and area is estimated to be<br />
12305ha. Single crop area found to be 8615 ha.<br />
4.4.4Fallow Lands:<br />
Fallow land is described as agricultural land which is<br />
taken up for cultivation but is temporarily allowed to<br />
rest, un cropped for one or more seasons, but not less<br />
than one year. These lands are particularly those which<br />
are seen devoid of crops at the time, when imagine<br />
taken up for both seasons. The area under this category<br />
is estimated as 11 ha.<br />
4.4.5Plantations:<br />
It is described as an area under agricultural tree crops,<br />
planted adopting certain agricultural management<br />
techniques. It includes coconut, arecant, citrus, orchards<br />
and other horticultural nurseries. This mostly confined<br />
to the beach ridges, sandy areas and along river courses.<br />
Plantation can be seen very prominently on the imagery<br />
with a dark red to red tone, regular in shape, sharp edges<br />
and coarse to medium texture. Their size varies from<br />
small to medium. The area under this category forms<br />
750 ha.<br />
4.4.6 Scrub Forest:<br />
It is an area bearing an association predominately of<br />
trees and other vegetation types capable of producing<br />
International Journal of Earth Sciences and Engineering<br />
ISSN 0974-5904, Vol. 05, No. 05 (02), October 2012, pp. 1464-1471
1469 P. V. S. VARA PRASAD and S S. ASADI<br />
timber and other forest produce. The scrub forest<br />
describes as a forest where the vegetative density is less<br />
than 20% of the canopy cover. It is the result of both<br />
biotec and abiotic influences. Scrub is a stunted tree or<br />
bush/ shrub. Most of the low lying hills are in degraded<br />
conditions consistingof mixed dry deciduous types of<br />
species and it appears as light green colour in satellite<br />
image. In the present study scrub forest identified as<br />
831 ha.<br />
4.4.7 Aqua Culture:<br />
Swampy areas and double cropped areas are converted<br />
into fish tanks by specially constructed ponds according<br />
to specifications for pisciculture. Due to its high<br />
economic yields, this culture is fast spreading in all the<br />
suitable areas. Most of the aquaculture activities are<br />
identified and mapped near the coastal marshy lands and<br />
right bank side of the Pennar, area under aquaculture is<br />
estimated 10812 ha.<br />
4.4.8 Marshy/ Swamp Lands:<br />
Marshy land is that which is permanently or periodically<br />
inundated by water and is characterized by vegetation<br />
which includes grasses and weeds. This category of<br />
land is estimated to be 220 ha.<br />
4.4.9 Land with Scrub:<br />
It is the land, which has an undulating topography with<br />
thin soil cover and scattered trees/ scrubs. These lands<br />
are being used for grazing and are ideal sites for<br />
plantations. 910 ha<br />
4.4.10 Water Bodies:<br />
The water bodies are identified based on their tone,<br />
regular to irregular shape & smooth to mottled texture<br />
on the satellite imagery. Surface water spread of the<br />
tank or lake varies from season to season. The major<br />
river present in the study area includes the Pennar river.<br />
It appears as long, narrow to wide feature on the<br />
imagery with an irregular shape and a smooth texture.<br />
The water bodies mainly tanks in the study area<br />
occupied 1546 ha and dry river and tanks estimated to<br />
be1343 ha.<br />
4.4.11 Sandy Area:<br />
These are the areas which have stabilized accumulations<br />
of sand in situ or transported in coastal or riverine areas.<br />
The sand area occurs in the form of sand dunes,<br />
beaches, channel islands etc. The sand area appears in<br />
satellite image as white colour and area estimated as<br />
775 Ha.<br />
4.4.12 Salt Pans:<br />
It is estimated131 Ha, observed in near brackish water<br />
areas. Saltpans appear as white and light bluish colour<br />
with regular pattern.<br />
4.4.13 Waterlogged Areas:<br />
Waterlogged land is that land where the water is at/ or<br />
near the surface and water stands for most of the year,<br />
such lands usually occupy topographically low lying<br />
areas. The area is estimated as 25 Ha.<br />
5. Conclusions:<br />
Comprehensive information on land use / land cover is<br />
the basic prerequisite for land resources evaluation,<br />
assessment, utilization and management. The land<br />
use/land cover Categories are Observed in the area.<br />
Land use / Land cover classes encountered in the study<br />
area During the Observation of Satellite data the major<br />
land use changes are as follow:<br />
• Changes from paddy to shrimp farming,<br />
• Changes from scrub to shrimp farming,<br />
• Changes from paddy to abandoned paddy<br />
References:<br />
[1] Gautam, N.C. and Narayanan, L.R.A. (1983).<br />
Landsat MSS data for land use / land cover<br />
inventory and mapping: A case study of Andhra<br />
Pradesh. J. Indian Society of Remote Sensing, 11<br />
(3) : 15 – 28.<br />
[2] Jaiswal, R.K., Saxena, R. and Mukherjee, S.<br />
(1999). Application of remote sensing technology<br />
for land use / land cover change analysis. J. Indian<br />
Soc. Remote Sensing, 27(2) : 123 – 128.<br />
[3] Minakshi, Chaurasia, R. and Sharma, P.K. (1999).<br />
Land use / land cover mapping and change<br />
detection using satellite data – a case study of<br />
Dehlon Block, District Ludhiana, Punjab. J. Indian<br />
Soc. Remote Sensing, 27(2) : 115 – 121.<br />
[4] Obi Reddy, G.P., Suresh Babu, R. and Sambasiva<br />
Rao, M. (1994). Hydrogeology and<br />
hydrogeomorphological conditions of Anantapur<br />
district, using remote sensing data. Indian. Geog.<br />
Jour., 69(2) : 128 – 135.<br />
[5] Perumal, A. (1990). Hydromorphological<br />
investigation in parts of Athur Valley, Tamil Nadu,<br />
India, using remote sensing data. Ph. D Thesis<br />
(unpublished) University of Roorkee.<br />
[6] Prithviraj, N. (1980). Geomorphic studies in<br />
Sarada river basin, Visakapattanam District,<br />
Andhra Pradesh, India. Ph.D Thesis<br />
(unpublished), Andhra University, Visakhapatnam,<br />
India.<br />
[7] Vaidyanathan, R. (1964). Geomorphology of<br />
Cuddapah basin. Jour. Indian Geosciences Assoc.,<br />
4 : 29 – 36.<br />
[8] Remote Sensing for Sustainable Development-<br />
Indian Perspective., U.R. Rao , Natural Resources<br />
Management- a new perspective , first edition,<br />
1992.<br />
International Journal of Earth Sciences and Engineering<br />
ISSN 0974-5904, Vol. 05, No. 05 (02), October 2012, pp. 1464-1471
An Effective Decision Support Study for Evaluation of<br />
Topographical Features using Remote Sensing & GIS<br />
1470<br />
[9] Anderson, J.R., Hardy, E.T., Roach, J.t. and<br />
Witmer, R.E. (1976). A Landuse and Landcover<br />
Classification system for use with Remote Sensor<br />
Data, USGS Prof. Paper No. 466: 1 – 26.<br />
[10] Bhan, S.K. Bhattacharya, A., Guha, P.K. &<br />
Ravindran, K.V. (1991) IRS-1A applications in<br />
Geology and Mineral Resources, Curr.Sci., Special<br />
Issue, 61, (3 & 4) 247.<br />
[11] R.S. Rao, G. Meher Baba, G.V.A. Ramakrishna and<br />
A.Nageswara Rao, ( 1997) , Natural Resources<br />
development and management using remote<br />
sensing techniques: A case study of R allavagu<br />
watershed , A.P., India, National Symposium on<br />
Remote Sensing for Natural Resources with special<br />
emphasis on infrastructure development , 1997<br />
International Journal of Earth Sciences and Engineering<br />
ISSN 0974-5904, Vol. 05, No. 05 (02), October 2012, pp. 1464-1471
1471 P. V. S. VARA PRASAD and S S. ASADI<br />
International Journal of Earth Sciences and Engineering<br />
ISSN 0974-5904, Vol. 05, No. 05 (02), October 2012, pp. 1464-1471