Urban Hydrology - A case study on Water Supply and ... - Cafet Innova
Urban Hydrology - A case study on Water Supply and ... - Cafet Innova
Urban Hydrology - A case study on Water Supply and ... - Cafet Innova

You also want an ePaper? Increase the reach of your titles
YUMPU automatically turns print PDFs into web optimized ePapers that Google loves.
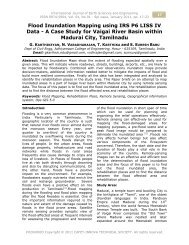
Internati<strong>on</strong>al Journal of Earth Sciences <strong>and</strong> EngineeringISSN 0974-5904, Vol. 04, No 01 - Spl issue, January 2011, pp. 09-169<str<strong>on</strong>g>Urban</str<strong>on</strong>g> <str<strong>on</strong>g>Hydrology</str<strong>on</strong>g> - A <str<strong>on</strong>g>case</str<strong>on</strong>g> <str<strong>on</strong>g>study</str<strong>on</strong>g> <strong>on</strong> <strong>Water</strong> <strong>Supply</strong><strong>and</strong> Sewage Network for Madurai Regi<strong>on</strong>, UsingRemote Sensing & GIS TechniquesJ. ANIMESH, K. SELVAVINAYAGAM, L. YESHODHA <strong>and</strong> S. SURESH BABUDept of Civil Engg, Adhiyamaan College of Engineering, Hosur - 635109, Tamilnadu, IndiaEmail: j.animesh@hotmail.com, selvagis34@gmail.com, sunisurp@gmail.comAbstract: An increasing dem<strong>and</strong> for water <strong>and</strong> sewage due to populati<strong>on</strong> growth, industrialdevelopment <strong>and</strong> improvement of ec<strong>on</strong>omic require management of water & sewagetransfer <strong>and</strong> improve operati<strong>on</strong> of distributed network systems. The informati<strong>on</strong> of l<strong>and</strong> use,tin <strong>and</strong> existing water supply was generated using the Resourcesat (IRS P6 LISS IV data)<strong>and</strong> Survey of India (SoI) toposheets of scale 1:25,000 <strong>and</strong> integrated them with GIS toidentify the distributi<strong>on</strong> supply networks of the <str<strong>on</strong>g>study</str<strong>on</strong>g> area. This paper explains the dem<strong>and</strong>of sewage network <strong>and</strong> scarcity of water supply system in <strong>and</strong> around Madurai Regi<strong>on</strong> usingRemote Sensing <strong>and</strong> GIS techniques. In additi<strong>on</strong>, GIS based analysis of the pattern of urbanexpansi<strong>on</strong> over the demographic change <strong>and</strong> l<strong>and</strong> use modificati<strong>on</strong>s has also indicated thaturban growth has mainly taken place linearly al<strong>on</strong>g the major roads in the <str<strong>on</strong>g>study</str<strong>on</strong>g> area.Keywords: L<strong>and</strong> use Mapping, <strong>Water</strong> supply network, Sewage network, OPSGIS, Madurai.Introducti<strong>on</strong>:The populati<strong>on</strong>, of Madurai city is growingvery fast due to <str<strong>on</strong>g>Urban</str<strong>on</strong>g>izati<strong>on</strong> <strong>and</strong> settlementof rural populati<strong>on</strong> from adjacent areas. Thedrinking water needs is also increasing intrend. Usually most nati<strong>on</strong>al reportsdescribe the total populati<strong>on</strong> of a wholetown as covered if there is some kind ofwater supply system that functi<strong>on</strong>s the city.Typically, the large urban areas representc<strong>on</strong>centrated dem<strong>and</strong>s, both due to largepopulati<strong>on</strong>s <strong>and</strong> large per capita use <strong>and</strong>waste. The sanitati<strong>on</strong> cover of the urbanpopulati<strong>on</strong> in the Madurai town is extremelyunsatisfactory. Only about 62-63% of thetotal urban populati<strong>on</strong> is reported to haveaccess to basic sanitati<strong>on</strong>. In the low incomeslum <strong>and</strong> squatter settlements, thepercentage is even less, with <strong>on</strong>ly 25% ofthe households having toilets <strong>and</strong> another21% having access to community toilets.What is important to that 51% of the poorhouseholds use ‘open spaces’ for pers<strong>on</strong>alsanitati<strong>on</strong>. The inadequacy of water supplyby urban authorities has led to boom inbottled water around the town in the nameof ‘mineral water’. More importantly, thedem<strong>and</strong> makes the people to buy the moreexpensive bottled water <strong>and</strong> this is not asoluti<strong>on</strong> of drinking water needs of thesociety [3] . The urban water supplies need todecentralise planning, regulati<strong>on</strong> <strong>and</strong>m<strong>on</strong>itoring functi<strong>on</strong>s for evolving efficientwater supply dem<strong>and</strong>s. This will enable tofacilitate participati<strong>on</strong> <strong>and</strong> help intersectoredco-ordinati<strong>on</strong>, develop <strong>and</strong> operatewater supply that is more resp<strong>on</strong>sive to theneeds of the people. The aim to meet futurerequirements of water supply <strong>and</strong> sewagenetwork systems can be efficiently achievedby performing L<strong>and</strong> use Mapping <strong>and</strong> usingdistributi<strong>on</strong> system. The Remote Sensing<strong>and</strong> GIS is the latest techniques to identifythe pattern of growth <strong>and</strong> its dem<strong>and</strong>.Study Area:Madurai District lies between 9°30’ <strong>and</strong>10°10’ of the North Latitude <strong>and</strong> between77°10’ <strong>and</strong> 78°30’ of the Eastern L<strong>on</strong>gitude[2] . The general geographical informati<strong>on</strong> ofthe district is simple <strong>and</strong> flat as well as hillarea. Vaigai River is flowing in the district<strong>and</strong> is dry during the summer seas<strong>on</strong>.Madurai is bound <strong>on</strong> its North by Dindigul<strong>and</strong> Tiruchirapalli districts, <strong>on</strong> the East bySivagangai District, <strong>on</strong> the South byVirudhunagar District <strong>and</strong> West by TheniDistrict.#02040002 Copyright © 2011 CAFET-INNOVA TECHNICAL SOCIETY. All rights reserved.
10J. ANIMESH, K. SELVAVINAYAGAM, L. YESHODHA<strong>and</strong> S. SURESH BABUThe water supply <strong>and</strong> sanitati<strong>on</strong> requirementof Madurai was managed by a City Councilfrom 1866 to 1970. In 1970, Madurai wasupgraded to the status of a MunicipalCorporati<strong>on</strong>. Further in 1974, 13 Panchayats<strong>on</strong> the outskirts of Madurai City wereincluded in Madurai Corporati<strong>on</strong> <strong>and</strong> wardswere increased to 65. In 1990, a delineati<strong>on</strong>committee was formed to identify newwards <strong>and</strong> the total number of wardsincreased from 65 to 72. MaduraiCorporati<strong>on</strong> meets its water dem<strong>and</strong>through surface <strong>and</strong> subsurface sourcesthrough water supply schemes <strong>on</strong> the VaigaiFigure 1: Locati<strong>on</strong> Map of the Study areaRiver. It c<strong>on</strong>sists of totally 79 villagesexcluding Madurai Corporati<strong>on</strong>. The villagesare classified into two rings. First ringcomprises of 28 villages (105.025 Sq.kms)<strong>and</strong> sec<strong>on</strong>d ring with 51 villages (168.718Sq.kms) respectively. The total areaincluding Madurai city covers around327.419 Sq.kms [2] .Internati<strong>on</strong>al Journal of Earth Sciences <strong>and</strong> EngineeringISSN 0974-5904, Vol. 04, No 01 - Spl issue, January 2011, pp. 09-16
<str<strong>on</strong>g>Urban</str<strong>on</strong>g> <str<strong>on</strong>g>Hydrology</str<strong>on</strong>g> - A <str<strong>on</strong>g>case</str<strong>on</strong>g> <str<strong>on</strong>g>study</str<strong>on</strong>g> <strong>on</strong> <strong>Water</strong> <strong>Supply</strong> <strong>and</strong> SewageNetwork for Madurai Regi<strong>on</strong>, Using Remote Sensing & GIS Techniques11Table 1: Madurai Divisi<strong>on</strong>al Z<strong>on</strong>e DetailsNorth Bank of Vaigai River South Bank of Vaigai RiverDetailsTotalNorth Z<strong>on</strong>e East Z<strong>on</strong>e South Z<strong>on</strong>e West Z<strong>on</strong>eWards 21 16 19 16 72ComprisingWards1 to 21 44 to 5931 to 43& 60 to 6522 to 30& 66 to 721 to 72Populati<strong>on</strong> 2,85,000 2,65,000 3,20,000 3,10,000 11,80,000Area (Sq.Km) 19.50 6.12 7.40 18.78 51.85Data Used:Indian Satellite imagery IRS-P6 LISS IV,Survey of India Toposheets 58 K/1/NW <strong>and</strong>58 K/1/NE <strong>on</strong> 1:25,000 Scale, Warp Map <strong>on</strong>Scale 1:5000, Sewage Network data, <strong>Water</strong><strong>Supply</strong> Distributi<strong>on</strong> data <strong>and</strong> Populati<strong>on</strong> datafrom Madurai Corporati<strong>on</strong>.Software Used:1. OPS-GIS 5.02. PG-Steamer 4.13. AutoCAD 20084. MS-Office PackagesMethodology:The Methodology has developed accordingto the needs <strong>and</strong> requirements for thestudies based <strong>on</strong> overlaying the features <strong>on</strong>L<strong>and</strong> use <strong>and</strong> L<strong>and</strong> cover map <strong>and</strong> todetermine the <strong>Water</strong> Distributi<strong>on</strong> <strong>and</strong>Sewage Network.Figure 2: Schematic Diagram of MethodologyInternati<strong>on</strong>al Journal of Earth Sciences <strong>and</strong> EngineeringISSN 0974-5904, Vol. 04, No 01 - Spl issue, January 2011, pp. 09-16
12J. ANIMESH, K. SELVAVINAYAGAM, L. YESHODHA<strong>and</strong> S. SURESH BABUBase Map Creati<strong>on</strong>:To delineate the boundary first step is todigitize the ward map with reference totoposheets. The base map is created bydelineating the boundary by means ofcreating a shape file <strong>on</strong> the ward map <strong>and</strong>overlayed <strong>on</strong> the IRS P6 LISS IV MX &Toposheet, then the boundary is extracted.The extracted boundary map is imported toGIS software for digitizati<strong>on</strong> purpose.Several features such as settlements, roads,water bodies, vegetati<strong>on</strong> <strong>and</strong> industrialareas are digitized <strong>and</strong> a digitized map isgenerated. From this digitized map severalthematic maps are prepared according tothe necessity.The L<strong>and</strong> Use/L<strong>and</strong> Cover Map:Most c<strong>on</strong>venti<strong>on</strong>al definiti<strong>on</strong>s have l<strong>and</strong>cover relating to the type of feature <strong>on</strong> thesurface of the earth such as rooftop, asphaltsurface, grass <strong>and</strong> trees. L<strong>and</strong> useFigure 3: Madurai Corporati<strong>on</strong> Boundaryassociates the cover with a socio-ec<strong>on</strong>omicactivity such as factory or school, parking lotor highway, golf course or pasture <strong>and</strong>orchard or forest.Internati<strong>on</strong>al Journal of Earth Sciences <strong>and</strong> EngineeringISSN 0974-5904, Vol. 04, No 01 - Spl issue, January 2011, pp. 09-16
<str<strong>on</strong>g>Urban</str<strong>on</strong>g> <str<strong>on</strong>g>Hydrology</str<strong>on</strong>g> - A <str<strong>on</strong>g>case</str<strong>on</strong>g> <str<strong>on</strong>g>study</str<strong>on</strong>g> <strong>on</strong> <strong>Water</strong> <strong>Supply</strong> <strong>and</strong> SewageNetwork for Madurai Regi<strong>on</strong>, Using Remote Sensing & GIS Techniques13<str<strong>on</strong>g>Urban</str<strong>on</strong>g> <str<strong>on</strong>g>Hydrology</str<strong>on</strong>g> often uses the term, l<strong>and</strong>cover <strong>and</strong> l<strong>and</strong> use interchangeably becausethe inputs to the models require elementsfrom each definiti<strong>on</strong> [5] . L<strong>and</strong> use mapping isused to identify the existing <strong>and</strong> expectedfuture l<strong>and</strong> uses. The Timely informati<strong>on</strong>about the changing pattern of urban l<strong>and</strong>use plays significant role in urban l<strong>and</strong> useplanning <strong>and</strong> sustainable urban development[1] . The mapping <strong>and</strong> m<strong>on</strong>itoring of urbanl<strong>and</strong> use/l<strong>and</strong> cover require a l<strong>and</strong> useclassificati<strong>on</strong> system. The most significantc<strong>on</strong>tributi<strong>on</strong> in this respect has been madeby the Human settlement [4] . The L<strong>and</strong> useMap is generated by means of digitizing thefeatures like settlements, roads, waterFigure 4: L<strong>and</strong> Use/L<strong>and</strong> Cover Mapbodies, vegetati<strong>on</strong> <strong>and</strong> etc. For theidentificati<strong>on</strong> <strong>and</strong> interpretati<strong>on</strong> of l<strong>and</strong> usepattern of the area, image interpretati<strong>on</strong>sthrough remote sensing data (IRS P6 LISSIV) were adopted <strong>and</strong> the various l<strong>and</strong> useclasses has been delineated.Sewage Network Mapping:The underground drainage in the city coverssix-lakh populati<strong>on</strong>. Out of 72 wards ofMadurai Corporati<strong>on</strong>, 13 wards have nounderground drainage system <strong>and</strong> another16 wards are partially covered. The sewageinflow is 61mld, which is partially pumped tothe treatment plant [3] .Internati<strong>on</strong>al Journal of Earth Sciences <strong>and</strong> EngineeringISSN 0974-5904, Vol. 04, No 01 - Spl issue, January 2011, pp. 09-16
14J. ANIMESH, K. SELVAVINAYAGAM, L. YESHODHA<strong>and</strong> S. SURESH BABUFigure 5: Sewage Network MapThe key issues related to this sector are due to dense populati<strong>on</strong> coverage <strong>and</strong> treatmentcapacity c<strong>on</strong>straints. The sewage network mapping is d<strong>on</strong>e through the process of digitizingthe sewage network features, <strong>and</strong> then it is overlayed <strong>on</strong> l<strong>and</strong> use <strong>and</strong> l<strong>and</strong> cover map.Figure 6: Overlap Map of LULC & Sewage NetworkInternati<strong>on</strong>al Journal of Earth Sciences <strong>and</strong> EngineeringISSN 0974-5904, Vol. 04, No 01 - Spl issue, January 2011, pp. 09-16
<str<strong>on</strong>g>Urban</str<strong>on</strong>g> <str<strong>on</strong>g>Hydrology</str<strong>on</strong>g> - A <str<strong>on</strong>g>case</str<strong>on</strong>g> <str<strong>on</strong>g>study</str<strong>on</strong>g> <strong>on</strong> <strong>Water</strong> <strong>Supply</strong> <strong>and</strong> SewageNetwork for Madurai Regi<strong>on</strong>, Using Remote Sensing & GIS Techniques15<strong>Water</strong> Distributi<strong>on</strong> Mapping:In Madurai, the frequency of water supply is<strong>on</strong>ce in three days <strong>and</strong> the populati<strong>on</strong>covered is 36 percent. The per capitaavailability of water ranges between 60 lpcdto 75 lpcd [2] .The situati<strong>on</strong> becomes worse in summerseas<strong>on</strong> with reduced per capita supply.These deficiencies in the water supply sectorare mainly because of inadequate treatmentFigure 7: <strong>Water</strong> Distributi<strong>on</strong> Network Mapcapacity, inadequate network coverage,inadequate summer storage, need forsource augmentati<strong>on</strong> <strong>and</strong> need for assetmanagement acti<strong>on</strong> plan.Figure 8: Overlap Map of LULC & <strong>Water</strong> Distributi<strong>on</strong> NetworkInternati<strong>on</strong>al Journal of Earth Sciences <strong>and</strong> EngineeringISSN 0974-5904, Vol. 04, No 01 - Spl issue, January 2011, pp. 09-16
16J. ANIMESH, K. SELVAVINAYAGAM, L. YESHODHA<strong>and</strong> S. SURESH BABUIt is also noticed that simultaneously wateris distributed through two or moredistributi<strong>on</strong> mains to different areas withoutany system of valve regulati<strong>on</strong>. Due to thisoperati<strong>on</strong>, even c<strong>on</strong>sumers residing near tothe service reservoirs do not get water atsufficient pressure. The populati<strong>on</strong> residingin the south z<strong>on</strong>e of Madurai Corporati<strong>on</strong><strong>and</strong> those living in extended areas facesignificant hardship during summer m<strong>on</strong>thsdue to inadequate water supply. The <strong>Water</strong>Distributi<strong>on</strong> Mapping is d<strong>on</strong>e through theprocess of digitizing the sewage networkfeatures, <strong>and</strong> then it is overlayed <strong>on</strong> l<strong>and</strong>use <strong>and</strong> l<strong>and</strong> cover map.C<strong>on</strong>clusi<strong>on</strong>:GIS based analysis of the pattern of urbanexpansi<strong>on</strong> over the demographic change <strong>and</strong>l<strong>and</strong> use modificati<strong>on</strong> is identified bySatellite image. The existing SewageNetwork & <strong>Water</strong> Distributi<strong>on</strong> Network isdigitized by using toposheets. The abovemaps are overlayed with L<strong>and</strong> use & L<strong>and</strong>cover Map. Present populati<strong>on</strong> <strong>and</strong> expectedrate of growth are critical factors in designof <strong>Water</strong> Distributi<strong>on</strong> <strong>and</strong> Sewage Networkin Madurai City. A review of the existingc<strong>on</strong>diti<strong>on</strong> indicates that Madurai Corporati<strong>on</strong>may not have been fully involved in thedesign, according to the Growth rate bymeans of settlement <strong>and</strong> populati<strong>on</strong>. The<str<strong>on</strong>g>study</str<strong>on</strong>g> has focused <strong>on</strong> the utility of RemoteSensing <strong>and</strong> GIS in the identificati<strong>on</strong> ofexisting system. The result shows thepresent scenario situati<strong>on</strong> of sewage <strong>and</strong>water network of Madurai City.References:[1] Nati<strong>on</strong>al Institute of <str<strong>on</strong>g>Hydrology</str<strong>on</strong>g>, Roorkee(2000-2001), Applicati<strong>on</strong> of Remote Sensingin <str<strong>on</strong>g>Urban</str<strong>on</strong>g> Hydrological studies of Delhi areas.[2] City Development Plan, MaduraiCorporati<strong>on</strong>, Madurai.[3] Jawaharlal Nehru Nati<strong>on</strong>al <str<strong>on</strong>g>Urban</str<strong>on</strong>g>Renewal Missi<strong>on</strong> [JNNURM], Government ofIndia.[4] Cheng.J, <strong>and</strong> Masser, 2003, <str<strong>on</strong>g>Urban</str<strong>on</strong>g>growth pattern modelling: a <str<strong>on</strong>g>case</str<strong>on</strong>g> <str<strong>on</strong>g>study</str<strong>on</strong>g> ofWuhan city, PR China. “L<strong>and</strong>scape <strong>and</strong><str<strong>on</strong>g>Urban</str<strong>on</strong>g> Planning”, Vol. 62, pp 199217.[5] Jensen.J.R, <strong>and</strong> D.L.Toll, 1982, Detectingresidential l<strong>and</strong>use development at theurban fringe, “Photogrammetric Engineering<strong>and</strong> Remote Sensing”, Vol. 48(4), pp629643.[6] Ottensmann, J.R, (1977). <str<strong>on</strong>g>Urban</str<strong>on</strong>g> Sprawl,L<strong>and</strong> Values <strong>and</strong> the Density ofDevelopment, L<strong>and</strong> Ec<strong>on</strong>omics, Vol. 53 (4),pp. 389400.Internati<strong>on</strong>al Journal of Earth Sciences <strong>and</strong> EngineeringISSN 0974-5904, Vol. 04, No 01 - Spl issue, January 2011, pp. 09-16