Practice Workbook SE - East Penn School District
Practice Workbook SE - East Penn School District
Practice Workbook SE - East Penn School District

You also want an ePaper? Increase the reach of your titles
YUMPU automatically turns print PDFs into web optimized ePapers that Google loves.
Name<br />
LESSON 5.3<br />
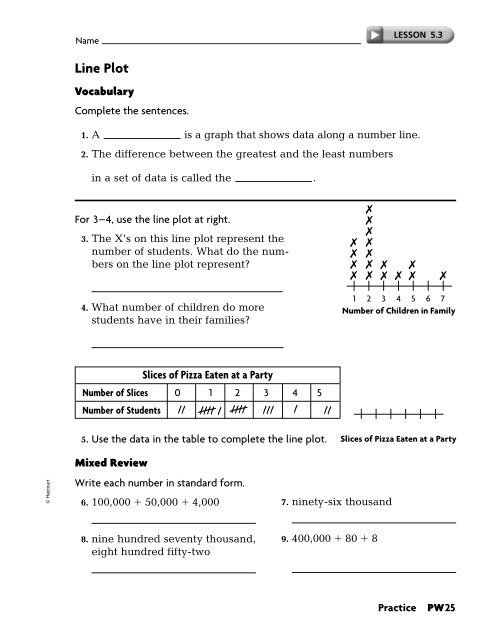
Line Plot<br />
Vocabulary<br />
Complete the sentences.<br />
1. A is a graph that shows data along a number line.<br />
2. The difference between the greatest and the least numbers<br />
in a set of data is called the .<br />
For 3–4, use the line plot at right.<br />
3. The X’s on this line plot represent the<br />
number of students. What do the numbers<br />
on the line plot represent?<br />
!<br />
!<br />
!<br />
!<br />
!<br />
!<br />
!<br />
!<br />
!<br />
! ! !<br />
! ! ! ! !<br />
4. What number of children do more<br />
students have in their families?<br />
Slices of Pizza Eaten at a Party<br />
Number of Slices 0 1 2 3 4 5<br />
Number of Students<br />
5. Use the data in the table to complete the line plot.<br />
1 2 3 4 5 6 7<br />
Number of Children in Family<br />
!<br />
!<br />
!<br />
! !<br />
! !<br />
! ! !<br />
! ! !<br />
! ! ! !<br />
!<br />
!<br />
0 1 2 3 4 5<br />
Slices of Pizza Eaten at a Party<br />
© Harcourt<br />
Mixed Review<br />
Write each number in standard form.<br />
6. 100,000 50,000 4,000<br />
7. ninety-six thousand<br />
8. nine hundred seventy thousand,<br />
eight hundred fifty-two<br />
9. 400,000 80 8<br />
<strong>Practice</strong><br />
PW25