Practice Workbook SE - East Penn School District
Practice Workbook SE - East Penn School District
Practice Workbook SE - East Penn School District

Create successful ePaper yourself
Turn your PDF publications into a flip-book with our unique Google optimized e-Paper software.
Name<br />
LESSON 5.6<br />
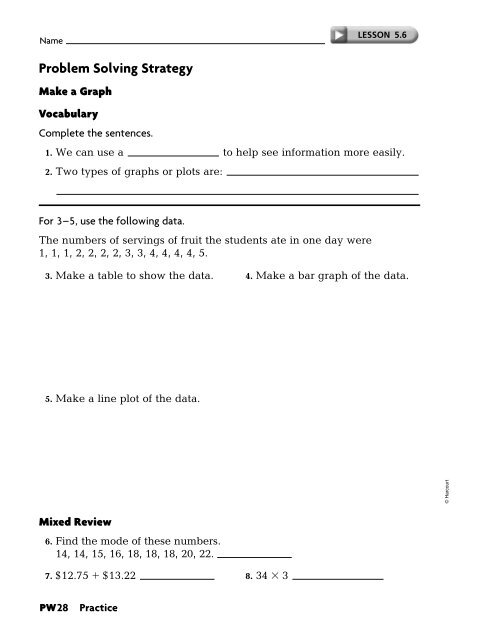
Problem Solving Strategy<br />
Make a Graph<br />
Vocabulary<br />
Complete the sentences.<br />
1. We can use a to help see information more easily.<br />
2. Two types of graphs or plots are:<br />
For 3–5, use the following data.<br />
The numbers of servings of fruit the students ate in one day were<br />
1, 1, 1, 2, 2, 2, 2, 3, 3, 4, 4, 4, 4, 5.<br />
3. Make a table to show the data.<br />
4. Make a bar graph of the data.<br />
5. Make a line plot of the data.<br />
Number of Students<br />
6<br />
5<br />
4<br />
3<br />
2<br />
1<br />
0<br />
FRUIT EATEN BY STUDENTS<br />
1 2 3 4 5<br />
Number of Servings<br />
!<br />
!<br />
!<br />
! ! !<br />
!<br />
!<br />
!<br />
!<br />
!<br />
!<br />
! !<br />
0 1 2 3 4 5 6<br />
Number of Servings of Fruit<br />
© Harcourt<br />
Mixed Review<br />
6. Find the mode of these numbers.<br />
14, 14, 15, 16, 18, 18, 18, 20, 22.<br />
7. $12.75 $13.22 8. 34 3<br />
PW28<br />
<strong>Practice</strong>