Practice Workbook SE - East Penn School District
Practice Workbook SE - East Penn School District
Practice Workbook SE - East Penn School District

You also want an ePaper? Increase the reach of your titles
YUMPU automatically turns print PDFs into web optimized ePapers that Google loves.
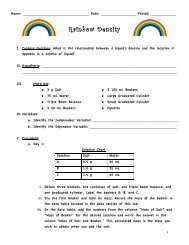
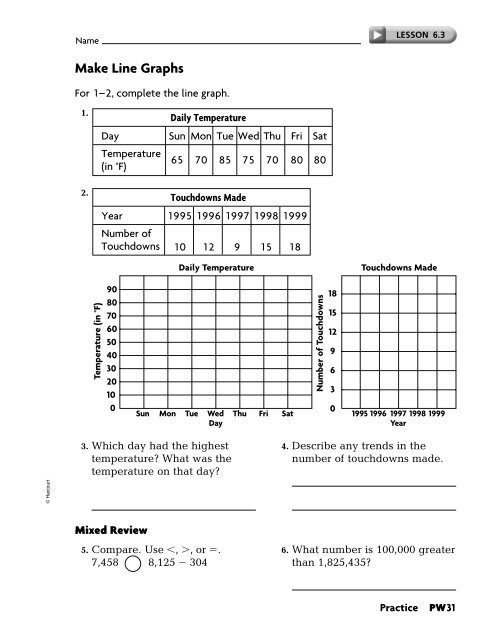
Name<br />
LESSON 6.3<br />
Make Line Graphs<br />
For 1–2, complete the line graph.<br />
1.<br />
Daily Temperature<br />
Day Sun Mon Tue Wed Thu Fri Sat<br />
Temperature<br />
(in °F)<br />
65 70 85 75 70 80 80<br />
2.<br />
Touchdowns Made<br />
Year 1995 1996 1997 1998 1999<br />
Number of<br />
Touchdowns 10 12 9 15 18<br />
Daily Temperature<br />
Touchdowns Made<br />
Temperature (in °F)<br />
90<br />
80<br />
70<br />
60<br />
50<br />
40<br />
30<br />
20<br />
10<br />
0<br />
Sun Mon Tue Wed Thu Fri Sat<br />
Day<br />
Number of Touchdowns<br />
18<br />
15<br />
12<br />
9<br />
6<br />
3<br />
0<br />
1995 1996 1997 1998 1999<br />
Year<br />
3. Which day had the highest<br />
temperature? What was the<br />
temperature on that day?<br />
4. Describe any trends in the<br />
number of touchdowns made.<br />
© Harcourt<br />
Mixed Review<br />
5. Compare. Use , , or .<br />
7,458 8,125 304<br />
6. What number is 100,000 greater<br />
than 1,825,435?<br />
<strong>Practice</strong><br />
PW31