Odour Threshold Investigation 2012 - Bay of Plenty Regional Council
Odour Threshold Investigation 2012 - Bay of Plenty Regional Council
Odour Threshold Investigation 2012 - Bay of Plenty Regional Council
You also want an ePaper? Increase the reach of your titles
YUMPU automatically turns print PDFs into web optimized ePapers that Google loves.
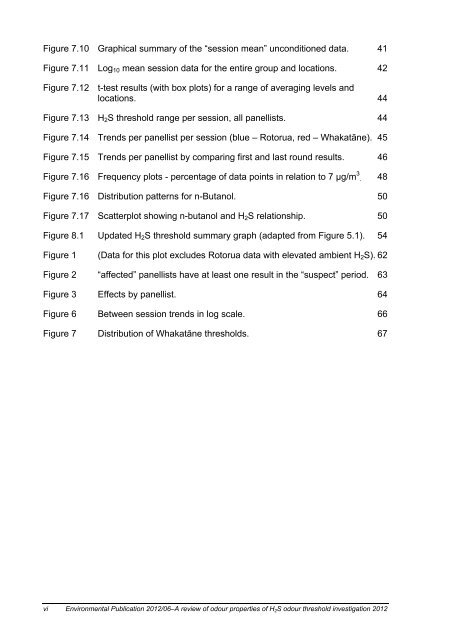
Figure 7.10 Graphical summary <strong>of</strong> the “session mean” unconditioned data. 41<br />
Figure 7.11 Log 10 mean session data for the entire group and locations. 42<br />
Figure 7.12<br />
t-test results (with box plots) for a range <strong>of</strong> averaging levels and<br />
locations. 44<br />
Figure 7.13 H 2 S threshold range per session, all panellists. 44<br />
Figure 7.14 Trends per panellist per session (blue – Rotorua, red – Whakatāne). 45<br />
Figure 7.15 Trends per panellist by comparing first and last round results. 46<br />
Figure 7.16 Frequency plots - percentage <strong>of</strong> data points in relation to 7 µg/m 3 . 48<br />
Figure 7.16 Distribution patterns for n-Butanol. 50<br />
Figure 7.17 Scatterplot showing n-butanol and H 2 S relationship. 50<br />
Figure 8.1 Updated H 2 S threshold summary graph (adapted from Figure 5.1). 54<br />
Figure 1 (Data for this plot excludes Rotorua data with elevated ambient H 2 S). 62<br />
Figure 2 “affected” panellists have at least one result in the “suspect” period. 63<br />
Figure 3 Effects by panellist. 64<br />
Figure 6 Between session trends in log scale. 66<br />
Figure 7 Distribution <strong>of</strong> Whakatāne thresholds. 67<br />
vi Environmental Publication <strong>2012</strong>/06–A review <strong>of</strong> odour properties <strong>of</strong> H 2 S odour threshold investigation <strong>2012</strong>


