Odour Threshold Investigation 2012 - Bay of Plenty Regional Council
Odour Threshold Investigation 2012 - Bay of Plenty Regional Council
Odour Threshold Investigation 2012 - Bay of Plenty Regional Council

Create successful ePaper yourself
Turn your PDF publications into a flip-book with our unique Google optimized e-Paper software.
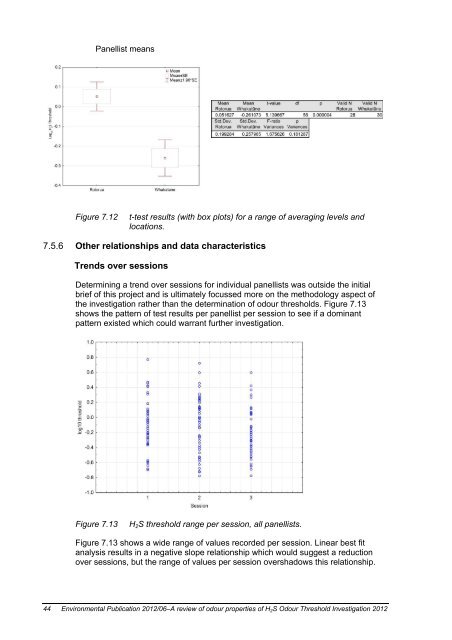
Panellist means<br />
Figure 7.12<br />
t-test results (with box plots) for a range <strong>of</strong> averaging levels and<br />
locations.<br />
7.5.6 Other relationships and data characteristics<br />
Trends over sessions<br />
Determining a trend over sessions for individual panellists was outside the initial<br />
brief <strong>of</strong> this project and is ultimately focussed more on the methodology aspect <strong>of</strong><br />
the investigation rather than the determination <strong>of</strong> odour thresholds. Figure 7.13<br />
shows the pattern <strong>of</strong> test results per panellist per session to see if a dominant<br />
pattern existed which could warrant further investigation.<br />
Figure 7.13<br />
H 2 S threshold range per session, all panellists.<br />
Figure 7.13 shows a wide range <strong>of</strong> values recorded per session. Linear best fit<br />
analysis results in a negative slope relationship which would suggest a reduction<br />
over sessions, but the range <strong>of</strong> values per session overshadows this relationship.<br />
44 Environmental Publication <strong>2012</strong>/06–A review <strong>of</strong> odour properties <strong>of</strong> H 2 S <strong>Odour</strong> <strong>Threshold</strong> <strong>Investigation</strong> <strong>2012</strong>