Odour Threshold Investigation 2012 - Bay of Plenty Regional Council
Odour Threshold Investigation 2012 - Bay of Plenty Regional Council
Odour Threshold Investigation 2012 - Bay of Plenty Regional Council

Create successful ePaper yourself
Turn your PDF publications into a flip-book with our unique Google optimized e-Paper software.
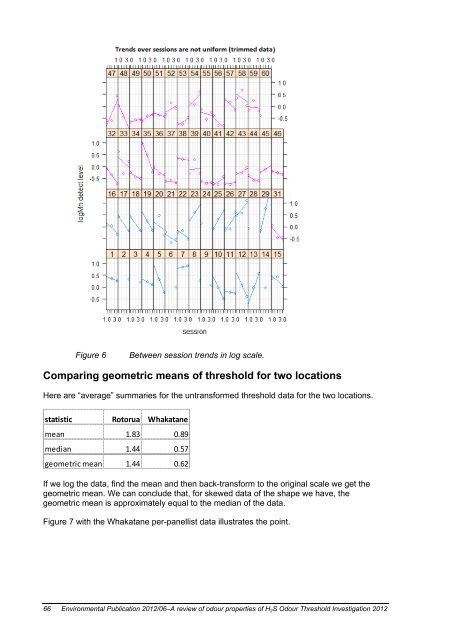
Figure 6<br />
Between session trends in log scale.<br />
Comparing geometric means <strong>of</strong> threshold for two locations<br />
Here are “average” summaries for the untransformed threshold data for the two locations.<br />
statistic Rotorua Whakatane<br />
mean 1.83 0.89<br />
median 1.44 0.57<br />
geometric mean 1.44 0.62<br />
If we log the data, find the mean and then back-transform to the original scale we get the<br />
geometric mean. We can conclude that, for skewed data <strong>of</strong> the shape we have, the<br />
geometric mean is approximately equal to the median <strong>of</strong> the data.<br />
Figure 7 with the Whakatane per-panellist data illustrates the point.<br />
66 Environmental Publication <strong>2012</strong>/06–A review <strong>of</strong> odour properties <strong>of</strong> H 2 S <strong>Odour</strong> <strong>Threshold</strong> <strong>Investigation</strong> <strong>2012</strong>