Odour Threshold Investigation 2012 - Bay of Plenty Regional Council
Odour Threshold Investigation 2012 - Bay of Plenty Regional Council
Odour Threshold Investigation 2012 - Bay of Plenty Regional Council

Create successful ePaper yourself
Turn your PDF publications into a flip-book with our unique Google optimized e-Paper software.
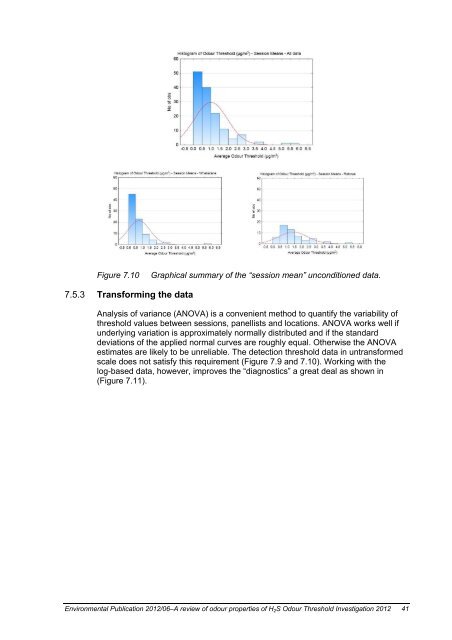
Figure 7.10<br />
Graphical summary <strong>of</strong> the “session mean” unconditioned data.<br />
7.5.3 Transforming the data<br />
Analysis <strong>of</strong> variance (ANOVA) is a convenient method to quantify the variability <strong>of</strong><br />
threshold values between sessions, panellists and locations. ANOVA works well if<br />
underlying variation is approximately normally distributed and if the standard<br />
deviations <strong>of</strong> the applied normal curves are roughly equal. Otherwise the ANOVA<br />
estimates are likely to be unreliable. The detection threshold data in untransformed<br />
scale does not satisfy this requirement (Figure 7.9 and 7.10). Working with the<br />
log-based data, however, improves the “diagnostics” a great deal as shown in<br />
(Figure 7.11).<br />
Environmental Publication <strong>2012</strong>/06–A review <strong>of</strong> odour properties <strong>of</strong> H 2 S <strong>Odour</strong> <strong>Threshold</strong> <strong>Investigation</strong> <strong>2012</strong> 41