chapter 4 â facility requirements - San Diego International Airport
chapter 4 â facility requirements - San Diego International Airport
chapter 4 â facility requirements - San Diego International Airport
Create successful ePaper yourself
Turn your PDF publications into a flip-book with our unique Google optimized e-Paper software.
Planning activity levels<br />
(PALs) link <strong>facility</strong><br />
<strong>requirements</strong> to activity<br />
“triggers” to account for<br />
future deviations<br />
between actual and<br />
forecast activity.<br />
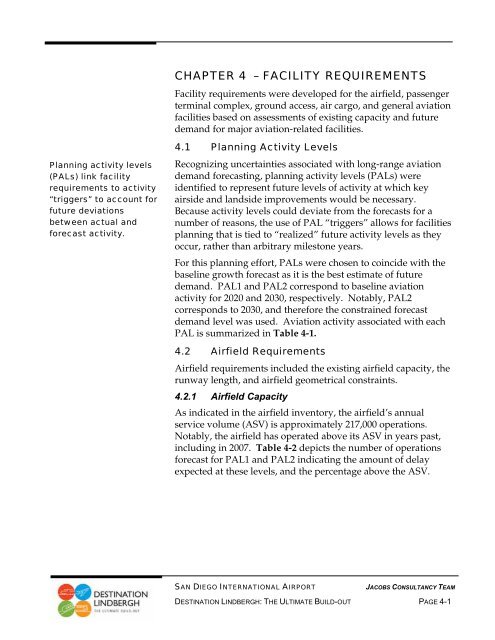
CHAPTER 4 – FACILITY REQUIREMENTS<br />
Facility <strong>requirements</strong> were developed for the airfield, passenger<br />
terminal complex, ground access, air cargo, and general aviation<br />
facilities based on assessments of existing capacity and future<br />
demand for major aviation-related facilities.<br />
4.1 Planning Activity Levels<br />
Recognizing uncertainties associated with long-range aviation<br />
demand forecasting, planning activity levels (PALs) were<br />
identified to represent future levels of activity at which key<br />
airside and landside improvements would be necessary.<br />
Because activity levels could deviate from the forecasts for a<br />
number of reasons, the use of PAL “triggers” allows for facilities<br />
planning that is tied to “realized” future activity levels as they<br />
occur, rather than arbitrary milestone years.<br />
For this planning effort, PALs were chosen to coincide with the<br />
baseline growth forecast as it is the best estimate of future<br />
demand. PAL1 and PAL2 correspond to baseline aviation<br />
activity for 2020 and 2030, respectively. Notably, PAL2<br />
corresponds to 2030, and therefore the constrained forecast<br />
demand level was used. Aviation activity associated with each<br />
PAL is summarized in Table 4-1.<br />
4.2 Airfield Requirements<br />
Airfield <strong>requirements</strong> included the existing airfield capacity, the<br />
runway length, and airfield geometrical constraints.<br />
4.2.1 Airfield Capacity<br />
As indicated in the airfield inventory, the airfield’s annual<br />
service volume (ASV) is approximately 217,000 operations.<br />
Notably, the airfield has operated above its ASV in years past,<br />
including in 2007. Table 4-2 depicts the number of operations<br />
forecast for PAL1 and PAL2 indicating the amount of delay<br />
expected at these levels, and the percentage above the ASV.<br />
SAN DIEGO INTERNATIONAL AIRPORT<br />
JACOBS CONSULTANCY TEAM<br />
DESTINATION LINDBERGH: THE ULTIMATE BUILD-OUT PAGE 4-1
Table 4-1<br />
PLANNING ACTIVITY LEVELS<br />
<strong>San</strong> <strong>Diego</strong> <strong>International</strong> <strong>Airport</strong><br />
2007<br />
PAL1<br />
Unconstrained<br />
PAL2<br />
Constrained<br />
ENPLANEMENTS<br />
Domestic 9,040,280 10,854,600 13,839,100<br />
<strong>International</strong> 132,686 297,600 369,400<br />
Total 9,172,966 11,351,200 14,106,800<br />
CARGO TONNAGE<br />
Freighter 141,653 183,300 222,000<br />
Belly 13,036 4,900 3,600<br />
Total 154,689 188,200 225,600<br />
AIRCRAFT OPERATIONS<br />
Commercial passenger<br />
Domestic<br />
Air carrier 155,194 197,700 231,000<br />
Commuter 40,433 16,300 16,500<br />
<strong>International</strong> 3,317 5,700 6,900<br />
Subtotal 198,943 219,700 254,400<br />
Cargo 6,682 7,100 7,800<br />
Civil 23,645 23,600 23,700<br />
Military 216 200 200<br />
Total 229,486 250,600 286,100<br />
Source: Landrum and Brown, September 2008.<br />
SAN DIEGO INTERNATIONAL AIRPORT<br />
JACOBS CONSULTANCY TEAM<br />
DESTINATION LINDBERGH: THE ULTIMATE BUILD-OUT PAGE 4-2
Table 4-2<br />
AIRFIELD CAPACITY AND DELAY<br />
<strong>San</strong> <strong>Diego</strong> <strong>International</strong> <strong>Airport</strong><br />
Annual<br />
Operations<br />
Ratio of Demand<br />
to ASV<br />
Delay (a)<br />
(min/operation)<br />
ASV 2007 PAL1 PAL2<br />
217,000 229,000 254,600 309,800<br />
- 1.05 1.17 1.43<br />
- 3 10 25<br />
(a) Delay estimates based on demand delay curves shown on Figure 2-6.<br />
Source: Jacobs Consultancy, September 2008.<br />
Airlines are expected to<br />
begin increasing<br />
average aircraft size per<br />
operation once delays<br />
begin averaging 10<br />
minutes per operation.<br />
At delays of 10 minutes per operation, growth in aircraft<br />
operations would begin to slow. At this level of delay, it is<br />
expected that airlines would begin to adjust to increasing delays<br />
by up-gauging aircraft, increasing load factors, and spreading<br />
any operational peaks in the day to the extent practical. These<br />
levels of demand and delay indicate that new runway capacity<br />
would be needed in the 2020 timeframe. With insufficient space<br />
available to construct a second runway, airfield operations will<br />
likely be constrained due to inadequate runway capacity. As<br />
discussed previously, the airfield is expected to capable of<br />
handling approximately 286,000 annual aircraft operations.<br />
4.2.2 Runway Length Requirements<br />
The assessment of required runway length focused on takeoff<br />
length <strong>requirements</strong>, which are longer than landing length<br />
<strong>requirements</strong> for the same aircraft. Figure 4-1 depicts takeoff<br />
length <strong>requirements</strong> for many of the aircraft in the existing and<br />
projected aircraft fleet mix. As shown, the takeoff run available<br />
(TORA) is adequate for all aircraft depicted at 80 percent of their<br />
maximum takeoff weight (MTOW). It also shows that all aircraft<br />
depicted are accommodated at 90 percent of their MTOW with<br />
the single exception of the Boeing 747-400. Finally, most aircraft<br />
operating in the fleet today are accommodated at 100 percent of<br />
their MTOW. Figure 4-1 shows that the existing runway length<br />
of 9,401 feet is adequate for most commercial service aircraft<br />
both currently operating and expected to operate at the <strong>Airport</strong><br />
in the future.<br />
SAN DIEGO INTERNATIONAL AIRPORT<br />
JACOBS CONSULTANCY TEAM<br />
DESTINATION LINDBERGH: THE ULTIMATE BUILD-OUT PAGE 4-3
Figure 4-1. Runway Length Requirements.<br />
737-700 (20.4%)<br />
737-300 (17.2%)<br />
A320 (7.1%)<br />
757-200 (6.4%)<br />
737-800 (4.9%)<br />
Aircraft Type<br />
NARROWBODY<br />
A319 (4.8%)<br />
MD-83 (3.9%)<br />
MD-82 (2.3%)<br />
737-400 (2.1%)<br />
737-500 (1.7%)<br />
A321 (1.1%)<br />
737-900 (0.4%)<br />
757-300 (0.0%)<br />
TORA = 9,401 feet<br />
WIDEBODY<br />
767-300ER (1.4%)<br />
A300F4-600 (0.9%)<br />
767-200 (0.7%)<br />
A310-200F (0.5%)<br />
DC-10-30F (0.1%)<br />
A340-300 (0.0%)<br />
777-200ER (0.0%)<br />
A330-200 (0.0%)<br />
A330-300 (0.0%)<br />
747-400 (0.0%)<br />
To 80% Fuel & Payload<br />
To 90% Fuel & Payload<br />
To 100% Fuel & Payload<br />
4,000 5,000 6,000 7,000 8,000 9,000 10,000 11,000<br />
Takeoff Run Available (TORA) (feet)<br />
Source: Jacobs Consultancy Analysis, September 2008.<br />
Useful load is defined as the aircraft maximum takeoff weight<br />
minus the aircraft empty weight. An aircraft’s useful load can be<br />
used to transport either fuel or payload (i.e., passengers,<br />
baggage, and cargo) and, within certain limits, useful load can be<br />
allocated between fuel and passengers.<br />
It is important to note that aircraft typically do not operate at 100<br />
percent of their MTOW. Airlines fuel aircraft for the distance to<br />
be traveled, and therefore typically do not carry fuel beyond that<br />
which is needed after accounting for an additional factor of<br />
safety. In addition, aircraft may not be carrying a full load of<br />
passengers or cargo in many instances. Therefore, the runway<br />
length provided by the current runway is considered adequate.<br />
SAN DIEGO INTERNATIONAL AIRPORT<br />
JACOBS CONSULTANCY TEAM<br />
DESTINATION LINDBERGH: THE ULTIMATE BUILD-OUT PAGE 4-4
Future airfield facilities<br />
should be designed to<br />
support ADG V (i.e.,<br />
Boeing 747 and 777)<br />
aircraft operations.<br />
Terminal <strong>requirements</strong><br />
are based on<br />
comparisons to planning<br />
factors developed from<br />
current terminal<br />
conditions and levels of<br />
service.<br />
4.2.3 Airfield Geometrical Constraints<br />
In Chapter 2, the lack of a full-length parallel Taxiway C and its<br />
constraints on airfield operations were noted. Therefore, it is<br />
recommended that any new airfield alternative provide for a<br />
full-length parallel Taxiway C, if possible. A full-length parallel<br />
Taxiway C would, among other things, open the land envelope<br />
north of the runway to future development for terminal<br />
concourses.<br />
In addition, Runway 27 RSA improvements should also be<br />
considered as a part of alternative development. Considerations<br />
could include the installation of EMAS, similar to that in place<br />
for Runway 09.<br />
Finally, major airfield infrastructure should be designed around<br />
ADG V aircraft. Accordingly, alternatives should be considered<br />
that would accommodate ADG V aircraft on key airfield<br />
pavements, such as Taxiway B.<br />
4.3 Passenger Terminal Requirements<br />
This section provides the methodology and calculated <strong>facility</strong><br />
<strong>requirements</strong> for the passenger terminals for both PAL1 and<br />
PAL2.<br />
4.3.1 Program Methodology<br />
Every airport has unique operating characteristics requiring<br />
consideration when projecting future terminal <strong>requirements</strong>. An<br />
equal-sized functional area may be undersized or oversized at<br />
one airport while it may operate efficiently at another. For<br />
Destination Lindbergh, terminal <strong>facility</strong> <strong>requirements</strong> were<br />
determined by analyzing existing terminal plans, conducting onsite<br />
observations, and reviewing data from comparable airports,<br />
industry standards, and planning guidelines. To establish<br />
reasonable baselines for comparisons, existing terminal facilities<br />
and levels of service were analyzed to determine planning ratios.<br />
Baseline planning ratios calculated from existing demand levels<br />
and the existing facilities size were then compared to industry<br />
standards and other comparable airport planning ratios to<br />
determine if deficiencies or excesses exist. These deficiencies or<br />
excesses were then reconciled with on-site observations to<br />
determine if they are providing acceptable levels of service (LOS)<br />
for the passengers and tenants of the <strong>facility</strong>. Depending on the<br />
SAN DIEGO INTERNATIONAL AIRPORT<br />
JACOBS CONSULTANCY TEAM<br />
DESTINATION LINDBERGH: THE ULTIMATE BUILD-OUT PAGE 4-5
Planning factors equate<br />
physical and/or spatial<br />
<strong>requirements</strong> to<br />
standard measures of<br />
aviation activity, such<br />
as passengers or<br />
aircraft operations.<br />
Planning factors were<br />
developed for the<br />
following terminal<br />
functional areas:<br />
• Airline functions<br />
• Concessions areas<br />
• Federal Inspection<br />
Service (FIS)<br />
• Public areas—<br />
secure and nonsecure<br />
• Non-public areas<br />
resulst of this analysis, the existing ratios may be used to project<br />
<strong>facility</strong> <strong>requirements</strong>, or they may be adjusted if the LOS<br />
standards are not met.<br />
Existing Terminal Areas and Planning Factors. As discussed as<br />
part of baseline conditions in Chapter 2, there are several<br />
locations in the passenger terminals (although primarily T1 and<br />
T2 East) that do not perform at acceptable levels of service today,<br />
especially during peak periods. Generally, these locations are<br />
providing service to more passengers than they were designed to<br />
accommodate and resulting in congested conditions.<br />
The most recent addition, T2 West, provides the highest LOS and<br />
planning ratios that meet current industry standards. For this<br />
study, the existing terminal ratios were determined by<br />
combining the facilities for all of the terminals to establish<br />
aggregate terminal ratios. Future planning ratios were<br />
determined by comparing the existing terminal ratios to industry<br />
planning ratios, which provide an acceptable LOS, generally<br />
described as LOS B by the <strong>International</strong> Air Transport<br />
Association (IATA). LOS B is described as providing a condition<br />
of stable flow with few delays and a high level of comfort. The<br />
existing terminal ratios were adjusted as required to ensure<br />
acceptable level of service standards for both the PAL1 and<br />
PAL2 <strong>requirements</strong>.<br />
In Table 4-3, the functional components of the terminals are<br />
divided into the following categories: airline functions,<br />
concessions, federal inspection services (FIS), secure public area,<br />
non-secure public area, and non-public area. For each functional<br />
area, an existing ratio is shown based on the existing facilities<br />
and existing demand levels. If required, the planning factors<br />
were modified as appropriate to yield facilities that would<br />
function at an acceptable LOS. The planning factors to be used<br />
to generate <strong>facility</strong> <strong>requirements</strong> are shown.<br />
Airline functions. Airline functions include those areas directly<br />
related to airline operations and passenger processing, such as<br />
ticketing, departure holdrooms, baggage services, airline<br />
operations, and airline clubrooms.<br />
The current ticketing lobbies for the terminals provide a total of<br />
765 linear feet of ticket counter frontage. The ticketing lobby<br />
depth in T1 and T2 East (the distance from the back wall to the<br />
SAN DIEGO INTERNATIONAL AIRPORT<br />
JACOBS CONSULTANCY TEAM<br />
DESTINATION LINDBERGH: THE ULTIMATE BUILD-OUT PAGE 4-6
Requirements for<br />
ticketing lobbies are<br />
expressed in terms of<br />
square feet per<br />
originating passenger<br />
during the peak hour.<br />
Requirements for<br />
baggage claim areas are<br />
expressed in terms of<br />
square feet per<br />
terminating passenger<br />
during the peak hour.<br />
face of the ticket counter) does not meet the current standard of<br />
11 feet. For T2 West and for all programmed <strong>requirements</strong>,<br />
11 feet is designated as the standard. The T2 West ratio of<br />
3.5 square feet per peak hour originating passenger was<br />
identified as the planning ratio for future facilities.<br />
Similarly, the existing ticket counter queuing area is less than<br />
adequate due to T1 and T2 East substandard condition. To<br />
provide an acceptable LOS standard, a planning factor of<br />
7.0 square feet per peak hour originating passenger was used for<br />
future <strong>requirements</strong>. Conversely, the current airline ticket office<br />
(ATO) area existing ratio is sufficient for an acceptable LOS, and<br />
therefore, the current 11.28 square feet per peak hour originating<br />
passenger was used as the planning factor. Airline clubrooms<br />
also employ the existing factor of 0.0014 square feet per annual<br />
enplaned passenger was used to determine future <strong>requirements</strong>.<br />
The baggage claim area for the terminals is currently larger than<br />
required since the area provided in T2 West permits the addition<br />
of two claim devices. Therefore, the existing ratio of 21.85 square<br />
feet per peak hour terminating passenger has been reduced to<br />
19.0 to reflect the IATA standard for LOS B. The existing nine<br />
claim devices provide an average of 130 linear feet per device.<br />
This ratio was maintained for the calculation of the requirement<br />
for future claim devices. The current 1.97 ratio for baggage<br />
service offices was also maintained to determine the need for<br />
future facilities. Finally, the existing planning factors for<br />
outbound and inbound baggage were also maintained.<br />
The existing airline operations area ratio of 0.008 square foot per<br />
annual enplaned passenger is maintained for future<br />
<strong>requirements</strong>.<br />
SAN DIEGO INTERNATIONAL AIRPORT<br />
JACOBS CONSULTANCY TEAM<br />
DESTINATION LINDBERGH: THE ULTIMATE BUILD-OUT PAGE 4-7
Table 4-3<br />
EXISTING AND FUTURE PLANNING RATIOS FOR PASSENGER TERMINALS<br />
<strong>San</strong> <strong>Diego</strong> <strong>International</strong> <strong>Airport</strong><br />
Existing Existing ratio<br />
Planning<br />
Description Demand level Length (lf) Area (sf) Ratio Units<br />
ratio Comments<br />
AIRLINE FUNCTIONS<br />
Ticket counter area 2,527 PHOP - 6,586 2.61 SF/PHOP 3.84 11' x LF of T/C<br />
Ticket counter length 2,527 PHOP 765 - 0.30 LF/PHOP 0.35 Comparable <strong>Airport</strong>s<br />
Ticket counter queuing 2,527 PHOP - 9,426 3.73 SF/PHOP 7.00 20' x LF T/C<br />
Airline ticket office 2,527 PHOP - 28,495 11.28 SF/PHOP 11.28 Existing ratio<br />
Baggage claim area 2,336 PHTP - 51,040 21.85 SF/PHTP 19.00 Comparable <strong>Airport</strong>s<br />
Baggage claim frontage 2,336 PHTP 1,177 - 0.50 LF/PHTP 0.60 Comparable <strong>Airport</strong>s<br />
Baggage claim devices 2,336 PHTP 9 ea - 130.78 LF/Device 130 Existing ratio<br />
Baggage service office 2,336 PHTP - 4,597 1.97 SF/PHTP 1.97 Existing ratio<br />
Outbound baggage 2,527 PHOP - 50,010 19.79 SF/PHOP 19.79 Existing ratio<br />
Inbound baggage 2,336 PHTP - 27,278 11.68 SF/PHTP 11.68 Existing ratio<br />
Airline operations 7,637,193 ANNEP - 61,035 0.008 SF/ANNEP 0.008 Existing ratio<br />
Clubrooms 7,637,193 ANNEP - 10,957 0.0014 SF/ANNEP 0.0014 Existing ratio<br />
CONCESSIONS<br />
Concessions (Includes Storage) 7,637,193 ANNEP - 68,914 0.0090 SF/ANNEP 0.0120 Comparable <strong>Airport</strong>s<br />
FEDERAL INSPECTION SERVICES<br />
FIS (CIS, Claim, CBP, USDA) 125 PHTP-I - 7,000 56.00 SF/ANNEP 85 Existing Factor<br />
SECURE PUBLIC AREA<br />
Passenger screening checkpoint 2,527 PHOP 18 ea - 140 PHOP/Lane 160 Existing Factor<br />
Passenger screening area 18 Lanes - 10,203 567 SF/Lane 1,300 Comparable <strong>Airport</strong>s<br />
Concourse circulation 39 Gates - 90,825 2,329 SF/Gate 3,000 Comparable <strong>Airport</strong>s<br />
NON-SECURE PUBLIC AREA<br />
Ticketing circulation 2,527 PHOP - 16,526 6.54 SF/PHOP 10.50 30' x LF T/C<br />
Baggage claim circulation 2,336 PHTP - 7,380 3.16 SF/PHTP 5.00 Comparable <strong>Airport</strong>s<br />
General circulation 7,637,193 ANNEP - 52,940 0.007 SF/ANNEP 0.015 Comparable <strong>Airport</strong>s<br />
NON-PUBLIC AREA<br />
TSA 2,527 PHOP - 4,676 1.85 SF/PHOP 1.85 Existing ratio<br />
SDCRAA 7,637,193 ANNEP - 7,163 0.0009 SF/ANNEP 0.0009 Existing ratio<br />
Mech./Elec./Maint./Storage - 58,000 7% % of T. Area 12% Comparable <strong>Airport</strong>s<br />
SF = square feet; LF = linear feet<br />
PHOP = peak hour origination passengers; PHTP= peak hour terminating passengers; PHTP –I = peak hour terminating international passengers; PHP = peak hour passengers;<br />
ANNEP = annual enplaning passengers<br />
Source: HNTB analysis, September 2008.<br />
SAN DIEGO INTERNATIONAL AIRPORT JACOBS CONSULTANCY TEAM<br />
DESTINATION LINDBERGH: THE ULTIMATE BUILD-OUT PAGE 4-8
SDIA has fewer<br />
concession areas per<br />
annual passenger than<br />
the national average or<br />
industry standards.<br />
Concessions. The sizing of concession space is influenced by a<br />
variety of specific factors. For this study, a standard square<br />
footage per enplaned passenger derived from the characteristics<br />
of other large origin-destination markets similar to <strong>San</strong> <strong>Diego</strong><br />
was used. In general, SDIA is significantly below the industry<br />
standard for acceptable levels of service with regard to<br />
concession space. As such, the existing ratio of 0.009 square foot<br />
per annual enplaned passenger was increased to 0.012 to reflect<br />
industry standards for acceptable levels of service.<br />
Federal Inspection Services (FIS). The facilities provided for the<br />
federal inspection of arriving international passengers include:<br />
Customs and Immigration Services (CIS), baggage claim,<br />
Customs and Border Patrol (CBP), and United States Department<br />
of Agriculture (USDA). Currently, the FIS facilities at SDIA<br />
process 125 passengers in the peak hour. The allocation of<br />
7,000 square feet for the FIS <strong>facility</strong> is less than that provided at<br />
comparable airports for this number of passengers. Accordingly,<br />
future <strong>requirements</strong> have been derived using 85 square feet per<br />
peak hour international terminating passenger. This ratio<br />
provides <strong>requirements</strong> for FIS facilities sized similarly to<br />
comparable airports.<br />
Secure public area. Secure public areas include the security<br />
checkpoints, secure circulation, and concourse circulation.<br />
Currently, the 18 security checkpoint lanes at SDIA process<br />
approximately 140 passengers per hour based on peak hour<br />
demand. The security checkpoint throughput requirement was<br />
increased to 160 passengers per hour for the future <strong>requirements</strong><br />
to provide acceptable levels of service. In addition, the security<br />
area is insufficient by TSA standards. The future <strong>requirements</strong><br />
will reflect a larger allocation of space at 1,300 square feet per<br />
security lane.<br />
Currently, concourse circulation is inadequate at both T1 and T2<br />
East, and the current factor of 2,329 square feet per gate has been<br />
increased to 3,000 square feet per gate to reflect the need for<br />
improved passenger circulation.<br />
Non-secure public area. The non-secure public areas include<br />
the ticketing lobby, the baggage claim lobby, and general<br />
circulation which include entrance vestibules, fire stairs,<br />
escalators, and elevators. The United Services Organization<br />
SAN DIEGO INTERNATIONAL AIRPORT<br />
JACOBS CONSULTANCY TEAM<br />
DESTINATION LINDBERGH: THE ULTIMATE BUILD-OUT PAGE 4-9
Generally, existing<br />
terminal facilities<br />
operate below desirable<br />
levels of service at the<br />
existing passenger<br />
demand levels.<br />
Additional terminal<br />
space is needed to meet<br />
current demand.<br />
(USO) is also included in the non-secure public area. The<br />
existing planning factors for circulation in the ticketing lobby,<br />
baggage claim and general circulation were increased to provide<br />
future facilities that would provide LOS standards similar to<br />
those experienced in T2 West. The USO is assumed to remain<br />
the same size throughout the forecast years.<br />
Non-public area. Non-public areas include private office space<br />
for the Authority, the TSA and building support spaces such as<br />
mechanical rooms, loading docks, maintenance, and storage. For<br />
both the TSA and the Authority offices, the existing factors were<br />
used to determine future <strong>requirements</strong>. Currently, mechanical,<br />
electrical, maintenance and storage facilities comprise about<br />
seven percent of the total terminal area. Typically, these areas<br />
are programmed at 12 percent of the terminal area; accordingly,<br />
future facilities will be programmed at 12 percent of total<br />
terminal area to provide adequate space for mechanical,<br />
electrical, maintenance, and storage.<br />
4.3.2 Requirements<br />
Table 4-4 provides an analysis of the excesses and deficiencies of<br />
the current overall terminal facilities using the planning ratios.<br />
Most existing passenger processing facilities are deficient, as<br />
shown. As shown, the SDIA terminals are approximately<br />
165,500 square feet deficient in area. As shown in Table 4-4, the<br />
terminal functional areas with the greatest deficiencies include:<br />
ticket counter queue, concessions, passenger screening, and<br />
circulation for the ticketing, baggage claim, and concourses.<br />
SAN DIEGO INTERNATIONAL AIRPORT<br />
JACOBS CONSULTANCY TEAM<br />
DESTINATION LINDBERGH: THE ULTIMATE BUILD-OUT PAGE 4-10
Table 4-4<br />
PASSENGER TERMINAL EXCESSES AND DEFICIENCIES<br />
<strong>San</strong> <strong>Diego</strong> <strong>International</strong> <strong>Airport</strong><br />
Existing<br />
Required<br />
area<br />
Description Length (lf) Area (sf) Planning ratio<br />
Excess / (deficiency)<br />
AIRLINE FUNCTIONS<br />
Ticket counter area - 6,586 3.84 SF/PHOP 9,704 (3,118)<br />
Ticket counter length 765 - 0.35 LF/PHOP 884 (119)<br />
Ticket counter queuing - 9,426 7.00 SF/PHOP 17,689 (8,263)<br />
Airline ticket office - 28,495 11.28 SF/PHOP 28,495 0<br />
Baggage claim area - 51,040 19.00 SF/PHTP 44,384 6,656<br />
Baggage claim frontage 1,177 - 0.60 LF/PHTP 1,402 (225)<br />
Baggage claim devices 9 ea - 130 LF/Device 156 (25)<br />
Baggage service office - 4,597 1.97 SF/PHTP 4,597 0<br />
Outbound baggage - 50,010 19.79 SF/PHOP 50,010 0<br />
Inbound baggage - 27,278 11.68 SF/PHTP 27,278 0<br />
Airline operations - 61,035 0.01 SF/ANNEP 61,035 0<br />
Departure holdrooms - 102,788 2,190 SF/gate 89,700 13,088<br />
Clubrooms - 10,957 0.0014 SF/ANNEP 10,957 0<br />
CONCESSIONS<br />
Concessions (Includes Storage) - 68,914 0.0120 SF/ANNEP 91,646 (22,732)<br />
FEDERAL INSPECTION SERVICES<br />
FIS (CIS, Claim, CBP, USDA) - 7,000 85 SF/ANNEP 10,000 (3,000)<br />
SECURE PUBLIC AREA<br />
Passenger screening checkpoint 18 - 160 PHOP/Lane 18 0<br />
Passenger screening area - 10,203 1,300 SF/Lane 23,465 (13,262)<br />
Concourse circulation - 90,825 3,000 SF/Gate 117,000 (26,175)<br />
NON-SECURE PUBLIC AREA<br />
Ticketing circulation - 16,526 10.50 SF/PHOP 26,534 (10,008)<br />
Baggage claim circulation - 7,380 5.00 SF/PHTP 11,680 (4,300)<br />
General circulation - 52,940 0.015 SF/ANNEP 114,558 (61,618)<br />
USO - 6,520 6,520 0<br />
NON-PUBLIC AREA<br />
TSA - 4,676 1.85 SF/PHOP 4,676 0<br />
SDCRAA - 7,163 0.0009 SF/ANNEP 7,163 0<br />
Mech./Elec./Maint./Storage - 58,000 12% % of T. Area 90,851 (32,851)<br />
TOTAL AREA 682.539 847,941 (165,582)<br />
SF = square feet; LF = linear feet; PHOP = peak hour origination passengers; PHTP= peak hour terminating passengers; PHTP –I =<br />
peak hour terminating international passengers; PHP = peak hour passengers; ANNEP = annual enplaning passengers<br />
Source: HNTB analysis, September 2008.<br />
The terminal <strong>facility</strong><br />
required to meet PAL2<br />
demand is approximately<br />
1.7 million<br />
square feet, 0.9 million<br />
square feet larger than<br />
today’s terminal building<br />
area combined.<br />
A summary of the terminal <strong>facility</strong> <strong>requirements</strong> for each of the<br />
functional areas for both PAL1 and PAL2 is provided in<br />
Table 4-5. The total terminal area required for PAL1 is<br />
approximately 1.4 million square feet. This is approximately<br />
618,000 square feet larger than the existing terminal facilities.<br />
The total terminal <strong>facility</strong> required for PAL2 is approximately<br />
1.7 million square feet. This area is approximately<br />
933,000 square feet larger than the existing terminal facilities.<br />
SAN DIEGO INTERNATIONAL AIRPORT<br />
JACOBS CONSULTANCY TEAM<br />
DESTINATION LINDBERGH: THE ULTIMATE BUILD-OUT PAGE 4-11
Table 4-5<br />
TERMINAL FACILITY REQUIREMENTS<br />
<strong>San</strong> <strong>Diego</strong> <strong>International</strong> <strong>Airport</strong><br />
PAL1<br />
PAL2<br />
Description Planning factors Demand levels Area (sf) Demand levels Area (sf)<br />
AIRLINE FUNCTIONS<br />
Ticket Counter Area 3.84 SF/PHOP 3,340 PHOP 12,826 4,150 PHOP 15,936<br />
Ticket Counter Queuing 7.00 SF/PHOP 3,340 PHOP 23,380 4,150 PHOP 29,050<br />
Airline Ticket Office 11.28 SF/PHOP 3,340 PHOP 37,675 4,150 PHOP 46,812<br />
Baggage Claim Area 19.00 SF/PHTP 3,172 PHTP 60,268 3,938 PHTP 74,822<br />
Baggage Service Office 1.97 SF/PHTP 3,172 PHTP 6,249 3,938 PHTP 7,758<br />
Outbound Baggage 19.79 SF/PHOP 3,340 PHOP 66,099 4,150 PHOP 82,129<br />
EDS In-Line Screening Area 9.90 SF/PHOP 3,340 PHOP 33,049 4,150 PHOP 41,064<br />
Inbound Baggage 11.68 SF/PHTP 3,172 PHTP 37,049 3,938 PHTP 45,996<br />
Airline Operations 0.008 SF/ANNEP 11,351,200 ANNEP 90,810 14,106,800 ANNEP 112,854<br />
Departures Lounge 53 Gates 122,350 61 Gates 143,700<br />
Wide Body 3,500 SF/gate 10 Gates 35,000 13 Gates 45,500<br />
B757-200 2,250 SF/gate 5 Gates 11,250 5 Gates 11,250<br />
Narrow Body 2,050 SF/gate 32 Gates 65,600 39 Gates 79,950<br />
Regional 1,750 SF/gate 6 Gates 10,500 4 Gates 7,000<br />
Turboprop 950 SF/gate - Gates - Gates -<br />
Clubrooms 0.0014 SF/ANNEP 11,351,200 ANNEP 15,892 14,106,800 ANNEP 19,750<br />
Subtotal airline functions 505,646 619,870<br />
CONCESSIONS 0.012 SF/ANNEP 1,351,200 ANNEP 136,214 14,106,800 ANNEP 169,282<br />
FEDERAL INSPECTION<br />
SERVICES 85 SF/PHTP-I 380 PHTP-I 30,400 531 PHTP-I 42,480<br />
SECURE PUBLIC AREA<br />
Passenger Screening Area 1,300 SF/lane 18 lanes 23,904 22 lanes 27,969<br />
Concourse Circulation 3,000 SF/gate 53 gates 159,000 61 gates 183,000<br />
Restrooms 3.00 SF/PHP 6,105 PHP 18,315 7,579 PHP 22,737<br />
Other 0.0010 SF/ANNEP 11,351,200 ANNEP 11,351 14,106,800 ANNEP 14,107<br />
Subtotal Secure Public Area 212,570 247,813<br />
NON-SECURE PUBLIC AREA<br />
Circulation-ticketing 10.50 SF/PHOP 3,340 PHOP 35,070 4,150 PHOP 43,575<br />
Circulation-baggage claim 5.00 SF/PHTP 3,172 PHTP 15,860 3,398 PHTP 19,690<br />
Circulation-general 1.50% of total SF 11,351,200 ANNEP 170,268 14,106,800 ANNEP 211,602<br />
USO 6,521 6,521<br />
Restrooms 2.00 SF/PHP 6,105 PHP 12,210 7,579 PHP 15,158<br />
Other 0.001 SF/ANNEP 11,351,200 ANNEP 11,351 14,106,800 ANNEP 14,107<br />
Subtotal non-secure public area 251,280 310,653<br />
NON-PUBLIC AREA<br />
TSA 1.85 SF/PHOP 3,340 PHOP 6,179 4,150 PHOP 7,768<br />
SDCRAA 0.0009 SF/ANNEP 11,351,200 ANNEP 10,216 14,106,800 ANNEP 12,696<br />
Circulation 4% of total SF 46,100 56,419<br />
Maintenance/storage 2% of total SF 23,050 28,209<br />
Mechanical/electrical 10% of total SF 115,251 141,047<br />
Other 6% of total SF 69,150 84,628<br />
Subtotal non-public area 269,946 330,677<br />
TOTAL FUNCTION AREA 1,406,057 1,720,774<br />
Notes: SF = square feet; PHOP = peak hour originating passengers; PHTP = peak hour terminating passengers; PHTP-I = peak hour<br />
terminating international passengers; PHP = peak hour passengers; ANNEP = annual enplaning passengers.<br />
Source: HNTB analysis, September 2008.<br />
SAN DIEGO INTERNATIONAL AIRPORT<br />
JACOBS CONSULTANCY TEAM<br />
DESTINATION LINDBERGH: THE ULTIMATE BUILD-OUT PAGE 4-12
4.3.3 Area Comparison<br />
Table 4-6 provides a comparison between the existing terminal<br />
facilities and PAL1 and PAL2 forecast program <strong>requirements</strong>.<br />
Table 4-6<br />
EXISTING AND FUTURE TERMINAL AREA COMPARISON<br />
<strong>San</strong> <strong>Diego</strong> <strong>International</strong> <strong>Airport</strong><br />
Required area (square feet)<br />
Existing area<br />
(square feet)<br />
PAL1<br />
Percent<br />
Increase<br />
PAL2<br />
Percent<br />
Increase<br />
787,425 1,406,057 79% 1,720,774 119%<br />
Additional area<br />
required 618,632 933,349<br />
Source: HNTB analysis, September 2008.<br />
4.3.4 Gate Requirements<br />
This section presents the methodology used to determine future<br />
aircraft gate <strong>requirements</strong> for commercial passenger airlines<br />
operating at SDIA for both PAL1 and PAL2:<br />
• PAL1: equivalent to unconstrained demand in year 2020;<br />
• PAL2: equivalent to 2030 demand in the constrained<br />
scenario.<br />
To estimate gate <strong>requirements</strong> for PAL1 and PAL2 at SDIA,<br />
aggregate domestic and international enplanements and<br />
operations were allocated to airline and aircraft groups.<br />
Domestic Traffic. The segmentation of domestic enplanements<br />
was based on the following assumptions regarding the airlines’<br />
future air service:<br />
• Southwest will continue to be the dominant carrier at<br />
SDIA.<br />
• Legacy carriers will grow at a slower pace than their lowcost<br />
carrier (LCC) counterparts.<br />
• LCCs such as AirTran and jetBlue will experience the<br />
fastest growth rates due to their focus in northeast and<br />
southeast regions which are expected to experience the<br />
strongest growth over the forecast period.<br />
SAN DIEGO INTERNATIONAL AIRPORT<br />
JACOBS CONSULTANCY TEAM<br />
DESTINATION LINDBERGH: THE ULTIMATE BUILD-OUT PAGE 4-13
• American, Continental, and Delta currently focus their<br />
traffic on the east coast and their main hubs. As they are<br />
well established in these regions, it was assumed that<br />
these airlines will experience relatively slower growth<br />
over the forecast period.<br />
• Hawaiian and Alaska tend to focus more on the Pacific<br />
region. As a result, these two airlines are expected to<br />
grow at a rate of 1.9 to 2.0 percent annually through<br />
PAL2.<br />
Table 4-7 provides a summary of domestic enplanements by<br />
airline. While legacy carriers accounted for 54.5 percent of the<br />
total domestic enplanements in 2008, this trend will be reversed<br />
by PAL2 with LCCs projected to account for 54.8 percent of<br />
domestic enplanements.<br />
The corresponding domestic operations by airline are presented<br />
in Table 4-8. Domestic operations by legacy carriers are<br />
expected to increase from about 109,000 operations to just over<br />
113,000 operations by PAL2, averaging growth of just 0.2 percent<br />
per year. Legacy carriers typically have more diverse fleets than<br />
LCCs and as a result are expected to have more flexibility to upgauge<br />
aircraft at SDIA and as a result experience significantly<br />
slower growth in operations than passenger traffic. Growth in<br />
LCC domestic operations is expected to more closely mirror<br />
forecast passenger growth rates due to their operating more<br />
limited narrow-body jet fleets.<br />
SAN DIEGO INTERNATIONAL AIRPORT<br />
JACOBS CONSULTANCY TEAM<br />
DESTINATION LINDBERGH: THE ULTIMATE BUILD-OUT PAGE 4-14
Carrier 2008 PAL1 PAL2<br />
Table 4-7<br />
DOMESTIC ENPLANEMENTS BY AIRLINE<br />
<strong>San</strong> <strong>Diego</strong> <strong>International</strong> <strong>Airport</strong><br />
Enplanements AAGR % of Total<br />
08-<br />
PAL1<br />
08-<br />
PAL2 2008 PAL1 PAL2<br />
LCC<br />
AirTran 118,204 174,693 235,531 3.3% 3.2% 1.3% 1.6% 1.7%<br />
Allegiant 12,918 15,827 19,940 1.7% 2.0% 0.1% 0.1% 0.1%<br />
Frontier 234,818 287,464 344,222 1.7% 1.8% 2.6% 2.6% 2.5%<br />
JetBlue 254,196 338,994 449,411 2.4% 2.6% 2.8% 3.1% 3.2%<br />
Southwest 3,357,524 4,450,960 6,254,654 2.4% 2.9% 36.8% 40.3% 45.2%<br />
Sun<br />
Country 41,631 51,092 62,958 1.7% 1.9% 0.5% 0.5% 0.5%<br />
Virgin<br />
America 139,825 171,590 211,434 1.7% 1.9% 1.5% 1.6% 1.5%<br />
Subtotal 4,159,118 5,490,620 7,578,150 2.3% 2.8% 45.5% 49.7% 54.8%<br />
Legacy<br />
Alaska 437,629 526,039 667,039 1.5% 1.9% 4.8% 4.8% 4.8%<br />
Aloha 15,642 - - n.c. n.c. 0.2% 0.0% 0.0%<br />
American 975,831 1,160,492 1,249,732 1.5% 1.1% 10.7% 10.5% 9.0%<br />
Continental 512,358 557,093 604,319 0.7% 0.8% 5.6% 5.0% 4.4%<br />
Delta 742,000 870,757 945,808 1.3% 1.1% 8.1% 7.9% 6.8%<br />
ExpressJet 161,205 - - n.c. n.c. 1.8% 0.0% 0.0%<br />
Hawaiian 133,535 162,389 207,104 1.6% 2.0% 1.5% 1.5% 1.5%<br />
Midwest 34,105 34,400 38,808 0.1% 0.6% 0.4% 0.3% 0.3%<br />
Northwest 288,750 325,372 363,611 1.0% 1.1% 3.2% 2.9% 2.6%<br />
United 1,059,475 1,212,815 1,371,151 1.1% 1.2% 11.6% 11.0% 9.9%<br />
US<br />
Airways 616,251 713,723 813,378 1.2% 1.3% 6.7% 6.5% 5.9%<br />
Subtotal 4,976,782 5,563,080 6,260,950 0.9% 1.0% 54.5% 50.3% 45.2%<br />
Total 9,135,900 11,053,700 13,839,100 1.6% 1.9% 100.0% 100.0% 100.0%<br />
Note: n.c. = not calculated.<br />
Source: Landrum & Brown analysis.<br />
SAN DIEGO INTERNATIONAL AIRPORT<br />
JACOBS CONSULTANCY TEAM<br />
DESTINATION LINDBERGH: THE ULTIMATE BUILD-OUT PAGE 4-15
Table 4-8<br />
DOMESTIC COMMERCIAL PASSENGER AIRCRAFT OPERATIONS BY AIRLINE<br />
<strong>San</strong> <strong>Diego</strong> <strong>International</strong> <strong>Airport</strong><br />
Operations AAGR % of Total<br />
Carrier 2008 PAL1 PAL2<br />
08-<br />
PAL1<br />
08-<br />
PAL2 2008 PAL1 PAL2<br />
LCC<br />
AirTran 2,148 3,175 4,280 3.3% 3.2% 1.1% 1.5% 1.7%<br />
Allegiant 174 202 255 1.3% 1.8% 0.1% 0.1% 0.1%<br />
Frontier 4,236 5,341 5,729 2.0% 1.4% 2.1% 2.5% 2.3%<br />
JetBlue 4,648 5,650 7,490 1.6% 2.2% 2.3% 2.6% 3.0%<br />
Southwest 75,036 89,593 112,252 1.5% 1.8% 37.7% 41.9% 45.4%<br />
Sun Country 718 822 972 1.1% 1.4% 0.4% 0.4% 0.4%<br />
Virgin<br />
America 3,024 3,138 3,179 0.3% 0.2% 1.5% 1.5% 1.3%<br />
Subtotal 89,984 107,921 134,159 1.5% 1.8% 45.2% 50.4% 54.2%<br />
Legacy<br />
Alaska 8,354 8,687 10,211 0.3% 0.9% 4.2% 4.1% 4.1%<br />
Aloha 352 - - n.c. n.c. 0.2% 0.0% 0.0%<br />
American 27,582 26,562 24,877 -0.3% -0.5% 13.9% 12.4% 10.1%<br />
Continental 7,356 7,916 8,437 0.6% 0.6% 3.7% 3.7% 3.4%<br />
Delta 10,822 14,543 17,181 2.5% 2.1% 5.4% 6.8% 6.9%<br />
ExpressJet 9,598 - - n.c. n.c. 4.8% 0.0% 0.0%<br />
Hawaiian 1,222 1,430 1,783 1.3% 1.7% 0.6% 0.7% 0.7%<br />
Midwest 956 929 1,053 -0.2% 0.4% 0.5% 0.4% 0.4%<br />
Northwest 4,232 4,938 5,521 1.3% 1.2% 2.1% 2.3% 2.2%<br />
United 27,550 29,288 31,226 0.5% 0.6% 13.9% 13.7% 12.6%<br />
US Airways 10,852 11,785 13,020 0.7% 0.8% 5.5% 5.5% 5.3%<br />
Subtotal 108,876 106,079 113,309 -0.2% 0.2% 54.8% 49.6% 45.8%<br />
Total 198,860 214,000 247,468 0.6% 1.0% 100.0% 100.0% 100.0%<br />
Source: Landrum & Brown analysis.<br />
<strong>International</strong> Traffic. Similar to domestic enplanements,<br />
international enplanements were distributed among the airlines<br />
that provide or are expected to provide international service at<br />
SDIA. Table 4-9 presents international enplanements by airline<br />
for PAL1 and PAL2.<br />
As Mexico is expected to be one of the fastest growing<br />
international destinations from SDIA, Aeromexico and Alaska<br />
are expected to experience 5.1 and 4.8 percent growth per<br />
annum, respectively, through PAL2. Enplanements to Europe,<br />
SAN DIEGO INTERNATIONAL AIRPORT<br />
JACOBS CONSULTANCY TEAM<br />
DESTINATION LINDBERGH: THE ULTIMATE BUILD-OUT PAGE 4-16
which started with Zoom Airlines in 2008, are expected to grow<br />
7.3 percent annually over the forecast period. Airlines with<br />
service to Canada will experience more moderate growth.<br />
Finally, airline(s) serving the Pacific region (service anticipated<br />
to begin by 2015) will constitute 12.1 percent of the international<br />
enplanements in PAL2.<br />
Table 4-9<br />
INTERNATIONAL ENPLANEMENTS BY AIRLINE<br />
<strong>San</strong> <strong>Diego</strong> <strong>International</strong> <strong>Airport</strong><br />
Enplanements CAGR Share of total<br />
Carrier 2008 PAL1 PAL2 08-PAL1 08-PAL2 2008 PAL1 PAL2<br />
Aeromexico 32,290 75,296 95,937 7.3% 5.1% 25.2% 25.3% 26.0%<br />
Air Canada 45,434 69,908 77,375 3.7% 2.4% 35.4% 23.5% 20.9%<br />
Alaska 33,444 62,488 92,939 5.3% 4.8% 26.1% 21.0% 25.2%<br />
US Airways 7,069 9,412 10,531 2.4% 1.8% 5.5% 3.2% 2.9%<br />
Europe 10,063 41,496 47,745 12.5% 7.3% 7.8% 13.9% 12.9%<br />
Pacific - 39,000 44,873 n.c. n.c. 0.0% 13.1% 12.1%<br />
Total 128,300 297,600 369,400 7.3% 4.9% 100.0% 100.0% 100.0%<br />
CAGR = compound annual growth rate; n.c. = not calculated.<br />
Source: Landrum & Brown analysis.<br />
The international fleet in 2008 was comprised of mainly narrowbody<br />
aircraft (89 percent). Over the forecast period, the airlines<br />
will tend to replace older aircraft such as B734s and MD80s with<br />
newer B737s, B738s, B739s and E90s. Airlines serving Europe<br />
and the Pacific region are expected to use wide-body aircraft<br />
such as B763s, B787s, and A350s. As a result, aircraft gauge is<br />
expected to grow from 124.0 in 2008 to 144.4 in PAL1 and PAL2.<br />
Table 4-10 provides a summary of the international aircraft<br />
operations for each airline.<br />
SAN DIEGO INTERNATIONAL AIRPORT<br />
JACOBS CONSULTANCY TEAM<br />
DESTINATION LINDBERGH: THE ULTIMATE BUILD-OUT PAGE 4-17
Table 4-10<br />
INTERNATIONAL PASSENGER AIRCRAFT OPERATIONS BY AIRLINE<br />
<strong>San</strong> <strong>Diego</strong> <strong>International</strong> <strong>Airport</strong><br />
Operations CAGR Share of total<br />
Carrier 2008 PAL1 PAL2<br />
08-<br />
PAL1<br />
08-<br />
PAL2 2008 PAL1 PAL2<br />
Aeromexico 742 1,608 1,978 6.7% 4.6% 26.5% 28.2% 28.7%<br />
Air Canada 1,024 1,746 1,916 4.5% 2.9% 36.5% 30.6% 27.8%<br />
Alaska 732 1,240 1,737 4.5% 4.0% 26.1% 21.8% 25.2%<br />
US Airways 192 274 306 3.0% 2.1% 6.8% 4.8% 4.4%<br />
Europe 114 416 479 11.4% 6.7% 4.1% 7.3% 6.9%<br />
Pacific - 416 479 n.c. n.c. 0.0% 7.3% 6.9%<br />
Total 2,804 5,700 6,894 6.1% 4.2% 100.0% 100.0% 100.0%<br />
CAGR = compound annual growth rate; n.c. = not calculated.<br />
Source: Landrum & Brown analysis.<br />
Terminal Gate Requirements. Domestic and international gate<br />
<strong>requirements</strong> were developed for each carrier for PAL1 and<br />
PAL2 using a methodology based on the number of turns per<br />
gate. The number of turns per gate for each airline was assessed<br />
for 2008 to determine the efficiency with which each airline is<br />
currently using its gates. A future turns per gate assumption<br />
was derived for each airline for PAL1 and PAL2 to develop gate<br />
<strong>requirements</strong> for each planning level.<br />
On average airlines operated 6.6 turns per gate at SDIA in 2008.<br />
This is expected to increase to 6.9 turns per gate by PAL1 and to<br />
7.1 turns per gate by PAL2.<br />
<strong>International</strong> aircraft typically need to be on the ground longer<br />
than domestic flights so the utilization of the domestic gates is<br />
higher than international gates. The international gates are<br />
currently being used for less than one turn per day on average.<br />
By PAL2, the number of turns per gate on the international gates<br />
is expected to increase to 2.3.<br />
Southwest typically has higher gate utilization than legacy<br />
carriers and this holds true at SDIA. Southwest averaged 10.7<br />
domestic turns per gate in 2008. Given Southwest’s already high<br />
level of gate use, turns per gate were held constant through<br />
PAL2.<br />
SAN DIEGO INTERNATIONAL AIRPORT<br />
JACOBS CONSULTANCY TEAM<br />
DESTINATION LINDBERGH: THE ULTIMATE BUILD-OUT PAGE 4-18
Requirements for ground<br />
transportation functions<br />
are based on a peak day<br />
in the average month.<br />
Gate utilization in the Commuter Terminal was higher than the<br />
average in 2008. American Eagle averaged 11 domestic turns per<br />
gate while United Express averaged 8 turns per gate. American<br />
Eagle’s high gate utilization is not considered sustainable and is<br />
expected to decrease to 8.5 turns per gate by PAL2. United<br />
Express’ gate utilization is expected to drop slightly in PAL1 and<br />
then return to 8 turns per gate in PAL2. The decreases in gate<br />
utilization for the commuter carriers is a function of reduced<br />
activity in the future.<br />
Air Canada, Delta, Hawaiian, and Sun Country are expected to<br />
achieve slightly higher gate utilization by PAL2. Most of the<br />
other carriers are expected to maintain their current gate<br />
utilization through PAL2.<br />
Based on these assumptions, a total of 61 narrow-body<br />
equivalent gates (NBEG) will be required by PAL2, as shown in<br />
Table 4-11.<br />
4.4 Ground Transportation Requirements<br />
This section presents the ground transportation <strong>requirements</strong> for<br />
PAL1 and PAL2. The ground transportation facilities analyzed<br />
include the terminal curbside, public parking, employee parking<br />
and rental car.<br />
4.4.1 Program Methodology<br />
Ground transportation <strong>requirements</strong> were developed for a peak<br />
month average day and do not account for peak holiday travel,<br />
such as Thanksgiving and Christmas.<br />
Current vehicle mode share and occupancies, shown in<br />
Table 4-12 were derived from survey data and calibrated against<br />
available traffic counts and transaction records. For the purpose<br />
of developing general ground transportation <strong>facility</strong><br />
<strong>requirements</strong>, it was assumed that future mode share and<br />
vehicle occupancy would remain similar in the future.<br />
SAN DIEGO INTERNATIONAL AIRPORT<br />
JACOBS CONSULTANCY TEAM<br />
DESTINATION LINDBERGH: THE ULTIMATE BUILD-OUT PAGE 4-19
Table 4-11<br />
TERMINAL GATE REQUIREMENTS<br />
<strong>San</strong> <strong>Diego</strong> <strong>International</strong> <strong>Airport</strong><br />
PMAWD Operations PMAWD Enplanements Turns per Gate(c) Gate Requirements<br />
Airline 2008 PAL1 PAL2 2008 PAL1 PAL2 PAL1 PAL2 2008 PAL1 PAL2<br />
PAL2<br />
NBEG (b)<br />
Domestic<br />
Air Canada 4 4 6 170 170 256 2.0 3.0 0.4 0.5 1.0 1.0<br />
AirTran 10 12 14 555 666 777 5.0 5.0 0.7 2.0 2.0 2.0<br />
Alaska 24 26 28 1,238 1,548 1,730 4.0 4.0 3.0 4.0 4.0 4.0<br />
Allegiant 2 2 2 149 156 156 1.0 1.0 0.1 0.2 0.2 0.2<br />
Aloha 2 - - 89 - - - - 0.2 - - -<br />
American 34 36 40 2,012 2,387 2,824 3.4 3.4 5.0 5.0 5.0 6.0<br />
American Eagle 44 42 34 678 932 736 10.5 8.5 2.0 2.0 2.0 2.0<br />
Continental 20 24 24 1,376 1,699 1,745 5.0 5.0 2.0 3.0 3.0 3.0<br />
Delta 1/ 32 48 58 2,149 2,920 3,888 6.9 6.9 2.4 4.0 5.0 6.0<br />
ExpressJet 26 - - 449 - - - - 1.0 - - -<br />
Frontier 12 14 16 644 753 951 6.0 6.0 1.0 2.0 2.0 2.0<br />
Hawaiian 4 4 6 438 454 681 2.0 3.0 0.3 0.4 0.4 0.4<br />
jetBlue 16 20 24 876 1,200 1,440 4.0 4.0 2.0 3.0 3.0 3.0<br />
Midwest 4 2 4 145 72 145 1.0 2.0 0.3 0.2 0.2 0.2<br />
Northwest (a) 14 - - 941 - - - - 0.9 - - -<br />
Southwest 214 258 318 9,580 13,124 17,391 10.7 10.7 10.0 12.0 15.0 15.0<br />
Sun Country 2 2 4 117 125 256 1.0 2.0 0.2 0.2 0.2 0.2<br />
United 44 52 56 2,515 3,005 3,382 4.8 4.8 4.6 5.5 6.0 6.0<br />
United Express 32 30 32 405 439 464 7.5 8.0 2.0 2.0 2.0 2.0<br />
US Airways 28 32 36 1,566 1,892 2,254 7.0 7.0 2.0 3.0 3.0 3.0<br />
Virgin America 10 10 10 461 542 674 5.0 5.0 1.0 1.0 1.0 1.0<br />
Subtotal 578 618 712 26,551 32,086 39,750 6.9 7.1 41.0 50.0 55.0 57.0<br />
<strong>International</strong><br />
Aeromexico 2 4 4 87 203 209 2.0 2.0 1.0 1.0 1.0 1.0<br />
Alaska 2 4 4 91 200 209 2.0 2.0 1.0 1.0 1.0 1.0<br />
Europe - 2 2 - 200 200 1.0 1.0 - 0.5 0.3 0.7<br />
Pacific - 2 2 - 188 188 1.0 1.0 - 0.5 0.3 0.7<br />
US Airways - - 2 - - 69 - 1.0 1.0 - 0.3 0.7<br />
Subtotal 4 12 14 178 790 874 2.0 2.3 3.0 3.0 3.0 4.0<br />
Total 582 630 726 26,729 32,876 40,624 6.6 6.8 44.0 53.0 58.0 61.0<br />
Note: PMAWD international operations and enplanements are higher than in the derivative forecasts.<br />
(a) Delta includes Northwest after 2008.<br />
(b) NBEG = Narrow-body equivalent gates<br />
(c) Gate needs are based on turns per gate as presented. Gate <strong>requirements</strong> are based on rounding of partial gates for<br />
key carriers.<br />
Source: Landrum & Brown analysis.<br />
SAN DIEGO INTERNATIONAL AIRPORT<br />
JACOBS CONSULTANCY TEAM<br />
DESTINATION LINDBERGH: THE ULTIMATE BUILD-OUT PAGE 4-20
Table 4-12<br />
MODAL SHARE AND VEHICLE OCCUPANCY<br />
<strong>San</strong> <strong>Diego</strong> <strong>International</strong> <strong>Airport</strong><br />
Mode<br />
Mode share (a)<br />
Vehicle occupancy (air<br />
passengers per vehicle)(a)<br />
PRIVATE VEHICLE<br />
Curbside 25.5% 1.2<br />
Short-Term Parking 17.0% 1.3<br />
Long-Term Parking 2.5% 1.3<br />
Remote Parking 10.0% 1.3<br />
RENTAL CAR 19.1% 1.4<br />
COMMERCIAL VEHCILE<br />
Taxi 7.3% 1.5<br />
Limousine 1.3% 1.5<br />
Shared-ride Shuttle 9.5% 4<br />
Hotel/Motel Courtesy Shuttle 5.8% 2.6<br />
Rental Car Courtesy Shuttle(b) -- 1.5<br />
Remote Parking Courtesy Shuttle(c) -- 1.8<br />
Public Transit 1.0% 5<br />
Charter/Other Bus 1.0% 15<br />
TOTAL 100.0%<br />
(a) Mode share and vehicle occupancy based on HNTB calibration.<br />
(b) Uses the same mode share percentage as remote parking.<br />
(c) Uses the same mode share percentage as rental car.<br />
Source: HNTB Analysis, 2008 SDIA Master Plan.<br />
4.4.2 Requirements<br />
Curbside, public parking, employee parking and rental car<br />
<strong>requirements</strong> are summarized in Table 4-13. In general, the<br />
<strong>Airport</strong> is significantly deficient in public parking spaces needed<br />
to meet current demand. Specifically, the current demand for<br />
daily and hourly parking is over 6,000 spaces, whereas only<br />
3,166 are provided.<br />
The rental car facilities located off of North Harbor Drive do not<br />
present a customer experience equivalent with the passenger<br />
terminal, and a consolidated rental car <strong>facility</strong> is recommended.<br />
SAN DIEGO INTERNATIONAL AIRPORT<br />
JACOBS CONSULTANCY TEAM<br />
DESTINATION LINDBERGH: THE ULTIMATE BUILD-OUT PAGE 4-21
Table 4-13<br />
GROUND TRANSPORTATION REQUIREMENTS<br />
<strong>San</strong> <strong>Diego</strong> <strong>International</strong> <strong>Airport</strong><br />
Current<br />
Facilities<br />
Current<br />
Requirements PAL1 PAL2<br />
CURBSIDE (feet)<br />
Private vehicle enplaning 1,670 1,530 1,630 1,840<br />
Private vehicle deplaning 1,590 1,460 1,650 1,745<br />
Commercial vehicle (multiple) 3,370 3,090 3,370 3,785<br />
Commercial vehicle (single) N/A N/A 1,800 2,065<br />
TOTAL CURBSIDE – SINGLE (a) 6,630 N/A 5,080 5,650<br />
TOTAL CURBSIDE – MULTIPLE N/A 6,080 6,650 7,370<br />
PUBLIC PARKING (spaces)<br />
Hourly N/A 1,270 1,705 2,245<br />
Daily N/A 4,740 6,705 8,290<br />
Subtotal hourly/daily parking 3,166 6,010 8,410 10,535<br />
Remote 9,287 5,610 7,940 9,815<br />
TOTAL PUBLIC PARKING 12,447 11,623 16,350 20,350<br />
EMPLOYEE PARKING (spaces) 1,595 1,450 2,000 2,500<br />
RENTAL CAR<br />
Ready/return spaces (ea) N/A 2,550 2,775 3,525<br />
Storage spaces (ea) N/A 1,000 1,110 1,400<br />
Support facilities N/A 8.0 9.0 11.5<br />
Customer service N/A 0.9 1.0 1.4<br />
Landscaping and circulation N/A 4.7 5.2 6.7<br />
Subtotal rental car (b)<br />
27.0 acres<br />
38.2 42.0 53.4<br />
(on site only)<br />
N/A = not applicable<br />
(a) Curbside <strong>requirements</strong> differ depending on the terminal configuration. With a single terminal, some<br />
efficiencies are gained, and therefore, the curbside requirement is less for a single terminal alternative<br />
versus a multiple terminal layout.<br />
(b) Existing space does not include Pacific Highway facilities; <strong>requirements</strong> assume all facilities are on site.<br />
Source: HNTB analysis, 2008 SDIA Master Plan.<br />
4.4.3 Terminal Curbside<br />
Curb length <strong>requirements</strong> for each vehicle mode were estimated<br />
by vehicle type. The analysis was conducted for peak hour<br />
operations during a peak month average day at the <strong>Airport</strong>. To<br />
account for the random pattern of vehicle arrivals during the<br />
peak hour a surge factor of 1.1 was applied. Peak hour vehicle<br />
SAN DIEGO INTERNATIONAL AIRPORT<br />
JACOBS CONSULTANCY TEAM<br />
DESTINATION LINDBERGH: THE ULTIMATE BUILD-OUT PAGE 4-22
volumes were estimated using the mode share and vehicle<br />
occupancies shown in Table 4-12.<br />
The curb length requirement for each mode was then estimated<br />
by multiplying the required number of stalls by the average<br />
vehicle parking length, and by the number of stops the mode is<br />
expected to make along the curb.<br />
Approximately five percent of parking and rental car traffic was<br />
assumed to use the curbs based on past air passenger surveys at<br />
SDIA. Approximately 30 percent of deplaning private vehicles<br />
were assumed to re-circulate based on the mode share<br />
calibration.<br />
It was also assumed that during the peak hour, a LOS C would<br />
be acceptable for operations on the private vehicle curbside. At<br />
LOS C, approximately 30 percent of the vehicles would doublepark<br />
when loading or unloading passengers, either within a 20<br />
foot striped curb lane or in the first travel lane if the curb lane is<br />
12-feet or less. No double parking was assumed on the<br />
commercial vehicle curbside.<br />
Table 4-13 summarizes the projected curbside <strong>requirements</strong> for<br />
PAL1 and PAL2. As shown, the PAL1 curbside requirement for<br />
a multiple terminal configuration is 6,650 feet; and the PAL2<br />
requirement is 7,370 feet. For a single consolidated terminal<br />
layout, the curbside <strong>requirements</strong> are lessened: for PAL1 5,080<br />
feet and PAL2 at 5,650 feet.<br />
4.4.4 Public Parking<br />
Parking stall <strong>requirements</strong> for hourly, daily and remote parking<br />
were estimated by applying average parking durations from<br />
parking transactions data. Parking durations as reported by<br />
Lindbergh Parking Incorporated (LPi) and Authority staff are as<br />
follows:<br />
• Hourly Parking – 1.24 hours<br />
• Daily Parking – 1.76 days<br />
• Remote Parking – 2.5 days<br />
Hourly parking demand is based on peak hour demand, and<br />
daily, and remote parking demand is based on a peak day. As<br />
mentioned, the peak day represents an average day in the peak<br />
month and does not account for holiday demand. The parking<br />
<strong>requirements</strong> include parking reserves of 15 percent for short-<br />
SAN DIEGO INTERNATIONAL AIRPORT<br />
JACOBS CONSULTANCY TEAM<br />
DESTINATION LINDBERGH: THE ULTIMATE BUILD-OUT PAGE 4-23
Nearly 80 percent of<br />
total parking<br />
transactions at SDIA<br />
occur at the short-term<br />
parking facilities.<br />
term and 10 percent for long-term and remote parking. In<br />
addition, a surge factor to account for the random pattern of<br />
vehicle arrivals throughout the peak hour was applied.<br />
Hourly and daily parking demand represents the demand for<br />
terminal area parking facilities that permit walking to the<br />
terminals while remote parking requires a shuttle to the<br />
terminals.<br />
The estimated parking transaction ratio was assumed to remain<br />
constant during the peak month of airport activity. SDIA<br />
parking transaction data indicated the following distribution:<br />
78 percent short-term terminal parking, 12 percent long-term<br />
terminal parking, and 10 percent remote parking.<br />
Parking <strong>requirements</strong> were estimated by type of parking (i.e.,<br />
close-in versus remote) based on the projected parking<br />
transactions and the average parking durations for each type.<br />
The <strong>requirements</strong> represent all public parking demand including<br />
the demand currently accommodated by private operators.<br />
Table 4-13 shows the estimated parking <strong>requirements</strong> for hourly,<br />
daily, and remote facilities.<br />
As mentioned, the current demand far exceeds the existing<br />
provision of daily/hourly parking. Today, only 3,166 spaces are<br />
provided, whereas there is demand for over 6,000. Further,<br />
hourly/daily parking demand is expected to continue to grow<br />
reaching 16,350 spaces at PAL1, and 20,350 in PAL2.<br />
4.4.5 Employee Parking<br />
Employee parking <strong>requirements</strong> were estimated based on the<br />
ratio of existing employee parking supply to the annual<br />
passenger activity level at SDIA, adjusted for observed parking<br />
occupancies. There are currently 1,595 employee parking spaces<br />
at SDIA and when parking lot surveys were conducted in 2004<br />
there were approximately 96 employee parking spaces per<br />
million annual passengers (MAP) with average peak hour<br />
occupancies of 65 percent. It was determined that a 40 percent<br />
reserve of parking spaces be maintained in the employee lots to<br />
accommodate employees working on shifts. For example,<br />
second shift employees must arrive at work before first shift<br />
employees have completed their shift requiring an overlap in<br />
parking spaces. Employee parking demand is expected to grow<br />
SAN DIEGO INTERNATIONAL AIRPORT<br />
JACOBS CONSULTANCY TEAM<br />
DESTINATION LINDBERGH: THE ULTIMATE BUILD-OUT PAGE 4-24
Rental car <strong>requirements</strong><br />
assume that a<br />
consolidated rental car<br />
<strong>facility</strong> meeting 100<br />
percent of projected<br />
demand will be<br />
constructed.<br />
in proportion to total airport passengers and reach 2,000 spaces<br />
in PAL1 and 2,500 spaces in PAL2 as shown on Table 4-13.<br />
4.4.6 Rental Car<br />
Rental car acreage <strong>requirements</strong> were estimated using acreage<br />
ratios observed at SDIA and other airports in the western United<br />
States as well as surveys of SDIA rental car operators conducted<br />
in 1997 and 2007. These <strong>requirements</strong> were refined as part of a<br />
rental car programming effort prepared for the Authority by<br />
Demattei Won Architecture. The existing rental car facilities<br />
located south of North Harbor Drive occupy approximately<br />
27.5 acres and are comprised of 3 companies: Hertz, Avis and<br />
National. Additional companies are located along Pacific<br />
Highway. Future acreage <strong>requirements</strong> were estimated for a<br />
consolidated rental car <strong>facility</strong> that accommodated 100 percent of<br />
rental car demand including both North Harbor Drive and<br />
Pacific Highway facilities.<br />
The following assumptions and ratios were used to estimate<br />
rental car stall <strong>requirements</strong>:<br />
Ready/return spaces<br />
• Assumes flex spaces accommodating both ready and<br />
return functions<br />
• 335 square feet per space<br />
Storage spaces<br />
• 40 percent of ready/return spaces<br />
• 210 square feet per space<br />
Support facilities (quick turnaround)<br />
• Fueling<br />
• Car wash<br />
• Vehicle stacking space<br />
Customer service lobby<br />
• Rental car counters and lobby area<br />
• Building support<br />
• Employee office space and building support<br />
Landscaping and circulation<br />
• 10 percent landscaping buffer per design standards<br />
• 5 percent of total site for circulation<br />
SAN DIEGO INTERNATIONAL AIRPORT<br />
JACOBS CONSULTANCY TEAM<br />
DESTINATION LINDBERGH: THE ULTIMATE BUILD-OUT PAGE 4-25
Table 4-13 summarizes rental car stall and area <strong>requirements</strong>.<br />
The total area required for rental car operations was estimated to<br />
be 42.0 acres in PAL1 and 53.4 acres in PAL2. Rental car support<br />
functions including quick-turn-around (fueling, washing, et<br />
cetera) and customer service counters were estimated to require<br />
10.0 acres.<br />
4.4.7 Intermodal Context and Opportunities<br />
I-5 and the Coaster/Amtrak and trolley rail corridors run along<br />
the north side of the <strong>Airport</strong> providing an opportunity for<br />
connectivity to airport terminal and gate facilities. In addition,<br />
an Intermodal Transit Center (ITC) in the vicinity of the <strong>Airport</strong><br />
could serve as a larger regional transportation hub providing<br />
interconnectivity between regional transit lines including trolley,<br />
Coaster, Amtrak, local buses, and proposed bus rapid transit.<br />
The <strong>facility</strong> could also be designed to accommodate a potential<br />
High Speed Rail station and serve as the <strong>San</strong> <strong>Diego</strong> terminus for<br />
both High Speed Rail and Amtrak service. This <strong>facility</strong> could<br />
also provide parking and rental car facilities that cannot be<br />
accommodated at the <strong>San</strong>ta Fe Depot due to site constraints<br />
downtown.<br />
As an airport rail station, the ITC could provide a combination of<br />
air passenger facilities including: ticketing, baggage claim and<br />
passenger security. The ITC and air passenger amenities would<br />
be located on or adjacent to airport property near the north<br />
property line. Passengers would travel to the terminal<br />
concourses either by moving walkways if terminal concourses<br />
are provided north of the runway or with a people mover to<br />
terminal concourses south of the runway. As a larger regional<br />
transportation hub the ITC could provide: rail platforms with<br />
easy connections between modes; a rail station with ticket<br />
facilities and passenger waiting areas; and a bus plaza serving<br />
regional and local bus lines.<br />
In addition, the 2030 Regional Transportation Plan calls for all<br />
three trolley routes (blue, green and orange) to operate in the<br />
corridor between Old Town and <strong>San</strong>ta Fe Depot by 2030. The<br />
associated improvements to the corridor would allow a<br />
connection to the ITC from all trolley routes in the County<br />
providing passengers with a “one-seat ride” to the ITC.<br />
SAN DIEGO INTERNATIONAL AIRPORT<br />
JACOBS CONSULTANCY TEAM<br />
DESTINATION LINDBERGH: THE ULTIMATE BUILD-OUT PAGE 4-26
4.5 Support Facilities Requirements<br />
The following sections present the <strong>facility</strong> <strong>requirements</strong> for air<br />
cargo and general aviation facilities.<br />
4.5.1 Air Cargo Requirements<br />
The inventory task established that there currently is<br />
69,750 square feet of office and building space designated for air<br />
cargo operations. The future <strong>facility</strong> <strong>requirements</strong> were<br />
calculated based on a range of building utilization rates, from<br />
0.75 to 1.25 square feet per ton of cargo handled. Industry<br />
planning standards typically assume a building utilization rate<br />
of 1.5 square feet per ton of cargo, but the ratio for SDIA was<br />
adjusted downward as a result of the historically higher building<br />
utilization rate at the <strong>Airport</strong>. It was also assumed that efficiency<br />
will increase over the planning period due to the increased use<br />
of mechanization technology.<br />
The aircraft parking <strong>requirements</strong> were derived based on<br />
projections of number of aircraft operations on the peak month<br />
average week day. Apron <strong>requirements</strong> were calculated based<br />
on the parking position <strong>requirements</strong>, assuming that an air<br />
carrier aircraft (e.g., Boeing 757) requires 40,000 square feet of<br />
apron and a feeder aircraft (e.g., Cessna Caravan) requires<br />
15,000 square feet of apron.<br />
The results of the analysis are presented in Table 4-14.<br />
SAN DIEGO INTERNATIONAL AIRPORT<br />
JACOBS CONSULTANCY TEAM<br />
DESTINATION LINDBERGH: THE ULTIMATE BUILD-OUT PAGE 4-27
Table 4-14<br />
CARGO FACILITY REQUIREMENTS<br />
<strong>San</strong> <strong>Diego</strong> <strong>International</strong> <strong>Airport</strong><br />
Current<br />
facilities<br />
Existing<br />
<strong>requirements</strong> PAL1 PAL2<br />
Air cargo demand (a)<br />
Cargo tonnage 154,689 - 188,200 225,600<br />
Cargo operations 6,682 - 7,070 7,840<br />
Requirements<br />
Warehouse (sf) (b)<br />
116,020 - 141,150 - 169,200 -<br />
69,750 193,360 235,250 282,000<br />
Apron (sf) 270,000 - 1,055,000 1,230,000<br />
Aircraft parking positions<br />
Air carrier - - 23 27<br />
Feeder - - 9 10<br />
Total - - 32 37<br />
(a) Cargo demand was calculated based on a constrained growth forecast scenario.<br />
(b) Warehouse <strong>requirements</strong> were based on a range of building utilization rates, from<br />
0.75 to 1.25 square feet per ton of cargo handled.<br />
Source: Jacobs Consultancy and C&S Engineers analysis.<br />
Based on this analysis, the available warehouse space is below<br />
the square footage needed to meet current and future <strong>requirements</strong>.<br />
As a result of the current lack of available building space<br />
dedicated to aircraft cargo, cargo operators FedEx, UPS, and the<br />
United States Postal Service sort and load containers off airport<br />
property.<br />
The available apron space dedicated to air cargo would also have<br />
to increase to meet future demand, from 270,000 square feet to<br />
approximately 1.05 million square feet at PAL1 and 1.23 million<br />
square feet at PAL2.<br />
4.5.2 General Aviation Requirements<br />
The general aviation (GA) area currently consists of<br />
approximately 10 acres of apron space, including a 23,538 square<br />
foot terminal building, a 40,200 square foot hangar <strong>facility</strong>, and a<br />
fuel farm that encompasses 0.4 acres of the GA apron area. In<br />
addition, the cargo airline ABX currently leases a portion of the<br />
apron area for cargo-related operations.<br />
The GA <strong>requirements</strong> are based on the constrained aviation<br />
forecast, which assumes that general aviation activity will not<br />
SAN DIEGO INTERNATIONAL AIRPORT<br />
JACOBS CONSULTANCY TEAM<br />
DESTINATION LINDBERGH: THE ULTIMATE BUILD-OUT PAGE 4-28
grow at SDIA over the planning period. Since current facilities<br />
meet the needs generated by GA activity, there is no anticipated<br />
need for additional facilities. Therefore, no additional space is<br />
programmed for GA. However, the GA <strong>facility</strong> improvements<br />
will likely be necessary over the planning period, and facilities<br />
may be reconfigured or relocated as prudent.<br />
4.6 Summary of Requirements<br />
A summary of the <strong>facility</strong> <strong>requirements</strong> for PAL1 and PAL2 for<br />
each of the key airport functions is shown in Table 4-15.<br />
Table 4-15<br />
SUMMARY OF EXISTING FACILITIES AND FUTURE REQUIREMENTS<br />
<strong>San</strong> <strong>Diego</strong> <strong>International</strong> <strong>Airport</strong><br />
Planning Activity Level<br />
Function<br />
Facility<br />
Current<br />
Facilities PAL1 PAL2<br />
Airfield Airfield design criteria ADG V ADG V ADG V<br />
Runway length (ft) 9,401 9,401 9,401<br />
Commercial aviation Passenger terminal building (sf) 787,425 1,406,057 1,720,774<br />
Aircraft gates 44 53 61<br />
Terminal curbside frontage 6,530 6,650 7,370<br />
Vehicle parking<br />
Public parking (spaces) 12,447 16,350 20,350<br />
Employee parking (spaces) 1,595 2,000 2,500<br />
Rental car (ac) 27 42.0 53.4<br />
Air cargo Cargo warehouse (sf) 69,750 141,150 -<br />
235,250<br />
169,200 -<br />
282,000<br />
Aircraft parking apron (sf) 270,000 1,055,000 1,230,000<br />
General aviation FBO terminal building (sf) 23,538 23,538 23,538<br />
Apron (sf) 435,600 435,600 435,600<br />
Hangar space (sf) 40,200 40,200 40,200<br />
FBO = fixed based operator<br />
ILS = instrument landing system<br />
sf = square feet; ac = acre<br />
Source: Jacobs Consultancy Team, 2008.<br />
SAN DIEGO INTERNATIONAL AIRPORT<br />
JACOBS CONSULTANCY TEAM<br />
DESTINATION LINDBERGH: THE ULTIMATE BUILD-OUT PAGE 4-29


