

Learning in Affectively Intense Virtual Environments - LITE
Learning in Affectively Intense Virtual Environments - LITE
Learning in Affectively Intense Virtual Environments - LITE

Create successful ePaper yourself
Turn your PDF publications into a flip-book with our unique Google optimized e-Paper software.
26<br />
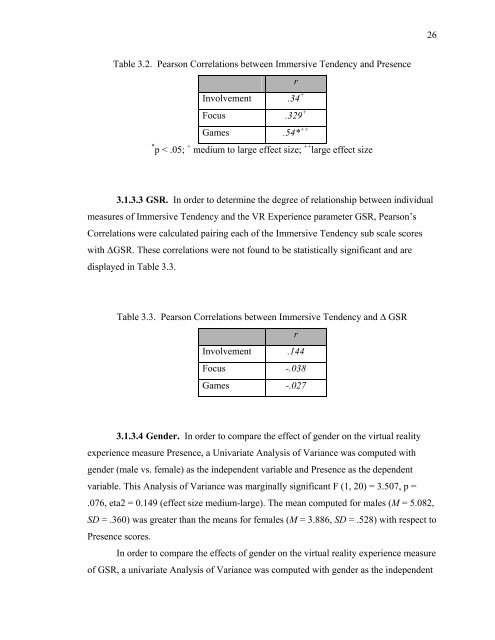
Table 3.2. Pearson Correlations between Immersive Tendency and Presence<br />
r<br />
Involvement .34 +<br />
Focus .329 +<br />
Games .54* ++<br />
* p < .05; + medium to large effect size; ++ large effect size<br />
3.1.3.3 GSR. In order to determ<strong>in</strong>e the degree of relationship between <strong>in</strong>dividual<br />
measures of Immersive Tendency and the VR Experience parameter GSR, Pearson’s<br />
Correlations were calculated pair<strong>in</strong>g each of the Immersive Tendency sub scale scores<br />
with ∆GSR. These correlations were not found to be statistically significant and are<br />
displayed <strong>in</strong> Table 3.3.<br />
Table 3.3. Pearson Correlations between Immersive Tendency and ∆ GSR<br />
r<br />
Involvement .144<br />
Focus -.038<br />
Games -.027<br />
3.1.3.4 Gender. In order to compare the effect of gender on the virtual reality<br />
experience measure Presence, a Univariate Analysis of Variance was computed with<br />
gender (male vs. female) as the <strong>in</strong>dependent variable and Presence as the dependent<br />
variable. This Analysis of Variance was marg<strong>in</strong>ally significant F (1, 20) = 3.507, p =<br />
.076, eta2 = 0.149 (effect size medium-large). The mean computed for males (M = 5.082,<br />
SD = .360) was greater than the means for females (M = 3.886, SD = .528) with respect to<br />
Presence scores.<br />
In order to compare the effects of gender on the virtual reality experience measure<br />
of GSR, a univariate Analysis of Variance was computed with gender as the <strong>in</strong>dependent