Jpmorgan Funds - Fundsupermart.com
Jpmorgan Funds - Fundsupermart.com
Jpmorgan Funds - Fundsupermart.com

Create successful ePaper yourself
Turn your PDF publications into a flip-book with our unique Google optimized e-Paper software.
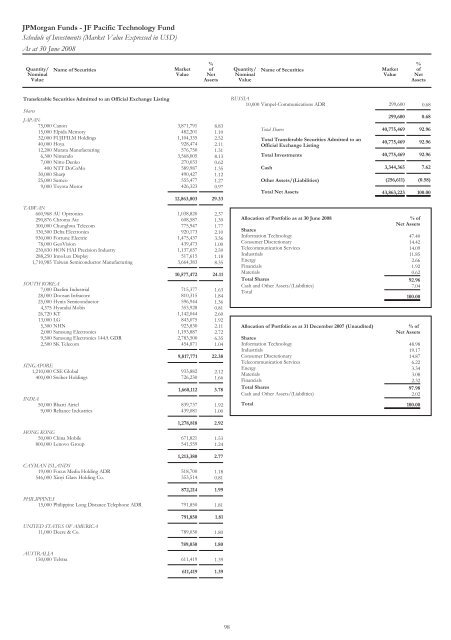
JPMorgan <strong>Funds</strong> - JF Pacific Technology Fund<br />
Schedule of Investments (Market Value Expressed in USD)<br />
As at 30 June 2008<br />
Quantity/<br />
Nominal<br />
Value<br />
Name of Securities<br />
Market<br />
Value<br />
% of<br />
Net<br />
Assets<br />
Transferable Securities Admitted to an Official Exchange Listing<br />
Shares<br />
JAPAN<br />
75,000 Canon 3,871,791 8.83<br />
15,000 Elpida Memory 482,201 1.10<br />
32,000 FUJIFILM Holdings 1,104,335 2.52<br />
40,000 Hoya 928,474 2.11<br />
12,200 Murata Manufacturing 576,750 1.31<br />
6,300 Nintendo 3,568,005 8.13<br />
7,000 Nitto Denko 270,033 0.62<br />
400 NTT DoCoMo 589,987 1.35<br />
30,000 Sharp 490,427 1.12<br />
25,000 Sumco 555,477 1.27<br />
9,000 Toyota Motor 426,323 0.97<br />
12,863,803 29.33<br />
TAIWAN<br />
660,968 AU Optronics 1,038,820 2.37<br />
290,876 Chroma Ate 608,587 1.39<br />
300,000 Chunghwa Tele<strong>com</strong> 775,947 1.77<br />
330,500 Delta Electronics 920,173 2.10<br />
930,000 Fortune Electric 1,475,437 3.36<br />
78,000 GeoVision 439,473 1.00<br />
230,830 HON HAI Precision Industry 1,137,037 2.59<br />
288,250 InnoLux Display 517,615 1.18<br />
1,710,985 Taiwan Semiconductor Manufacturing 3,664,383 8.35<br />
10,577,472 24.11<br />
SOUTH KOREA<br />
7,000 Daelim Industrial 715,377 1.63<br />
28,000 Doosan Infracore 810,315 1.84<br />
25,000 Hynix Semiconductor 596,944 1.36<br />
4,375 Hyundai Mobis 353,928 0.81<br />
26,720 KT 1,142,044 2.60<br />
13,000 LG 843,075 1.92<br />
5,300 NHN 923,830 2.11<br />
2,000 Samsung Electronics 1,193,887 2.72<br />
9,500 Samsung Electronics 144AGDR 2,783,500 6.35<br />
2,500 SK Tele<strong>com</strong> 454,871 1.04<br />
9,817,771 22.38<br />
SINGAPORE<br />
1,210,000 CSE Global 933,882 2.12<br />
400,000 Swiber Holdings 726,230 1.66<br />
1,660,112 3.78<br />
INDIA<br />
50,000 Bharti Airtel 839,737 1.92<br />
9,000 Reliance Industries 439,081 1.00<br />
1,278,818 2.92<br />
HONG KONG<br />
50,000 China Mobile 671,821 1.53<br />
800,000 Lenovo Group 541,559 1.24<br />
1,213,380 2.77<br />
CAYMAN ISLANDS<br />
19,000 Focus Media Holding ADR 518,700 1.18<br />
546,000 Xinyi Glass Holding Co. 353,514 0.81<br />
872,214 1.99<br />
PHILIPPINES<br />
15,000 Philippine Long Distance Telephone ADR 791,850 1.81<br />
791,850 1.81<br />
UNITED STATES OFAMERICA<br />
11,000 Deere & Co. 789,030 1.80<br />
789,030 1.80<br />
AUSTRALIA<br />
150,000 Telstra 611,419 1.39<br />
611,419 1.39<br />
98<br />
Quantity/<br />
Nominal<br />
Value<br />
Name of Securities<br />
Market<br />
Value<br />
% of<br />
Net<br />
Assets<br />
RUSSIA<br />
10,000 Vimpel-Communications ADR 299,600 0.68<br />
299,600 0.68<br />
Total Shares 40,775,469 92.96<br />
Total Transferable Securities Admitted to an<br />
Official Exchange Listing<br />
40,775,469 92.96<br />
Total Investments 40,775,469 92.96<br />
Cash 3,344,365 7.62<br />
Other Assets/(Liabilities) (256,611) (0.58)<br />
Total Net Assets 43,863,223 100.00<br />
Allocation of Portfolio as at 30 June 2008 % of<br />
Net Assets<br />
Shares<br />
Information Technology 47.40<br />
Consumer Discretionary 14.42<br />
Tele<strong>com</strong>munication Services 14.09<br />
Industrials 11.85<br />
Energy 2.66<br />
Financials 1.92<br />
Materials 0.62<br />
Total Shares 92.96<br />
Cash and Other Assets/(Liabilities) 7.04<br />
Total<br />
100.00<br />
Allocation of Portfolio as at 31 December 2007 (Unaudited)<br />
Shares<br />
% of<br />
Net Assets<br />
Information Technology 48.98<br />
Industrials 19.17<br />
Consumer Discretionary 14.87<br />
Tele<strong>com</strong>munication Services 6.22<br />
Energy 3.34<br />
Materials 3.08<br />
Financials 2.32<br />
Total Shares 97.98<br />
Cash and Other Assets/(Liabilities) 2.02<br />
Total 100.00