Jpmorgan Funds - Fundsupermart.com
Jpmorgan Funds - Fundsupermart.com
Jpmorgan Funds - Fundsupermart.com

Create successful ePaper yourself
Turn your PDF publications into a flip-book with our unique Google optimized e-Paper software.
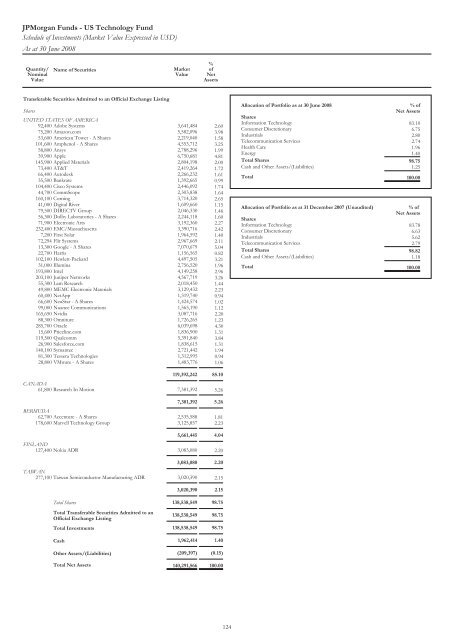
JPMorgan <strong>Funds</strong> - US Technology Fund<br />
Schedule of Investments (Market Value Expressed in USD)<br />
As at 30 June 2008<br />
Quantity/<br />
Nominal<br />
Value<br />
Name of Securities<br />
Market<br />
Value<br />
% of<br />
Net<br />
Assets<br />
Transferable Securities Admitted to an Official Exchange Listing<br />
Shares<br />
UNITED STATES OFAMERICA<br />
92,400 Adobe Systems 3,641,484 2.60<br />
75,200 Amazon.<strong>com</strong> 5,582,096 3.98<br />
53,600 American Tower - A Shares 2,219,040 1.58<br />
101,600 Amphenol - A Shares 4,553,712 3.25<br />
58,800 Ansys 2,788,296 1.99<br />
39,900 Apple 6,750,681 4.81<br />
145,900 Applied Materials 2,804,198 2.00<br />
73,400 AT&T 2,419,264 1.72<br />
66,400 Autodesk 2,266,232 1.61<br />
35,500 Bankrate 1,392,665 0.99<br />
104,400 Cisco Systems 2,446,092 1.74<br />
44,700 CommScope 2,303,838 1.64<br />
160,100 Corning 3,714,320 2.65<br />
41,000 Digital River 1,609,660 1.15<br />
79,500 DIRECTV Group 2,046,330 1.46<br />
56,300 Dolby Laboratories - AShares 2,244,118 1.60<br />
71,900 Electronic Arts 3,192,360 2.27<br />
232,400 EMC/Massachusetts 3,390,716 2.42<br />
7,200 First Solar 1,964,592 1.40<br />
72,294 Flir Systems 2,967,669 2.11<br />
13,300 Google - AShares 7,070,679 5.04<br />
22,700 Harris 1,156,565 0.82<br />
102,100 Hewlett-Packard 4,497,505 3.21<br />
31,000 Illumina 2,756,520 1.96<br />
193,800 Intel 4,149,258 2.96<br />
203,100 Juniper Networks 4,567,719 3.26<br />
55,300 Lam Research 2,018,450 1.44<br />
49,800 MEMC Electronic Materials 3,129,432 2.23<br />
60,400 NetApp 1,319,740 0.94<br />
66,600 NeuStar - AShares 1,424,574 1.02<br />
99,000 Nuance Communications 1,565,190 1.12<br />
165,650 Nvidia 3,087,716 2.20<br />
88,300 Omniture 1,726,265 1.23<br />
285,700 Oracle 6,039,698 4.30<br />
15,600 Priceline.<strong>com</strong> 1,836,900 1.31<br />
119,500 Qual<strong>com</strong>m 5,391,840 3.84<br />
26,900 Salesforce.<strong>com</strong> 1,838,615 1.31<br />
140,100 Symantec 2,721,442 1.94<br />
81,300 Tessera Technologies 1,312,995 0.94<br />
28,800 VMware - AShares 1,483,776 1.06<br />
119,392,242 85.10<br />
CANADA<br />
61,800 Research In Motion 7,381,392 5.26<br />
7,381,392 5.26<br />
BERMUDA<br />
62,700 Accenture - A Shares 2,535,588 1.81<br />
178,600 Marvell Technology Group 3,125,857 2.23<br />
5,661,445 4.04<br />
FINLAND<br />
127,400 Nokia ADR 3,083,080 2.20<br />
3,083,080 2.20<br />
TAIWAN<br />
277,100 Taiwan Semiconductor Manufacturing ADR 3,020,390 2.15<br />
3,020,390 2.15<br />
Total Shares 138,538,549 98.75<br />
Total Transferable Securities Admitted to an<br />
Official Exchange Listing<br />
138,538,549 98.75<br />
Total Investments 138,538,549 98.75<br />
Cash 1,962,414 1.40<br />
Other Assets/(Liabilities) (209,397) (0.15)<br />
Total Net Assets 140,291,566 100.00<br />
124<br />
Quantity/<br />
Nominal<br />
Value<br />
Name of Securities<br />
Market<br />
Value<br />
% of<br />
Net<br />
Assets<br />
Allocation of Portfolio as at 30 June 2008<br />
Shares<br />
% of<br />
Net Assets<br />
Information Technology 83.10<br />
Consumer Discretionary 6.75<br />
Industrials 2.80<br />
Tele<strong>com</strong>munication Services 2.74<br />
Health Care 1.96<br />
Energy 1.40<br />
Total Shares 98.75<br />
Cash and Other Assets/(Liabilities) 1.25<br />
Total 100.00<br />
Allocation of Portfolio as at 31 December 2007 (Unaudited)<br />
Shares<br />
% of<br />
Net Assets<br />
Information Technology 83.78<br />
Consumer Discretionary 6.63<br />
Industrials 5.62<br />
Tele<strong>com</strong>munication Services 2.79<br />
Total Shares 98.82<br />
Cash and Other Assets/(Liabilities) 1.18<br />
Total 100.00