JPMorgan <strong>Funds</strong> - Europe Equity Fund Schedule of Investments (Market Value Expressed in EUR) (continued) As at 31 December 2007 Quantity/ Nominal Value Name of Securities Maturity/ Coupon Market Value % of Net Assets 72,781 Gruppo Coin 399,932 0.01 314,803 IFI-Istituto Finanziario Industriale preference Shares 7,246,765 0.21 8,464,057 Intesa Sanpaolo 45,790,548 1.30 391,237 Prysmian 6,541,483 0.19 414,546 Recordati 2,528,731 0.07 25,620 Reply 563,640 0.02 857,055 Saras 3,391,795 0.10 305,481 Screen Service Broadcasting Technologies 403,235 0.01 49,549 Trevi Finanziaria 603,507 0.02 4,018,203 UniCredito Italiano 22,783,211 0.65 85 Quantity/ Nominal Value Name of Securities Maturity/ Coupon 643,100 Galp Energia - B Shares 12,212,469 0.35 2,550,000 Portugal Tele<strong>com</strong> Registered Shares 23,052,000 0.66 429,949 Teixeira Duarte - Engenharia Construcoes 885,695 0.03 58,807,696 1.68 DENMARK 289,228 D/S Norden 22,027,339 0.63 174,300 D/S Torm 4,195,031 0.12 34,561 FLSmidth & Co. 2,405,066 0.07 436,661 Novo Nordisk - B Shares 19,496,740 0.55 265,461 Sydbank 7,777,241 0.22 295,524,108 8.40 55,901,417 1.59 SWITZERLAND 506,184 ABB Registered Shares 16,877 Baloise Holding Registered Shares 21,613 Bucher Industries Registered Shares 1,385,184 Crédit Suisse Group 9,982,811 1,134,554 3,482,608 56,864,220 0.28 0.03 0.10 1.62 LUXEMBOURG 430,522 ArcelorMittal 14,884 Orco Property Group 256,485 Oriflame Cosmetics SDR 22,718,646 1,211,409 11,399,650 0.65 0.03 0.32 170 Lindt & Sprüngli Registered Shares 9,847 Medisize Holding 4,111,499 455,545 0.12 0.01 35,329,705 1.00 30,760 Meyer Burger Technology 59,428 Nestlé Registered Shares 208,144 Roche Holding - Genussschein 7,708,066 18,686,475 24,361,412 0.22 0.53 0.69 GREECE 1,874,075 Alapis Holding Industrial and Commercial SA of Pharmaceutical Chemical & Organisation 4,366,595 0.13 7,467 Sika - Bearer Shares 9,400,657 0.27 38,935 Fourlis 1,023,990 0.03 185,094 Sonova Holding Registered Shares 14,182,252 0.40 36,571 I Kloukinas-I Lappas 314,511 0.01 20,046 Swatch Group - Bearer Shares 4,138,767 0.12 251,008 Marfin Financial Group Holdings 1,475,927 0.04 1,184,768 Swiss Reinsurance Registered Shares 57,272,233 1.63 59,993 Michaniki 328,762 0.01 42,464 Zurich Financial Services 8,485,894 0.24 312,143 Neochimiki LV Lavrentiadis 6,436,389 0.18 486,011 Piraeus Bank 12,976,494 0.37 220,266,993 6.26 34,008 Sarantis 476,112 0.01 NETHERLANDS 6 Sprider Stores 30 0.00 170,058 Bateman Litwin 218,968 DSM 431,191 7,057,339 0.01 0.20 27,398,810 0.78 57,095 Fugro - CVA 2,986,068 0.08 AUSTRIA 217,690 Imtech 3,637,600 0.10 52,204 Schoeller-Bleckmann Oilfield Equipment 3,208,980 0.09 1,240,645 ING Groep - CVA 33,224,473 0.94 479,581 Voestalpine 23,763,239 0.68 3,685,463 Royal Dutch Shell - A shares 106,350,736 3.02 568,836 Royal Dutch Shell - B Shares 16,204,815 0.46 26,972,219 0.77 645,508 Royal KPN 54,460 Smit Internationale 285,478 TomTom 8,055,940 3,708,181 14,753,503 0.23 0.12 0.42 CYPRUS 1,129,881 Marfin Popular Bank Public 10,349,710 0.29 196,409,846 5.58 10,349,710 0.29 BELGIUM 48,241 Ackermans & Van Haaren 3,208,026 0.09 NORWAY 693,051 DnB NOR 7,224,600 0.21 25,318 Arseus - Warrants 43,040 Arseus (Strip) 28.01.11 20,508 430 0.00 0.00 7,224,600 0.21 1,013,423 Belga<strong>com</strong> 34,121,952 0.97 IRELAND 114,824 Compagnie Maritime Belge 6,757,392 0.19 256,271 Paddy Power 5,867,996 0.16 177,706 Delhaize Group 10,504,202 0.30 145,607 United Drug 576,604 0.02 85,030 Dexia (Strip) 850 0.00 9,310 D’ieteren 2,257,861 0.06 6,444,600 0.18 1,901,264 Fortis 799,602 InBev 615,791 KBC Groep 72,139 Tessenderlo Chemie 19,013 45,609,298 59,276,042 2,425,313 0.00 1.30 1.69 0.07 ISLE OF MAN 98,272 Eros International 397,903 Lamprell 532,326 2,314,544 0.02 0.06 164,200,887 4.67 2,846,870 0.08 FINLAND Total Shares and Warrants 3,508,491,254 99.70 36,782 Alma Media 108,334 Cramo - B Shares 859,859 Metso 428,510 1,869,845 32,184,522 0.01 0.05 0.91 Total Transferable Securities Admitted to an Official Exchange Listing 3,508,491,254 99.70 3,989,290 Nokia 285,000 OKO Bank - A Shares 105,636,399 3,762,000 3.00 0.11 Transferable Securities Dealt in on Another Regulated Market 260,969 Orion - B Shares 299,990 Ramirent 4,243,356 3,374,887 0.12 0.10 Investment <strong>Funds</strong> LUXEMBOURG SWEDEN 151,499,519 4.30 24,700,000 JPMorgan Liquidity <strong>Funds</strong> - Euro Liquidity Fund (JPM Euro Liquidity X (dist.)) 24,700,000 0.70 26,459 Angpanneforeningen - B Shares 370,216 Betsson 470,395 3,271,312 0.01 0.10 24,700,000 0.70 126,395 HIQ International 52,458 KappAhl Holding 446,742 457,979 0.01 0.01 Total Investment <strong>Funds</strong> 24,700,000 0.70 728,963 Kinnevik Investment 73,292 KNOW IT 11,262,598 469,237 0.32 0.01 Total Transferable Securities Dealt in on Another Regulated Market 24,700,000 0.70 87,049 Peab 2,016,122 SKF - B Shares 610,281 23,415,400 0.02 0.67 Total Investments 3,533,191,254 100.40 4,940,014 Volvo - B Shares 56,981,638 1.62 Bank Overdraft (543,332) (0.02) PORTUGAL 97,385,582 2.77 Other Assets/(Liabilities) (13,489,806) (0.38) 1,587,917 Banco BPI Registered Shares 932,451 Banco Espirito Santo Registered Shares 8,558,873 14,098,659 0.24 0.40 Total Net Assets 3,519,158,116 100.00 Market Value % of Net Assets
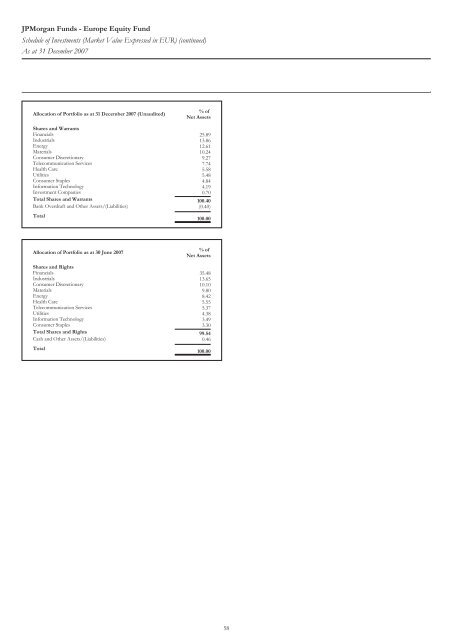
JPMorgan <strong>Funds</strong> - Europe Equity Fund Schedule of Investments (Market Value Expressed in EUR) (continued) As at 31 December 2007 Quantity/ Nominal Value Name of Securities Maturity/ Coupon Market Value % of Net Assets Allocation of Portfolio as at 31 December 2007 (Unaudited) Shares and Warrants %of Net Assets Financials 25.89 Industrials 13.86 Energy 12.61 Materials 10.24 Consumer Discretionary 9.27 Tele<strong>com</strong>munication Services 7.74 Health Care 5.58 Utilities 5.48 Consumer Staples 4.84 Information Technology 4.19 Investment Companies 0.70 Total Shares and Warrants 100.40 Bank Overdraft and Other Assets/(Liabilities) (0.40) Total 100.00 Allocation of Portfolio as at 30 June 2007 Shares and Rights %of Net Assets Financials 35.48 Industrials 13.65 Consumer Discretionary 10.10 Materials 9.80 Energy 8.42 Health Care 5.55 Tele<strong>com</strong>munication Services 5.37 Utilities 4.38 Information Technology 3.49 Consumer Staples 3.30 Total Shares and Rights 99.54 Cash and Other Assets/(Liabilities) 0.46 Total 100.00 86 Quantity/ Nominal Value Name of Securities Maturity/ Coupon Market Value % of Net Assets