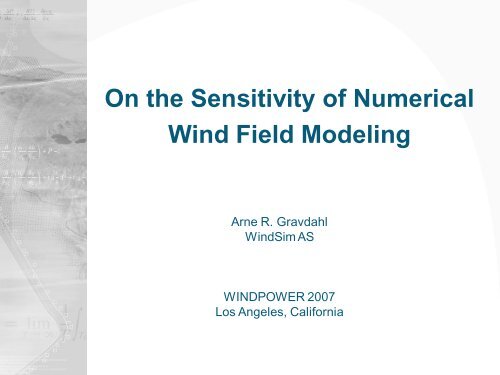
On the Sensitivity of Numerical Wind Field Modeling - WindSim
On the Sensitivity of Numerical Wind Field Modeling - WindSim
On the Sensitivity of Numerical Wind Field Modeling - WindSim

You also want an ePaper? Increase the reach of your titles
YUMPU automatically turns print PDFs into web optimized ePapers that Google loves.
<strong>On</strong> <strong>the</strong> <strong>Sensitivity</strong> <strong>of</strong> <strong>Numerical</strong><br />
<strong>Wind</strong> <strong>Field</strong> <strong>Modeling</strong><br />
Arne R. Gravdahl<br />
<strong>Wind</strong>Sim AS<br />
WINDPOWER 2007<br />
Los Angeles, California
Content<br />
<strong>Wind</strong>Sim AS<br />
Variation in Annual Energy Production, AEP<br />
Parameter sensitivities in <strong>the</strong> AEP calculation<br />
Conclusion<br />
Pre-processing<br />
Processing, Simulations<br />
- Cosine hill<br />
Post-processing<br />
- Ridge
<strong>Wind</strong>Sim AS<br />
1993 VECTOR AS; CFD consulting<br />
1993 Oil & Gas<br />
1997 <strong>Wind</strong> Energy<br />
– <strong>Wind</strong> resource assessment, Norwegian <strong>Wind</strong> Atlas<br />
– Micro-siting<br />
2003 <strong>Wind</strong>Sim, PC s<strong>of</strong>tware for simulation <strong>of</strong> local wind fields<br />
2005 VECTOR AS was divided in two companies<br />
– <strong>Wind</strong>Sim AS; Sale, support and development <strong>of</strong> <strong>Wind</strong>Sim<br />
– VECTOR AS; Consulting<br />
<strong>Wind</strong>Sim <strong>of</strong>fice: Jarlsø, 3124 Tønsberg, Norway
AEP – lower than estimated<br />
<strong>Wind</strong> farm owners frequently experience that <strong>the</strong> annual<br />
energy production (AEP) from <strong>the</strong>ir wind farms are lower than<br />
<strong>the</strong> estimated production.<br />
This serious problem is now addressed by <strong>the</strong> wind energy<br />
sector world wide.<br />
CFD simulations are used to get more accurate simulation<br />
results.<br />
What are <strong>the</strong> important lessons learned, what parameters<br />
affect <strong>the</strong> quality <strong>of</strong> results?
AEP variation within a wind farm<br />
Simple terrain - Denmark<br />
Complex terrain - Norway
Simple terrain<br />
Location: Torrild, Denmark, simple terrain<br />
<strong>Wind</strong> farm: 15 Bonus 150 kW turbines with 30 meters hub height,<br />
height variation within <strong>the</strong> wind farm is 6 meters<br />
Climatology: February to October 2000, measurement height 30<br />
meters, mean wind speed 5.6 m/s<br />
Models: Nesting, 20x20 km into 2x2 km with resolution 20x20<br />
meters, number <strong>of</strong> cells is 200 000<br />
Measurement station<br />
<strong>Wind</strong> turbines<br />
Digital terrain model with elevation in meters. Left side 20x20 km<br />
model, right side 2x2 km model with a 20x20 meters grid resolution
Simple terrain – Resources<br />
<strong>Wind</strong> resource map at 30 meters height<br />
There is no simple coincidence between high wind speed areas and high<br />
altitude areas. Simulations shows that areas west <strong>of</strong> <strong>the</strong> wind farm<br />
display <strong>the</strong> best wind conditions. This area has terrain gradients<br />
perpendicular to <strong>the</strong> main wind directions, giving significant speed-ups.
Simple terrain – AEP<br />
The difference in energy output between <strong>the</strong> various turbines is 25%.<br />
Wake effects is not included.
Simple terrain – Optimization<br />
Alternative locations<br />
along <strong>the</strong> grey lines<br />
would according to<br />
simulation give a 10%<br />
increase in AEP<br />
<strong>Wind</strong> resource map at 30 meters height<br />
Paper:<br />
Gravdahl A.R., Rorgemoen S., Thogersen M.,<br />
Power prediction and siting - When <strong>the</strong> terrain gets<br />
rough, The World <strong>Wind</strong> Energy Conference and<br />
Exhibition, Berlin, 2002.
AEP (MWh/y)<br />
Complex terrain – AEP<br />
Location:<br />
<strong>Wind</strong> farm:<br />
Norway, complex terrain<br />
2 MW turbines with 80 meters hub height, height<br />
variation within <strong>the</strong> wind farm is in <strong>the</strong> order <strong>of</strong> 100<br />
meters.<br />
9000<br />
8000<br />
7000<br />
6000<br />
5000<br />
4000<br />
3000<br />
2000<br />
1000<br />
0<br />
1 2 3 4 5 6 7 8 9 10 11 12 13 14 15 16 17 18 19 20<br />
Turbine<br />
Digital terrain model with elevation (m).<br />
Annual energy production based on<br />
simulations, AEP (MWh/y)<br />
The production varies between 8468 and 4356 MWh/y according to<br />
<strong>the</strong> simulations. The difference in energy output between <strong>the</strong> various<br />
turbines is in <strong>the</strong> order <strong>of</strong> 100%.
AEP variation within a wind farm<br />
Summary:<br />
Large variations within a wind farm in both simple and<br />
complex terrain.<br />
Next:<br />
Parameter sensitivities
AEP – Estimation procedure<br />
Pre-processing<br />
Post-processing<br />
Processing
Terrain conversion<br />
Conversion from contour lines to a regular grid will smooth<br />
<strong>the</strong> grid.<br />
Original elevation contour lines<br />
Elevation contour lines after conversion to a<br />
regular grid with 30x30meters resolution
Simulation method<br />
The method is based on <strong>the</strong> solution <strong>of</strong> <strong>the</strong> Reynolds Averaged<br />
Navier-Stokes equations, given in standard notation by:<br />
U<br />
x<br />
i<br />
i<br />
0<br />
U i<br />
Ui<br />
U<br />
1<br />
j<br />
t x<br />
j<br />
P<br />
x<br />
i<br />
x<br />
j<br />
U<br />
x<br />
i<br />
j<br />
U<br />
x<br />
i<br />
j<br />
u u<br />
i<br />
j<br />
F<br />
i<br />
Solving <strong>the</strong> non-linear transport equations for mass, momentum and<br />
optionally also <strong>the</strong> energy makes <strong>the</strong> method suitable for simulations<br />
in both complex terrain, and in situations with complex local<br />
climatology.<br />
Transport <strong>of</strong> <strong>the</strong> turbulent kinetic energy in an idealized 2D sinusoidal<br />
terrain, illustrating <strong>the</strong> development <strong>of</strong> a turbulent boundary layer.
Linear versus non-linear methods<br />
Streamlines over 2D ridge<br />
with average slope angle <strong>of</strong><br />
5.7, 11.3 and 21.8 degrees.<br />
Upstream speed-up, (speed hill top)/(speed inlet)<br />
Paper:<br />
Ishihara T., Yamaguchi A. and Fujino Y., A Nonlinear<br />
model for predictions <strong>of</strong> turbulent flow over steep terrain,<br />
The World <strong>Wind</strong> Energy Conference and Exhibition,<br />
Berlin, 2002.
Cosine hill – terrain data<br />
Elevation:<br />
z = H cos 2 (πSQRT(x 2 + y 2 )/2L) SQRT(x 2 + y 2 ) < L<br />
z = 0<br />
SQRT(x 2 + y 2 ) ≥ L<br />
where<br />
H = 200 meters<br />
L = 400 meters<br />
The maximum inclination angle is 40°<br />
Roughness heights:<br />
z 0 = z land<br />
z 0 = z sea<br />
SQRT(x 2 + y 2 ) < L<br />
SQRT(x 2 + y 2 ) ≥ L<br />
Measurement station<br />
<strong>Wind</strong> turbines
Cosine hill - climatology<br />
Sector 1 2 3 4<br />
k - - - 10.33<br />
A - - - 7.77<br />
Frequency 0.00 0.00 0.00 1.00<br />
Mean speed 0.00 0.00 0.00 7.50<br />
Weibull (k,A), frequency (-) and mean wind speed (m/s) versus sector.
Cosine hill – model input<br />
Grid:<br />
Resolution<br />
Height<br />
NZ<br />
Factor<br />
– Cell size in <strong>the</strong> horizontal plane<br />
– Distance from <strong>the</strong> hill top to <strong>the</strong> upper boundary<br />
– Number <strong>of</strong> cells in <strong>the</strong> z-direction<br />
– Distribution factor for refining <strong>the</strong> grid towards <strong>the</strong> ground<br />
Roughness:<br />
Z land – Roughness height for areas with elevation larger than 0<br />
Z sea – Roughness height for areas with elevation equal to 0<br />
Boundary conditions:<br />
BL Height – Boundary layer height<br />
BL Speed – Speed above <strong>the</strong> boundary layer<br />
Nesting<br />
– Initial and boundary conditions obtained by nesting<br />
Physical models:<br />
Transient<br />
Temp.<br />
Turb. mod.<br />
– Inclusion <strong>of</strong> <strong>the</strong> transient term in <strong>the</strong> transport equations<br />
– Inclusion <strong>of</strong> <strong>the</strong> transport equation for temperature<br />
– Turbulence closure<br />
Solution procedure:<br />
Iterations – Number <strong>of</strong> iteration performed in <strong>the</strong> solution procedure<br />
Solver<br />
– Segregated versus Coupled solver
Cosine hill – reference case<br />
Terrain Resolution Height NZ Factor #cells z land z sea<br />
40x40 1500 20 0.1 139986 0.03 0.03<br />
<strong>Wind</strong> <strong>Field</strong>s BL Height BL Speed Iterations Solver Nesting Turb. mod. Temp.<br />
500 10.0 300 Seg. No k-eps No<br />
Reference case ID 1000<br />
Resolution:<br />
40x40 meters, approximately140 000 cells<br />
.<br />
Vertical direction:<br />
Height 1500 meters, 20 cells, distribution factor <strong>of</strong><br />
0.1. Distribution <strong>of</strong> <strong>the</strong> first 5 nodes in z-direction:<br />
6.8, 23.7 47.0, 76.8, 113.0 meters<br />
Blocking:<br />
Setting <strong>the</strong> height <strong>of</strong> <strong>the</strong> computational domain to<br />
1500 meters above <strong>the</strong> highest point in <strong>the</strong> terrain,<br />
gives a blocking less than 2%.
Cosine hill – cases<br />
ID 1000 2000 3000 1001 1002 1100 1200<br />
Resolution 40x40 40x40 20x20 40x40 40x40 40x40 40x40<br />
Height 1500 1500 1000 1500 1500 1500 1500<br />
NZ 20 20 30 20 20 20 30<br />
Factor 0.1 0.1 0.1 0.1 0.1 0.1 0.05<br />
#cells 139986 139986 425971 139986 139986 139986 139986<br />
z land 0.03 0.03 0.03 0.03 0.03 0.03 0.03<br />
z sea 0.03 0.03 0.03 0.03 0.03 0.001 0.03<br />
BL Height 500 500 500 250 1000 500 500<br />
BL Height 10.0 10.0 10.0 10.0 10.0 10.0 10.0<br />
Iterations 300 1500 3000 300 300 300 300<br />
Solver Seg. Seg. Seg. Seg. Seg. Seg. Seg.<br />
Nesting No No Yes No No No No<br />
Turb. mod. k-eps k-eps k-eps k-eps k-eps k-eps k-eps<br />
Temp. No No No No No No No<br />
Cosine hill cases, changes to <strong>the</strong> reference case ID 1000 are marked with red.
Cosine hill – ID 2000<br />
WECS_40 WECS_60 WECS_80 AEP (Gwh/y)<br />
Upstream_clim_10 1.98 1.93 1.91 19.16<br />
Upstream_clim_30 1.58 1.55 1.53 15.27<br />
Upstream_clim_50 1.45 1.42 1.40 13.04<br />
Downstream_clim_10 2.67 2.61 2.57 18.56<br />
Downstream_clim_30 2.14 2.09 2.07 19.66<br />
Downstream_clim_50 2.01 1.97 1.94 19.34<br />
Speed-up and AEP for case ID 2000<br />
3D velocity vectors 10 meters above <strong>the</strong> ground
Cosine hill – ID 3000<br />
WECS_40 WECS_60 WECS_80 AEP (Gwh/y)<br />
Upstream_clim_10 1.88 1.84 1.82 18.51<br />
Upstream_clim_30 1.55 1.51 1.50 14.73<br />
Upstream_clim_50 1.43 1.40 1.38 12.62<br />
Downstream_clim_10 2.43 2.38 2.35 19.25<br />
Downstream_clim_30 2.30 2.25 2.22 19.61<br />
Downstream_clim_50 2.35 2.30 2.22 19.49<br />
Speed-up and AEP for case ID 3000<br />
3D velocity vectors 10 meters above <strong>the</strong> ground
Cosine hill<br />
Dowmstream climatology 10 30 50 comment<br />
AEP1000/2000 % 103.66 86.98 83.51 Increase <strong>the</strong> number <strong>of</strong> iterations<br />
Upstream climatology 10 30 50 comment<br />
AEP1000/2000 % 99.32 99.67 100.77 Increase <strong>the</strong> number <strong>of</strong> iterations<br />
AEP1000/3000 % 102.81 103.33 104.12 Finer resolution - separation<br />
AEP1000/1001 % 99.37 98.70 99.85 Reduced boundary layer height<br />
AEP1000/1002 % 100.42 101.13 100.84 Increased boundary layer height<br />
AEP1000/1100 % 115.33 115.74 112.02 Sea surface roughness<br />
AEP1000/1200 % 102.64 101.13 101.94 Finer resolution vertical direction<br />
- Slower convergence downstream<br />
- Separation requires 20x20 meters resolution, 40° inclination<br />
- Less sensitive to boundary pr<strong>of</strong>ile<br />
- Very sensitive to roughness changes<br />
- No significant changes with a finer grid in z-direction
Cosine hill – forest<br />
ID No forest Forest<br />
Min. res. 15x15 15x15<br />
Height 800 800<br />
NZ 30 30<br />
Factor 0.1 0.1<br />
#cells 460350 460350<br />
z land 0.03 Forest<br />
z sea 0.001 0.001<br />
BL Height 500 500<br />
BL Height 10.0 10.0<br />
Iterations 400 4000<br />
Solver Coupled Seg.<br />
Nesting No No<br />
Turb. mod. k-eps k-eps<br />
Temp. No No<br />
Forest<br />
height (m)<br />
#cells<br />
Setting for two similar cases with and without a forest<br />
Porosity<br />
Drag coeff<br />
(C2)<br />
10 3 0.38 0.2<br />
Dowmstream climatology 10 30 50 comment<br />
AEP (No forest)/(forest) % 117.24 126.09 129.44 Large sensitivities to vegetation<br />
Differences in AEP with and without a forest
AEP parameter sensitivities - processing<br />
Summary:<br />
Some processing parameters display large AEP sensitivities.<br />
Next:<br />
The AEP procedure requires inclusion <strong>of</strong> climatology data<br />
and turbine characteristics.<br />
We will look at post-processing parameter sensitivities.
AEP sensitivity – Post-processing<br />
- Climatologies represented by frequency distribution<br />
- Power curve correction<br />
The above sensitivities are illustrated with <strong>the</strong> micro-siting<br />
at Hundhammerfjellet a typical ridge situation with negative<br />
shear pr<strong>of</strong>iles.<br />
U ref refers to speed over a flat area, U refers to <strong>the</strong> perturbed speed over a hill<br />
top. The speed-up is given as U/U ref
Hundhammerfjellet – 2D ridge<br />
Location:<br />
<strong>Wind</strong> farm:<br />
Climatology:<br />
Models:<br />
Hundhammerfjellet, Norway<br />
Under construction, 15 turbines, 3-3.5 MW Scan<strong>Wind</strong>,<br />
80 meters hub height, height variation within <strong>the</strong><br />
wind farm is 60 meters<br />
Two measurement masts, 30 and 50 meters high<br />
Nesting, 15x15 km into 9x7,5 km with resolution<br />
30x30 meters, number <strong>of</strong> cells is 800 000<br />
Digital terrain model with elevation.<br />
9x7.5 km model in grey frame<br />
Hundhammerfjellet, photomontage
AEP (MWh/y)<br />
Hundhammerfjellet – Resources<br />
Tommerhol<br />
Hundhammer<br />
12000<br />
10000<br />
8000<br />
6000<br />
4000<br />
2000<br />
Measurement station<br />
<strong>Wind</strong> turbines<br />
0<br />
1 2 3 4 5 6 7 8 9 10 11 12 13 14 15 16 17<br />
Turbine<br />
<strong>Wind</strong> resource map at 80 meters<br />
AEP based on simulations (MWh/y)<br />
The difference in energy output between <strong>the</strong> various turbines is 23%<br />
AEP based on climatology Tommerhol is 175.0 GWh/y<br />
AEP based on climatology Hundhammer is 179.0 GWh/y<br />
The discrepancy in estimated AEP is 2.3 %.
Climatology transfer<br />
The discrete representation <strong>of</strong> a climatology as a frequency<br />
distribution introduces interpolation errors<br />
Speed-up: 0.9<br />
Direction shift: -10°<br />
Speed-up: 1.11<br />
Direction shift: 10°
Re-distribution <strong>of</strong> transferred climatology<br />
Frequency distribution<br />
Re-distribution errors<br />
The re-distribution imposes a smoothing <strong>of</strong> <strong>the</strong> frequency<br />
distribution.<br />
Consequently, a transferred climatology which is moved back<br />
to its original position will not be reproduced.
Hundhammerfjellet – climatology transfer<br />
The climatology Hundhammeren is moved 1000 meters in <strong>the</strong> cardinal<br />
direction and <strong>the</strong>n back to its original position.
Hundhammerfjellet – climatology transfer<br />
AEP/AEP ref : -10.72<br />
Errors in <strong>the</strong> order <strong>of</strong> 5% due to<br />
discrete representation <strong>of</strong> <strong>the</strong><br />
climatologies. (5% + 5% = 10% when<br />
moving back and forth)<br />
AEP/AEP ref : -0.67 AEP ref : 6.332 (GWh/y) AEP/AEP ref : -11.52<br />
AEP/AEP ref : -4.08<br />
Use <strong>the</strong> time histories instead <strong>of</strong> <strong>the</strong><br />
frequency distribution when postprocessing<br />
<strong>the</strong> wind field simulations.
Weighting <strong>of</strong> climatology data<br />
Summary:<br />
The representation <strong>of</strong> climatology data by a frequency<br />
distribution introduces significant interpolation errors.<br />
Finer resolution, more sectors and bins would reduce <strong>the</strong><br />
errors, <strong>the</strong> best would be to use time series.<br />
Next:<br />
Power curve correction
Hundhammerfjellet – negative shear<br />
Speed-ups are observed over hills with maximum wind speed<br />
near <strong>the</strong> ground followed by a region with a negative shear<br />
<strong>Wind</strong> field from sector 6 (150 degrees), isosurface showing <strong>the</strong> highest wind<br />
speeds below hub height
Energy content – wind pr<strong>of</strong>iles<br />
Energy content for logarithmic wind pr<strong>of</strong>ile<br />
Energy content for wind pr<strong>of</strong>ile with negative shear
Power curve certification<br />
Certified power curve is established at test site in plane terrain<br />
At complex sites <strong>the</strong> certified power curve is not valid<br />
Test site<br />
Ridge
Power curve correction procedure<br />
P<br />
v(<br />
z)<br />
1<br />
2<br />
16<br />
27<br />
H<br />
H<br />
r<br />
r<br />
D<br />
r<br />
2<br />
D<br />
2<br />
r<br />
2<br />
D<br />
2<br />
r<br />
2<br />
H<br />
r<br />
z<br />
2<br />
v(<br />
z)<br />
3<br />
dz<br />
R<br />
P(numerical pr<strong>of</strong>ile)<br />
P(exponent ial pr<strong>of</strong>ile)<br />
P<br />
cor<br />
v, m<br />
R<br />
v, m *P<br />
cer<br />
v<br />
Paper:<br />
F.Castellani F. and Franceschini G. A new<br />
technique to improve expected aep estimation in<br />
very complex terrain, AIAA 2005
Power curve correction<br />
A ridge situation with a negative shear pr<strong>of</strong>ile could be<br />
significantly improved with <strong>the</strong> correction procedure.<br />
No correction<br />
Correction<br />
100(Experimental/CFD) 77 96<br />
AEP (GWh/y) for a turbine on a ridge with and without power curve correction
Conclusion<br />
Calculation <strong>of</strong> <strong>the</strong> AEP involves many disciplines, describing<br />
complex physical phenomenon. Consequently, a simple<br />
calculation procedure can not be set up.<br />
Basic cases show that CFD is clearly more accurate than linear<br />
methods.<br />
Important issues<br />
• Grid resolution<br />
• Roughness description<br />
• Climatology description; frequency distribution vs. time-series<br />
• Power curve correction
More information<br />
Booth Number 747<br />
www.windsim.com:<br />
- Paper and presentations<br />
- Free <strong>Wind</strong>Sim evaluation copy<br />
- Training courses: 18-20 June 2007<br />
- User meeting: 21-22 June 2007