Wind field simulations at Askervein hill - WindSim
Wind field simulations at Askervein hill - WindSim
Wind field simulations at Askervein hill - WindSim

Create successful ePaper yourself
Turn your PDF publications into a flip-book with our unique Google optimized e-Paper software.
TECHNICAL REPORT<br />
____________________________________________________________________________________________________________________<br />
Title:<br />
<strong>Wind</strong> <strong>field</strong> <strong>simul<strong>at</strong>ions</strong> <strong>at</strong> <strong>Askervein</strong> <strong>hill</strong><br />
____________________________________________________________________________________________________________________<br />
Client:<br />
Internal study<br />
____________________________________________________________________________________________________________________<br />
D<strong>at</strong>e: October 1999 Number of pages: 37<br />
____________________________________________________________________________________________________________________<br />
Contract: - Classific<strong>at</strong>ion: -<br />
____________________________________________________________________________________________________________________<br />
Author(s):<br />
Jerome Leroy, Stage ingeneur, Ecole Centrale de Nantes<br />
___________________________________________________________________________________________________________________<br />
Responsible: Arne Reidar Gravdahl, VECTOR AS<br />
____________________________________________________________________________________________________________________<br />
Distribution: -<br />
Archive:<br />
VECTOR_9910_100<br />
V E C T O R<br />
VECTOR AS Phone: +47 33 38 18 00 E-mail: vector@vector.no<br />
Industrig<strong>at</strong>en 9 Telefax: +47 33 38 18 08 Internet: vector.no<br />
N-3117 Tønsberg Enterprise no.: NO 967 070 513<br />
Norway<br />
C F D C O N S U L T I N G
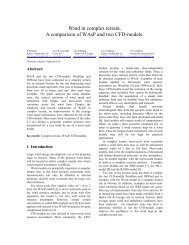
Abstract :<br />
This report presents the study th<strong>at</strong> has been carried out from August to October 1999 in the<br />
VECTOR company by Jérôme LEROY, student <strong>at</strong> the Ecole Centrale de Nantes.<br />
VECTOR has been developing a wind code called <strong>Wind</strong>Sim these last years. The <strong>Askervein</strong><br />
<strong>hill</strong> case, one of the most complete experimental study concerning full scale wind d<strong>at</strong>a<br />
measurements, is used in this study to test <strong>Wind</strong>Sim. The study of this particular case could<br />
be helpful towards the goal of meso scale <strong>at</strong>mospheric boundary layer modelling.<br />
Acknowledgements :<br />
I want to thank Arne Reidar Gravdahl, who supervised this work, for his gre<strong>at</strong> welcome and<br />
his alertness. I also want to thank the rest of the Vector crew for their help and fellow feeling<br />
during my staying in Norway.<br />
- 2 -
1. INTRODUCTION............................................................................................................. 4<br />
1.1. THE HOST COMPANY ......................................................................................................... 4<br />
1.2. THE WINDSIM PROJECT .................................................................................................... 4<br />
1.2.1. Electricity in Norway ................................................................................................ 4<br />
1.2.2. <strong>Wind</strong> resources in Norway ........................................................................................ 5<br />
1.2.3. Description of the project.......................................................................................... 5<br />
1.3. SUBJECT OF THE PRESENT STUDY...................................................................................... 6<br />
1.4. THE ASKERVEIN HILL CASE : BACKGROUND INFORMATION.............................................. 6<br />
2. DESCRIPTION OF THE STUDY................................................................................... 8<br />
2.1. PRELIMINARY ASSUMPTIONS............................................................................................. 8<br />
2.2. TURBULENCE MODEL........................................................................................................ 8<br />
2.2.1. Mixing length model.................................................................................................. 8<br />
2.2.2. k-ε model ................................................................................................................... 9<br />
2.2.3. Two scale k-ε model ................................................................................................ 10<br />
2.3. NUMERICAL SETUP.......................................................................................................... 11<br />
2.3.1. Calcul<strong>at</strong>ion domain................................................................................................. 11<br />
2.3.2. Boundary conditions ............................................................................................... 11<br />
3. SIMULATIONS AND RESULTS .................................................................................... 15<br />
3.1. GRID TESTING ................................................................................................................. 15<br />
3.1.1. Number of cells........................................................................................................ 15<br />
3.1.2. Grid grading............................................................................................................ 21<br />
3.2. INLET PROFILES............................................................................................................... 26<br />
3.3. BOUNDARY CONDITIONS................................................................................................. 26<br />
3.4. TURBULENCE MODEL...................................................................................................... 29<br />
4. CONCLUDING REMARKS ............................................................................................ 34<br />
5. REFERENCES................................................................................................................... 36<br />
- 3 -
1. INTRODUCTION<br />
1.1. The host company<br />
I have done my internship in a Norwegian company called Vector. Vector is a CFD<br />
consulting company. It is loc<strong>at</strong>ed in Tønsberg, a town th<strong>at</strong> lays on the western part of the<br />
Oslofjord, 100 km south of the capital of Norway. This business was cre<strong>at</strong>ed in 1993 by Arne<br />
Reidar GRAVDAHL, who supervised this work.<br />
Vector has realised several studies for St<strong>at</strong>oil, the major oil company in Norway. Currently is<br />
developing Vector a wind code in collabor<strong>at</strong>ion with the Norwegian W<strong>at</strong>er Resources and<br />
Energy Administr<strong>at</strong>ion.<br />
1.2. The <strong>Wind</strong>Sim project<br />
1.2.1. Electricity in Norway<br />
For the last decades, Norway has relied exclusively on hydroelectricity. But the electricity<br />
provided by w<strong>at</strong>er resources has turned out to be insufficient during the last years. Norway is<br />
no more independent from the energy point of view and has had to import electricity to supply<br />
its growing n<strong>at</strong>ional demand. Therefore the Norwegian W<strong>at</strong>er Resources and Energy<br />
Administr<strong>at</strong>ion (NVE) decided to get interested in other renewable sources of energy. <strong>Wind</strong><br />
energy proved to be an interesting option, considering the Norwegian wind resources.<br />
Figure 1.1.Estim<strong>at</strong>e of wind resources in Scandinavia<br />
(mean wind speed in open terrain 50 meters above the ground)<br />
- 4 -
1.2.2. <strong>Wind</strong> resources in Norway<br />
Norway is a country with rich wind resources. Still, their exploit<strong>at</strong>ion has been very modest<br />
so far. A cost effective energy production is only obtainable after careful positioning of wind<br />
turbines. The energy content of a wind <strong>field</strong> is proportional to the cube of the wind speed.<br />
Obviously, the energy production is most sensitive to varying wind conditions.<br />
The ideal situ<strong>at</strong>ion would be to have historical d<strong>at</strong>a on wind speed and direction for every<br />
potential loc<strong>at</strong>ions for wind turbines. This inform<strong>at</strong>ion is of course not available, but a<br />
combin<strong>at</strong>ion of experimental and numerical methods can help to achieve this goal.<br />
Thus, the recent interest in wind energy has driven the NVE to launch a project on meso scale<br />
wind modelling.<br />
1.2.3. Description of the project<br />
The project currently undertaken aims <strong>at</strong> assessing the wind resources along the Norwegian<br />
coast. Local models are established from the southern tip of Norway to the Russian border in<br />
the north. The wind resources are estim<strong>at</strong>ed on a so called meso scale.<br />
Available inform<strong>at</strong>ion on wind resources depends on which length scale phenomenon is<br />
considered. One can put in evidence three length scales.<br />
The synoptic scale typically covers whole countries. An estim<strong>at</strong>e of the wind resources in<br />
Norway, Sweden and Finland has been established by the U.S. N<strong>at</strong>ional Renewable Energy<br />
Labor<strong>at</strong>ory (see figure 1.1). It shows the mean wind speed in open terrain 50 meters above the<br />
ground. The h<strong>at</strong>ched area indic<strong>at</strong>es <strong>hill</strong>y terrain. The figure, as can be seen, puts into evidence<br />
interesting wind resources along the Norwegian coast.<br />
The meso scale covers regions in the order of 100 km 2 . In contrast to the synoptic scale, on<br />
the meso scale the influence of local topography is included. It is well known th<strong>at</strong><br />
topographically induced speedups can be substantial. One must take advantage of these<br />
speedups when loc<strong>at</strong>ing wind farms.<br />
Figure 1.2. Meso scale models along the Norwegian coast<br />
on which wind<strong>field</strong>s are calcul<strong>at</strong>ed<br />
- 5 -
The micro scale covers typically an area in the order of 1 km 2 . On this scale, veget<strong>at</strong>ion,<br />
infrastructure and the mutual interaction between wind turbines is important. Before any wind<br />
farm construction, inform<strong>at</strong>ion on the local wind<strong>field</strong>s on this scale will n<strong>at</strong>urally be obtained<br />
both experimentally and numerically.<br />
<strong>Wind</strong>Sim is a simul<strong>at</strong>or for prediction of local wind <strong>field</strong>s, based on 3-D digital terrains<br />
models. Its main goal is the assessment of wind resources along the Norwegian coast. There<br />
are also other applic<strong>at</strong>ions.<br />
<strong>Wind</strong>Sim is also used in prediction of dispersion of air pollution on a local scale.<br />
Accumul<strong>at</strong>ed exposure from continuous sources is determined from st<strong>at</strong>istical we<strong>at</strong>her d<strong>at</strong>a.<br />
During an uncontrolled release the dispersion scenario is calcul<strong>at</strong>ed from a local we<strong>at</strong>her<br />
forecast and input about the amount, position, time etc. given by the user.<br />
Other <strong>field</strong>s are concerned, for instance civil engineering. In certain loc<strong>at</strong>ions, the wind load<br />
on buildings is important and must be taken into account. It can be interesting to have a<br />
precise idea of the wind <strong>field</strong> to design these buildings. Avi<strong>at</strong>ion safety is also a m<strong>at</strong>ter of<br />
interest in hazardous conditions such as mountainous terrain, where inhomogeneous flow can<br />
be observed : the airplane crash <strong>at</strong> Værøy Island in 1990 is an example (T. UTNES and K.J.<br />
EIDSVIK, 1996).<br />
1.3. Subject of the present study<br />
The present study aims <strong>at</strong> testing <strong>Wind</strong>Sim on a known case (topography and experimental<br />
results) according to different parameters in order to improve the results. The conclusions of<br />
the study will help towards the goal of micro scale modelling. In order to test the results<br />
yielded by <strong>Wind</strong>Sim, they are compared with experimental d<strong>at</strong>a.<br />
The major experimental study th<strong>at</strong> has been undertaken in this <strong>field</strong> is certainly the <strong>Askervein</strong><br />
<strong>hill</strong> project. This project is regarded as a reference when it comes to test simul<strong>at</strong>ion of flow<br />
over <strong>hill</strong>s, both in experimental and numerical studies.<br />
1.4. The <strong>Askervein</strong> Hill case : background inform<strong>at</strong>ion<br />
This project was a collabor<strong>at</strong>ive study carried out under the auspices of the Intern<strong>at</strong>ional<br />
Energy Agency Programme of R&D on <strong>Wind</strong> Energy Conversion System. The experiments<br />
were conducted in 1982 and 1983 on <strong>Askervein</strong>, a 116 meters high <strong>hill</strong> on the west coast of<br />
the island of South Uist in the Outer Hebrides of Scotland. The site was selected considering<br />
many goals such as suitability from a numerical point of view, easy access, good wind<br />
conditions (uniform and well defined direction), topography.<br />
The <strong>hill</strong> is nearly ellipsoidal in plan with minor and major axis of 1 and 2 kilometres<br />
respectively. It is the site of the most complete <strong>field</strong> experiment to d<strong>at</strong>e, with 50 towers<br />
deployed, and whose 27 of them were equipped with three component turbulence sensors.<br />
- 6 -
A<br />
AA<br />
HT<br />
Figure 1.3. <strong>Askervein</strong> <strong>hill</strong> : topography, grid and not<strong>at</strong>ions for experimental d<strong>at</strong>a<br />
<strong>Askervein</strong> is a smooth <strong>hill</strong> with an interesting topography : the <strong>hill</strong> has a quite simple<br />
geometrical shape and resembles an ellipsoid. The results have been used in many<br />
verific<strong>at</strong>ions and testing of different models, both numerical and experimental (wind tunnel<br />
experiments), therefore this case is particularly well documented. This made the <strong>Askervein</strong><br />
<strong>hill</strong> case the most suitable reference to test numerical results versus full scale experimental<br />
d<strong>at</strong>a when it comes to micro scale modelling.<br />
Further details of the experiments are described by P.A TAYLOR and H.W. TEUNISSEN<br />
(1986).<br />
For this study, Three sets of d<strong>at</strong>a have been available (see figure 1.3 for not<strong>at</strong>ions) :<br />
-normalised velocity values <strong>at</strong> a 10 meters height along the A line;<br />
-normalised velocity values <strong>at</strong> a 10 meters height along the AA line;<br />
-fractional speed up <strong>at</strong> the <strong>hill</strong> top (HT).<br />
Figure 1.4. Topographic cross-sections through the <strong>hill</strong>, no vertical exagger<strong>at</strong>ion along A and AA lines.<br />
(Source : P.A TAYLOR and H.W. TEUNISSEN)<br />
- 7 -
2. DESCRIPTION OF THE STUDY<br />
This chapter describes the general assumptions th<strong>at</strong> have been done and the parameters th<strong>at</strong><br />
are varied in the study.<br />
<strong>Wind</strong>Sim is based on PHOENICS, the general purpose CFD code developed by CHAM Ltd.<br />
2.1. Preliminary assumptions<br />
The <strong>at</strong>mospheric boundary layer (ABL) is of course too complex to be modelled without<br />
doing several assumptions : since the domain of interest is loc<strong>at</strong>ed in the first 100 meters<br />
above the ground, we can neglect the Coriolis force. Assuming a neutral <strong>at</strong>mosphere, density<br />
vari<strong>at</strong>ions and temper<strong>at</strong>ure gradients are modest, and so energy and mechanical equ<strong>at</strong>ions are<br />
decoupled.<br />
2.2. Turbulence model<br />
The model is three dimensional and we note 1 (or x), 2 (or y) respectively the two axis<br />
parallel to the ground and 3 (or z) the vertical axis. The Reynolds equ<strong>at</strong>ion for conserv<strong>at</strong>ion of<br />
mean mass and momentum are given in standard not<strong>at</strong>ion by :<br />
∂U<br />
∂x<br />
U<br />
j<br />
i<br />
i<br />
∂ U ∂x<br />
= 0 (1)<br />
i<br />
1 ∂P<br />
∂ ⎛ ⎛ U U<br />
i j<br />
ν ∂ ∂ ⎞<br />
= − + +<br />
ρ ∂x<br />
∂x<br />
⎜<br />
⎜<br />
⎝ ∂x<br />
j<br />
∂x<br />
⎟<br />
⎝<br />
i ⎠<br />
−<br />
j i j<br />
( uiu<br />
j )<br />
The ( u i<br />
u j ) term, designed as the Reynolds stresses, is evalu<strong>at</strong>ed from the Boussinesq<br />
assumption :<br />
u u<br />
U U<br />
i<br />
= − ν<br />
⎛ ∂ ∂<br />
⎜ +<br />
⎝ ∂x<br />
j<br />
∂xi<br />
i j T<br />
j<br />
⎞<br />
⎟ ij<br />
k<br />
⎠<br />
+ 2<br />
δ<br />
3<br />
where k is the turbulent kinetic energy, and ν T the turbulent viscosity.<br />
⎞<br />
⎟<br />
⎠<br />
(2)<br />
2.2.1. Mixing length model<br />
In this model, the turbulent viscosity ν T is evalu<strong>at</strong>ed from the distance to the so called mixing<br />
length l m :<br />
- 8 -
ν T<br />
= l m<br />
U<br />
PHOENICS provides mixing-length expressions for use in simple geometries with zero- and<br />
one-equ<strong>at</strong>ion turbulence models which apply in the fully turbulent part of the flow, excluding<br />
the sublayer and buffer layer close to the wall. These expressions can be modified to make<br />
them applicable over the entire boundary layer, by using extensions which allow the<br />
influence of viscous effects very close to the wall. One such extension is th<strong>at</strong> proposed by<br />
Van Driest [1956], which takes the form:<br />
l<br />
m<br />
= l<br />
m0<br />
⎛ ⎛<br />
⎜1<br />
− exp⎜<br />
⎝ ⎝<br />
y<br />
A<br />
+<br />
+<br />
⎞⎞<br />
⎟⎟<br />
⎠⎠<br />
Uτ<br />
y<br />
g<br />
where l m0 is the unmodified mixing length, y + = and A+= 26.0. Here, y g is the normal<br />
ν<br />
τ<br />
w<br />
distance from the wall to the grid node, U τ is the friction velocity <strong>at</strong> the wall U<br />
τ<br />
= and ν<br />
ρ<br />
is the laminar kinem<strong>at</strong>ic viscosity.<br />
In general the damping constant A+ is not constant, and proposals may be found in the<br />
liter<strong>at</strong>ure which employ a functional rel<strong>at</strong>ionship for A+ so as to account for strong pressure<br />
gradients, mass transfer, compressibility, etc.<br />
2.2.2. k-ε model<br />
The k-ε model can also be used to close the set of equ<strong>at</strong>ions. It uses the dissip<strong>at</strong>ion r<strong>at</strong>e of<br />
turbulent kinetic energy ε.<br />
It is obvious th<strong>at</strong> the k-ε model can not predict all the details of the flow with accuracy.<br />
Nevertheless, experience proves th<strong>at</strong> this choice provides r<strong>at</strong>her good results, even in complex<br />
cases such as separ<strong>at</strong>ion (T.UTNES and K.J. EIDSVIK, 1996). This model is widely used in<br />
engineering applic<strong>at</strong>ions and proves to be well documented.<br />
The k-ε model provides the following equ<strong>at</strong>ions for k and ε :<br />
νT c k 2<br />
=<br />
µ<br />
ε<br />
( U k i )<br />
∂<br />
∂ ⎛ ν<br />
T ∂ k ⎞<br />
=<br />
ε<br />
∂ x ∂ x ⎜ σ ∂ x ⎟ + P −<br />
i<br />
i ⎝ k i ⎠ k<br />
∂<br />
∂ ⎛ ν ∂ ε ⎞ ε<br />
∂<br />
( U ε<br />
T<br />
x i ) = ⎜ ⎟ c<br />
∂ x ⎜ σ ∂ x ⎟ + ε k P c<br />
k<br />
− ε<br />
i i ⎝ ε i ⎠<br />
1 2<br />
ε<br />
2<br />
k<br />
This closure introduces several constants which are given two different sets of values.<br />
The standard values have been tuned to fit some basic flow problems such as, shear layer in<br />
local equilibrium, decaying grid turbulence and a boundary layer where logarithmic velocity<br />
profile prevails. The model constants can be adjusted in order to mimic other flow regimes.<br />
- 9 -
Considering a neutral ABL, the standard k-ε model is unable to reproduce the right level of<br />
turbulence in the weak shear layer away from the ground. In this region the turbulent viscosity<br />
is overpredicted, (DETERING and ETLING, 1985). The standard model constants have been<br />
modified in an <strong>at</strong>tempt to improve the situ<strong>at</strong>ion. The value of C ε2 , determined from<br />
experiments with decaying grid turbulence, remains unchanged. The diffusion constant σ k ,<br />
close to unity following Reynolds analogy, also remains unchanged. However, the constant<br />
C µ , determined from a shear layer in local equilibrium where it is found to be equal to :<br />
2<br />
⎛ u 1<br />
u 2 ⎞<br />
⎜ ⎟ , has been reduced in accordance with measurements in the ABL (Panofsky, 1977).<br />
⎝ κ ⎠<br />
Finally, the constants C ε1 and C ε2 can be adjusted, guided by the rel<strong>at</strong>ion from a boundary<br />
layer where the logarithmic law is valid :<br />
C<br />
2<br />
κ<br />
= Cε<br />
− C σ<br />
ε1 2<br />
µ ε<br />
Note th<strong>at</strong> κ is the Von Karman constant, set to be 0.4.<br />
The different values of the model constants tested in this work are given in the table below<br />
Constants names C µ C ε1 C ε2 σ k σ ε<br />
Standard values 0.09 1.44 1.92 1.0 1.3<br />
Modified values 0.0324 1.44 1.92 1.0 1.85<br />
2.2.3. Two scale k-ε model<br />
In this model the total turbulence energy, k, is divided equally between the production range<br />
and transfer range, thus k is given by :<br />
k = k p<br />
+ k t<br />
where k p is the turbulent kinetic energy of eddies in the production range and k t is the energy<br />
of eddies in the dissip<strong>at</strong>ion range. For high turbulent Reynolds numbers, the transport<br />
equ<strong>at</strong>ions for the turbulent kinetic energies are:<br />
∂<br />
( ρk<br />
)<br />
∂t<br />
p<br />
∂<br />
+<br />
∂x<br />
i<br />
⎛<br />
⎜ ρk<br />
⎝<br />
p<br />
∂U<br />
∂x<br />
i<br />
ρν<br />
T<br />
−<br />
C<br />
( k )<br />
p<br />
∂k<br />
∂x<br />
p<br />
i<br />
⎞<br />
⎟ = ρ<br />
⎠<br />
( p − ε )<br />
k<br />
p<br />
∂<br />
∂t<br />
( ρk<br />
)<br />
t<br />
∂<br />
+<br />
∂x<br />
i<br />
⎛ ∂U<br />
⎜ ρ<br />
⎝ ∂xi<br />
k<br />
t<br />
ρν<br />
T<br />
−<br />
C<br />
( k )<br />
t<br />
∂k<br />
t<br />
∂x<br />
i<br />
⎞<br />
⎟ = ρ<br />
⎠<br />
( ε − ε )<br />
p<br />
t<br />
wherein; ε p is the transfer r<strong>at</strong>e of turbulent kinetic energy from the production range to the<br />
dissip<strong>at</strong>ion range; ε t is the dissip<strong>at</strong>ion r<strong>at</strong>e; p k is the volumetric production r<strong>at</strong>e of turbulent<br />
kinetic energy; and C(k p ) and C(k t ) are constant coefficients.<br />
The corresponding transport equ<strong>at</strong>ions for the energy transfer r<strong>at</strong>e and the dissip<strong>at</strong>ion r<strong>at</strong>e are<br />
given by :<br />
- 10 -
∂<br />
( ρε )<br />
∂t<br />
p<br />
∂<br />
+<br />
∂x<br />
i<br />
⎛<br />
⎜ ρε<br />
p<br />
⎝<br />
∂U<br />
∂x<br />
i<br />
ρν<br />
T<br />
−<br />
C<br />
( ε )<br />
p<br />
∂ε<br />
p<br />
⎞<br />
⎟<br />
ρ<br />
=<br />
∂x<br />
i ⎠ k<br />
p<br />
2<br />
2<br />
( C p + C p ε − C ε )<br />
p1 k p2<br />
k p p3<br />
p<br />
∂<br />
( ρε )<br />
∂t<br />
t<br />
∂<br />
+<br />
∂x<br />
i<br />
⎛ ∂U<br />
⎜ ρε<br />
t<br />
⎝ ∂xi<br />
ρν<br />
T<br />
−<br />
C<br />
∂ε<br />
C<br />
t<br />
⎞<br />
⎟ = ρ<br />
⎠<br />
2<br />
2<br />
t1ε<br />
p<br />
+ Ct2ε<br />
tε<br />
p<br />
− Ct3ε<br />
t<br />
( ε<br />
t<br />
) ∂x<br />
⎟<br />
i<br />
kt<br />
where C(ε p ), C(ε t ), C p1 , C p2 , C p3 , C t1 , C t2 and C t3 are constant model coefficients. The<br />
C p1 p k 2 /k p and C t1 ε 2 /k t terms can be interpreted as variable energy transfer functions. The<br />
former term increases the energy transfer r<strong>at</strong>e when production is high, and the second term<br />
increases the dissip<strong>at</strong>ion r<strong>at</strong>e when the energy transfer r<strong>at</strong>e is high.<br />
The model constants are given as:<br />
C(k p ) C(ε p ) C(k t ) C(ε p ) C p1 C t2 C t3 C 1 C t2 C t3<br />
0.75 1.15 0.75 1.15 0.21 1.24 1.84 0.29 1.28 1.66<br />
The eddy viscosity is computed from:<br />
ν<br />
T<br />
=<br />
C<br />
µ<br />
ε<br />
k<br />
t<br />
2<br />
The model may be used in combin<strong>at</strong>ion with equilibrium (GRND2) or non-equilibrium<br />
(GRND3) wall functions (see part 2.3.2.2).<br />
2.3. Numerical setup<br />
2.3.1. Calcul<strong>at</strong>ion domain<br />
The physical domain is discretised with a 54*44 grid covering an area of about 3000 meters in<br />
x and y directions. The height of the domain is fixed <strong>at</strong> 1100 meters, with a variable number<br />
of cells and a variable geometrical distribution, who are tested in this study.<br />
2.3.2. Boundary conditions<br />
2.3.2.1. Inflow<br />
Two different inlet profiles have been tested.<br />
First, inlet profiles for velocity, kinetic energy and dissip<strong>at</strong>ion r<strong>at</strong>e of kinetic energy are given<br />
by the following analytical expressions :<br />
U<br />
1<br />
=<br />
U<br />
κ<br />
* τ<br />
U = 1 0 m s<br />
k<br />
1<br />
⎛<br />
l n ⎜<br />
⎝<br />
z<br />
z<br />
0<br />
⎞<br />
⎟<br />
⎠<br />
for z
ε<br />
3<br />
U<br />
*<br />
⎛ 1 4<br />
= ⎜ +<br />
κ ⎝ z<br />
L o b u k o v<br />
⎞<br />
⎟<br />
⎠<br />
Where U * is calcul<strong>at</strong>ed so th<strong>at</strong> there is no discontinuity in the velocity profile <strong>at</strong> z=500m, L BL<br />
is the thickness of the boundary layer, and L obukov is a parameter set to be equal to 1000 m.<br />
Another inlet profile is also tested in this study. This profile is fully developed, meaning th<strong>at</strong><br />
it is obtained by running the simul<strong>at</strong>or on a fl<strong>at</strong> comput<strong>at</strong>ional domain. In practice, this profile<br />
is obtained by letting the model run itself on a 3 cells long comput<strong>at</strong>ional domain having the<br />
same number of cells and distribution in y and z directions than the <strong>Askervein</strong> <strong>hill</strong> domain.<br />
The inlet condition is cyclic, th<strong>at</strong> is to say th<strong>at</strong> the outflow is constantly applied <strong>at</strong> the inlet of<br />
the domain. This is equivalent to compute the flow resulting from a constant profile on a long<br />
fl<strong>at</strong> uniform terrain.<br />
Pressure is calcul<strong>at</strong>ed <strong>at</strong> each node on the boundary, according to velocity so th<strong>at</strong> the equ<strong>at</strong>ion<br />
of continuity is s<strong>at</strong>isfied (“mass flow” boundary condition).<br />
2.3.2.2. Ground boundary<br />
On the ground, the law of the wall is applied, in order to bridge the viscous sublayer and cut<br />
comput<strong>at</strong>ional costs. Thus, we apply "near-wall" boundary conditions for the mean flow and<br />
turbulence transport equ<strong>at</strong>ions. It gives the value of the dependant variables <strong>at</strong> the first cell<br />
row above the ground. These grid nodes are presumed to lie outside the viscous sublayer in a<br />
fully turbulent flow. This approach reduces comput<strong>at</strong>ion time and moreover simplifies<br />
comput<strong>at</strong>ion outside the layer since viscous effects do not need to be taken into account any<br />
more.<br />
PHOENICS provides 2 different types of wall functions : equilibrium log-law functions and<br />
non-equilibrium log-law functions called respectively GRND2 and GNRD3 in the<br />
PHOENICS parlance.<br />
Equilibrium log-law wall functions<br />
U<br />
U<br />
r<br />
τ<br />
E.y<br />
= ⎛ +<br />
⎝ ⎜ ⎞<br />
ln ⎟<br />
κ ⎠<br />
(1)<br />
k<br />
2<br />
U<br />
τ<br />
=<br />
2<br />
C<br />
(2)<br />
µ<br />
0. 75 1.<br />
5<br />
µ<br />
ε = C .k<br />
κ.y<br />
(3)<br />
where : ρ is the fluid density, E the roughness parameter, κ the Von Karman constant, y the<br />
distance of the first grid point to the wall, U r the resultant velocity parallel to the wall <strong>at</strong> the<br />
first grid node, y + the dimensionless distance to the wall given by (4):<br />
- 12 -
U y<br />
y<br />
+ = τ υ (4)<br />
and U τ the resultant friction velocity defined by (5) :<br />
τ<br />
w<br />
U<br />
τ<br />
= (5)<br />
ρ<br />
The law (1), the so called logarithmic law of the wall, must be applied strictly <strong>at</strong> points where<br />
30
ε<br />
t<br />
= ε p<br />
Here<br />
by:<br />
K<br />
⎛<br />
⎜<br />
U<br />
=<br />
⎝ C<br />
β =<br />
τ<br />
µ<br />
C<br />
2<br />
⎞<br />
⎟ , Y is the normal distance of the first grid point from the wall, and β is given<br />
⎠<br />
µ<br />
( ε ) ( )<br />
−1<br />
p<br />
C<br />
p3<br />
K<br />
2<br />
C<br />
- C<br />
2<br />
p1<br />
- C<br />
p2<br />
which yields a value of β=0.25.<br />
Non equilibrium log-law wall functions<br />
This law uses the root of the kinetic energy<br />
characteristic length scale.<br />
Thus, equ<strong>at</strong>ion (1) is replaced by :<br />
k r<strong>at</strong>her than the friction velocity as the<br />
U k<br />
U<br />
2<br />
r<br />
2<br />
τ<br />
2<br />
Et<br />
k y<br />
= ⎛ ⎝ ⎜ ⎞<br />
ln ⎟<br />
κ ⎠<br />
t<br />
where<br />
κ<br />
t<br />
= κ C<br />
µ<br />
E<br />
EC<br />
0.<br />
25<br />
t<br />
=<br />
µ<br />
0 . 2 5<br />
The equ<strong>at</strong>ions (2) to (5) remain unchanged. The value of k <strong>at</strong> the near wall point is calcul<strong>at</strong>ed<br />
from its transport equ<strong>at</strong>ion, considering th<strong>at</strong> energy diffusion is set to zero to the wall.<br />
For the2-scale k-ε model, the tre<strong>at</strong>ment is similar to th<strong>at</strong> employed for the standard k-ε model,<br />
with k p and k t determined from their respective balance equ<strong>at</strong>ions and for simplicity it is<br />
assumed th<strong>at</strong> ε p =ε t .<br />
2.3.2.3. Other boundaries<br />
On the l<strong>at</strong>eral sides and on the top of the domain are imposed zero normal deriv<strong>at</strong>ives and<br />
zero values for velocities, k and ε. At the outlet, zero gradient boundary conditions are<br />
imposed, meaning th<strong>at</strong> plane geometry downwind the domain is assumed. Pressure is set to be<br />
equal to zero.<br />
- 14 -
3. SIMULATIONS AND RESULTS<br />
3.1. Grid testing<br />
The grid can be modified in z direction, according to the number of cells and their<br />
distribution. The cells distribution use an arithmetic sequence, providing a convenient method<br />
for smooth grid construction. Let us call h k the height of cell number k (from the ground), we<br />
have thus : hk<br />
+ 1<br />
= hk<br />
+ ∆ h . n is the total number of cells in z direction, and g is the grid<br />
grading defined by:<br />
g<br />
h<br />
= 1<br />
h n<br />
Thus the height of the first cell is given by, noting H the total height of the domain:<br />
h<br />
1<br />
=<br />
H<br />
g<br />
n<br />
⎛ 1+ 1−<br />
⎞<br />
⎜ ⎟<br />
⎝ 2g<br />
⎠<br />
and the arithmetic reason by :<br />
∆h =<br />
2H<br />
⎛ 2c<br />
⎞<br />
n( n − 1)<br />
⎜1+ ⎟<br />
⎝ 1 − c⎠<br />
Note th<strong>at</strong> tests have been done with the k-ε model and equilibrium boundary condition, with<br />
analytical profile <strong>at</strong> the inlet.<br />
Firstable, we study the effect of varying g, with a fixed number of cells. We choose a grading<br />
g=0.1.<br />
3.1.1. Number of cells<br />
Table shows the different tested cases, figure 3.1 shows the different grid repartitions.<br />
Grid<br />
Number of cells in<br />
z direction<br />
Grading<br />
A 20 0.1<br />
B 25 0.1<br />
C 30 0.1<br />
D 35 0.1<br />
- 15 -
1500.0<br />
Tested grids<br />
varying n<br />
height above ground (m)<br />
1000.0<br />
500.0<br />
0.0<br />
a b c d<br />
Figure 3.1. Tested grids<br />
Note th<strong>at</strong> the total height of the domain is not a constant since the <strong>hill</strong> is 116m high, but this<br />
only affect the cells height in a 10% uniform r<strong>at</strong>e.<br />
The results of <strong>simul<strong>at</strong>ions</strong> are compared against experimental d<strong>at</strong>a : see respectively figures<br />
3.2, 3.3 and 3.4 for results along lines A, AA and <strong>at</strong> the HT point.<br />
Figure 3.2 displays the first velocity component along the A line.<br />
It should be noted one of the grids c<strong>at</strong>ches the maximum speed up. The error is about 15% <strong>at</strong><br />
the <strong>hill</strong> top. Grids a, b, c and d give comparable results upwind the <strong>hill</strong>. Results on the lee side<br />
vary according to the grid. As expected, the results are getting better as the number of nodes<br />
in z-direction is increasing,<br />
Figure 3.3 is similar to figure 3.2 except th<strong>at</strong> it is for the AA line.<br />
As in figure 3.2, the <strong>hill</strong> top speed up is under predicted. Nevertheless maximum speed up is<br />
quite good predicted. Grids a, b, c give about the same results right up to the top. Grid c<br />
predicts maximum speed up with very good accuracy. Grid d, on the contrary, gives good<br />
results for the first measurement points but largely underpredicts the <strong>hill</strong> top speed up. On the<br />
lee side, the finer he grid is, the lower velocities are predicted.<br />
Figure 3.4 displays the fractional speed up <strong>at</strong> the <strong>hill</strong> top point defined by :<br />
U(<br />
z)<br />
−Uref<br />
( z)<br />
∆ S(<br />
z)<br />
=<br />
Uref ( z)<br />
where Uref is the upstream the <strong>hill</strong> (without obstacles). Note th<strong>at</strong> for the <strong>Askervein</strong> <strong>hill</strong> case,<br />
the reference velocity profile is chosen 500 meters upwind the <strong>hill</strong> top. This is worth to notice<br />
since the results can be affected in the order of 10% whether reference is taken <strong>at</strong> the inlet of<br />
the domain or <strong>at</strong> some other point downstream. The <strong>simul<strong>at</strong>ions</strong> results are interpol<strong>at</strong>ed from<br />
the first grid node.<br />
- 16 -
2.0<br />
1.5<br />
A line<br />
varying n<br />
exp results<br />
grid a<br />
grid b<br />
grid c<br />
grid d<br />
normalized velocity<br />
1.0<br />
0.5<br />
0.0<br />
500.0 1000.0 1500.0 2000.0 2500.0<br />
distance along A line (m)<br />
Figure 3.2<br />
2.0<br />
1.5<br />
AA line<br />
varying n<br />
exp results<br />
grid a<br />
grid b<br />
grid c<br />
grid d<br />
normalized velocity<br />
1.0<br />
0.5<br />
0.0<br />
500.0 1000.0 1500.0 2000.0 2500.0<br />
distance along AA line (m)<br />
Figure 3.3<br />
- 17 -
height above ground (m)<br />
100<br />
10<br />
<strong>hill</strong> top<br />
varying n<br />
exp results<br />
grid a<br />
grid a<br />
grid c<br />
grid d<br />
1<br />
0.0 0.5 1.0 1.5<br />
fractionnal speed up<br />
Figure 3.4<br />
Figure 3.4 shows the inability of the grid to predict the flow within the first meters above the<br />
ground. Results of the <strong>simul<strong>at</strong>ions</strong> always underpredict experimental d<strong>at</strong>a below 20 meters.<br />
Figures 3.5 to 3.8 show the total velocity <strong>field</strong> for the different <strong>simul<strong>at</strong>ions</strong> with grids a, b, c<br />
and d. Velocities are displayed <strong>at</strong> the first cell row, with contours for the first component of<br />
velocity. These results can not be compared against experimental results but can help towards<br />
further understanding of the different cases.<br />
- 18 -
PHOTON<br />
UCRT<br />
3.5<br />
4.0<br />
4.5<br />
5.0<br />
5.5<br />
6.0<br />
6.5<br />
7.0<br />
7.5<br />
8.0<br />
8.6<br />
9.1<br />
9.6<br />
10.1<br />
10.6<br />
Y<br />
2.72E+01<br />
X<br />
DTM - WINDROSE, ANGLE = 270, ID=400<br />
Figure 3 5. Grid a<br />
PHOTON<br />
UCRT<br />
2.8<br />
3.4<br />
3.9<br />
4.5<br />
5.0<br />
5.6<br />
6.1<br />
6.7<br />
7.3<br />
7.8<br />
8.4<br />
8.9<br />
9.5<br />
10.1<br />
10.6<br />
Y<br />
2.72E+01<br />
X<br />
DTM - WINDROSE, ANGLE = 270, ID=400<br />
Figure 3.6. Grid b<br />
- 19 -
PHOTON<br />
UCRT<br />
1.9<br />
2.6<br />
3.2<br />
3.8<br />
4.4<br />
5.0<br />
5.7<br />
6.3<br />
6.9<br />
7.5<br />
8.1<br />
8.8<br />
9.4<br />
10.0<br />
10.6<br />
Y<br />
2.72E+01<br />
X<br />
DTM - WINDROSE, ANGLE = 270, ID=400<br />
Figure 3.7. Grid c<br />
PHOTON<br />
UCRT<br />
-0.4<br />
0.4<br />
1.2<br />
2.0<br />
2.7<br />
3.5<br />
4.3<br />
5.1<br />
5.9<br />
6.7<br />
7.5<br />
8.3<br />
9.1<br />
9.8<br />
10.6<br />
Y<br />
2.72E+01<br />
X<br />
DTM - WINDROSE, ANGLE = 270, ID=400<br />
Figure 3.8. Grid d<br />
- 20 -
Figures 3.5 to 3.8 put on evidence a zone of low velocities downstream the <strong>hill</strong>. This zone is<br />
varying according to the different grids. Thus, grid d shows an area with reversed flow, which<br />
means th<strong>at</strong> there is separ<strong>at</strong>ion downwind the <strong>hill</strong>.<br />
However, grid d underpredicts velocity on the lee side for both of the lines. This means th<strong>at</strong><br />
separ<strong>at</strong>ion is not as important as it is calcul<strong>at</strong>ed.<br />
On the other hand, it should be noted th<strong>at</strong> the grid can not be refined too much towards the<br />
ground, since too thin and long cells may cause numerical inaccuracy.<br />
Then the number of cells is fixed <strong>at</strong> 30 and the grading is varied.<br />
3.1.2. Grid grading<br />
The table below shows the different tested cases :<br />
Grid<br />
Number of cells in<br />
z direction<br />
Grading<br />
e 30 0.2<br />
f 30 0.15<br />
c 30 0.1<br />
h 30 0.075<br />
Figure 3.10 shows the different grid repartitions.<br />
1500.0<br />
Tested grids<br />
varying g<br />
height above ground (m)<br />
1000.0<br />
500.0<br />
0.0<br />
c e f g<br />
Figure 3.10<br />
Figures 3.11 to 3.13 display d<strong>at</strong>a comparisons.<br />
- 21 -
2.0<br />
1.5<br />
A line<br />
varying g<br />
exp results<br />
grid e<br />
grid f<br />
grid g<br />
normalized velocity<br />
1.0<br />
0.5<br />
0.0<br />
500.0 1000.0 1500.0 2000.0 2500.0<br />
distance along A line (m)<br />
Figure 3.11<br />
2.0<br />
1.5<br />
AA line<br />
varying g<br />
exp results<br />
grid e<br />
grid f<br />
grid g<br />
normalized velocity<br />
1.0<br />
0.5<br />
0.0<br />
500.0 1000.0 1500.0 2000.0 2500.0<br />
distance along AA line (m)<br />
Figure 3.12<br />
- 22 -
100.00<br />
<strong>hill</strong> top<br />
varying g<br />
exp results<br />
grid e<br />
grid f<br />
grid g<br />
height above ground (m)<br />
10.00<br />
1.00<br />
0.0 0.5 1.0 1.5<br />
fractionnal speed up<br />
Figure 3.13<br />
Figure 3.11 : grids e and f show slight discrepancies with experimental results downwind the<br />
top, but fail in predicting downwind the top flow. Grid g gives good results, with remarkable<br />
accuracy for the maximum speed up and velocities on the lee side.<br />
Figure 3.12 : grids e and f give quite good results all the line long, except for the velocity drop<br />
upwind the <strong>hill</strong>. Grid g captures this drop but yields too low velocities everywhere else along<br />
the line.<br />
Figure 3.13 : grid g provides the best results, but there is no significant difference between the<br />
three tested grids.<br />
- 23 -
PHOTON<br />
UCRT<br />
3.3<br />
3.9<br />
4.4<br />
4.9<br />
5.4<br />
6.0<br />
6.5<br />
7.0<br />
7.5<br />
8.1<br />
8.6<br />
9.1<br />
9.6<br />
10.1<br />
10.7<br />
Y<br />
2.76E+01<br />
X<br />
DTM - WINDROSE, ANGLE = 270, ID=400<br />
Figure 3.14. Grid e<br />
PHOTON<br />
UCRT<br />
2.9<br />
3.4<br />
4.0<br />
4.5<br />
5.1<br />
5.7<br />
6.2<br />
6.8<br />
7.3<br />
7.9<br />
8.4<br />
9.0<br />
9.5<br />
10.1<br />
10.7<br />
Y<br />
2.74E+01<br />
X<br />
DTM - WINDROSE, ANGLE = 270, ID=400<br />
Figure 3.15. Grid f<br />
- 24 -
PHOTON<br />
UCRT<br />
0.5<br />
1.2<br />
1.9<br />
2.6<br />
3.4<br />
4.1<br />
4.8<br />
5.5<br />
6.3<br />
7.0<br />
7.7<br />
8.4<br />
9.2<br />
9.9<br />
10.6<br />
Y<br />
2.70E+01<br />
X<br />
DTM - WINDROSE, ANGLE = 270, ID=400<br />
Figure 3.16. Grid g<br />
Grid c seems to give the best results according to the experimental d<strong>at</strong>a. Therefore this is the<br />
grid th<strong>at</strong> is going to be used in the following <strong>simul<strong>at</strong>ions</strong>.<br />
- 25 -
3.2. Inlet profiles<br />
The two inlet profiles are tested with grid c and standard k-ε model and equilibrium boundary<br />
conditions. The analytical and fully developed profiles are called respectively inflows N°1<br />
and N°2.<br />
D<strong>at</strong>a comparisons are displayed on figures 3.17 to 3.19.<br />
3.3. Boundary conditions<br />
This part aims <strong>at</strong> finding wh<strong>at</strong> boundary condition fits the flow better. The simul<strong>at</strong>ion is done<br />
with grid c and standard k-ε model and inlet profile N°1.<br />
D<strong>at</strong>a comparisons are displayed on figures 3.17 to 3.19.<br />
Figures 3.17 and 3.18 show slight differences between the results yielded by the two different<br />
inflow profiles. However, results with the fully developed profile tend to provide lower values<br />
than with the log law profile. This is obvious on figure 3.19 <strong>at</strong> the <strong>hill</strong> top.<br />
The non equilibrium boundary condition yields r<strong>at</strong>her good results on the line A, but fails<br />
along the line AA. Nevertheless, the maximum speed up (see figure 3.19) is quite acceptably<br />
predicted.<br />
A line<br />
2.0<br />
1.5<br />
exp results<br />
inflow 1, grnd2<br />
inflow 2, grnd2<br />
inflow 1, grnd3<br />
normalized velocity<br />
1.0<br />
0.5<br />
0.0<br />
500.0 1000.0 1500.0 2000.0 2500.0<br />
distance along A line (m)<br />
Figure 3.17<br />
- 26 -
2.0<br />
1.5<br />
AA line<br />
varying inflow<br />
exp results<br />
inflow 1, grnd2<br />
inflow 2, grnd2<br />
inflow 1, grnd3<br />
normalized velocity<br />
1.0<br />
0.5<br />
0.0<br />
500.0 1000.0 1500.0 2000.0 2500.0<br />
distance along AA line (m)<br />
Figure 3.18<br />
100<br />
<strong>hill</strong> top<br />
inflow comparison<br />
exp results<br />
inflow 1, grnd2<br />
inflow 2, grnd2<br />
inflow 1, grnd3<br />
height above ground (m)<br />
10<br />
1<br />
0.0 0.5 1.0 1.5<br />
fractionnal speed up<br />
Figure 3.19<br />
- 27 -
PHOTON<br />
UCRT<br />
2.6<br />
3.3<br />
4.0<br />
4.8<br />
5.5<br />
6.2<br />
6.9<br />
7.6<br />
8.3<br />
9.1<br />
9.8<br />
10.5<br />
11.2<br />
11.9<br />
12.6<br />
Y<br />
2.91E+01<br />
X<br />
DTM - WINDROSE, ANGLE = 270, ID=400<br />
Figure 3.17. Inlet profile n°2, GRND2<br />
PHOTON<br />
UCRT<br />
0.7<br />
1.4<br />
2.1<br />
2.8<br />
3.5<br />
4.3<br />
5.0<br />
5.7<br />
6.4<br />
7.1<br />
7.8<br />
8.5<br />
9.3<br />
10.0<br />
10.7<br />
Y<br />
2.71E+01<br />
X<br />
DTM - WINDROSE, ANGLE = 270, ID=400<br />
Figure 3.18. Inlet profile n°1, GRND3<br />
- 28 -
As can be seen on figure 3.17, the inflow n°2 seems not to change the results a lot.<br />
On the contrary, the non equilibrium boundary condition seems to yield unphysical solution<br />
on the lee side (see figure 3.18). This boundary condition seems not to fit the case.<br />
3.4. Turbulence model<br />
In this part, different turbulence models are tested : standard k-ε model, modified k-ε model,<br />
mixing length model and two-scale k-ε model.<br />
The c grid is chosen, boundary condition on the ground is GRND2, inflow is the log law<br />
profile.<br />
A line<br />
2.0<br />
1.5<br />
exp results<br />
k−eps mod<br />
2 scale k−eps<br />
mix length<br />
normalized velocity<br />
1.0<br />
0.5<br />
0.0<br />
500.0 1000.0 1500.0 2000.0 2500.0<br />
distance along A line (m)<br />
Figure 3.17. A line with different models<br />
Figures 3.17, 3.18 and 3.19 : The mixing length model yields r<strong>at</strong>her good results along A line<br />
but underpredicts velocities along AA line. The modified constants in the k-ε model do not<br />
seem to improve the results in comparison with the standard values (is th<strong>at</strong> a mistake in the<br />
simul<strong>at</strong>ion parameters ?), whereas the two-scale k-ε model, as expected, slightly improves<br />
results on the lee side, predicting the same results as the k-ε model upwind the <strong>hill</strong> top.<br />
- 29 -
AA line<br />
2.0<br />
1.5<br />
exp results<br />
k−eps mod<br />
2 scale k−eps<br />
mixing length<br />
normalized velocity<br />
1.0<br />
0.5<br />
0.0<br />
500.0 1000.0 1500.0 2000.0 2500.0<br />
distance along AA line (m)<br />
Figure 3.18. AA line with different models<br />
<strong>hill</strong> top<br />
100<br />
exp results<br />
k−eps mod<br />
2 scale k−eps<br />
height above ground (m)<br />
10<br />
1<br />
0.0 0.5 1.0 1.5<br />
fractionnal speed up<br />
Figure 3.19. Hill top with different fluid models<br />
- 30 -
PHOTON<br />
UCRT<br />
2.2<br />
2.8<br />
3.4<br />
4.0<br />
4.6<br />
5.2<br />
5.8<br />
6.4<br />
7.0<br />
7.6<br />
8.2<br />
8.8<br />
9.4<br />
10.0<br />
10.6<br />
Y<br />
2.72E+01<br />
X<br />
DTM - WINDROSE, ANGLE = 270, ID=400<br />
Figure 3.20. Modified k-ε model<br />
PHOTON<br />
UCRT<br />
1.2<br />
1.9<br />
2.6<br />
3.3<br />
4.0<br />
4.7<br />
5.3<br />
6.0<br />
6.7<br />
7.4<br />
8.1<br />
8.8<br />
9.5<br />
10.2<br />
10.8<br />
Y<br />
2.72E+01<br />
X<br />
DTM - WINDROSE, ANGLE = 270, ID=400<br />
Figure 3.21. Mixing length model<br />
- 31 -
PHOTON<br />
UCRT<br />
0.8<br />
1.5<br />
2.2<br />
2.8<br />
3.5<br />
4.2<br />
4.9<br />
5.6<br />
6.3<br />
7.0<br />
7.7<br />
8.3<br />
9.0<br />
9.7<br />
10.4<br />
Y<br />
2.70E+01<br />
X<br />
DTM - WINDROSE, ANGLE = 270, ID=400<br />
Figure 3.22. 2-scale k-ε model<br />
Figures 3.24 and 3.25 show the different speed up profiles <strong>at</strong> 4 points along line A for both of<br />
the standard k-ε model and the two-scale k-ε model. The points are respectively loc<strong>at</strong>ed 400m<br />
before HT, HT, 400m after HT and 1000m after HT.<br />
Figure 3.23. Schem<strong>at</strong>ic of flow over a <strong>hill</strong> show different regions of the flow :<br />
inner, middle, outer and wake regions. Source : J.C. KAIMAL<br />
and J.J. FINNIGAN, 1994, "Atmospheric Boundary Layer Flows".<br />
Figure 3.23 shows the regions of the flow and explains the shape of vertical profiles <strong>at</strong><br />
different points on the <strong>hill</strong>. It should be noted th<strong>at</strong> the wake region has large extension<br />
downwind the <strong>hill</strong>, as it can be seen on the following figures.<br />
- 32 -
speed up profiles along line A<br />
speed up profiles along line A<br />
1500.0<br />
−400m<br />
k−eps stand<br />
2 scale k−eps<br />
1000.0<br />
<strong>hill</strong> top<br />
k−eps stand<br />
2 scale k−eps<br />
800.0<br />
height above ground (m)<br />
1000.0<br />
500.0<br />
height above ground (m)<br />
600.0<br />
400.0<br />
200.0<br />
0.0<br />
−0.20 −0.15 −0.10 −0.05 0.00 0.05<br />
fractionnal speed up<br />
0.0<br />
−0.2 0.0 0.2 0.4 0.6 0.8<br />
fractionnal speed up<br />
1500.0<br />
speed up profiles along line A<br />
+400m<br />
k−eps stand<br />
2 scale k−eps<br />
1500.0<br />
speed up profiles along line A<br />
+1000m<br />
k−eps stand<br />
2 scale k−eps<br />
height above ground (m)<br />
1000.0<br />
500.0<br />
height above ground (m)<br />
1000.0<br />
500.0<br />
0.0<br />
−0.8 −0.6 −0.4 −0.2 0.0 0.2<br />
fractionnal speed up<br />
0.0<br />
−0.20 −0.15 −0.10 −0.05 0.00<br />
fractionnal speed up<br />
height above ground (m)<br />
Figure 3.24. Speed ups comparison -standard k-eps model/2scale k-eps model<br />
<strong>at</strong> different points along line A<br />
1500.0<br />
1000.0<br />
500.0<br />
speed up profiles along line A<br />
grid c<br />
−400 m<br />
ht<br />
+400 m<br />
+1000 m<br />
0.0<br />
−0.5 0.0 0.5 1.0 1.5<br />
fractionnal speed up<br />
Figure 3.25. Speed up profiles : standard k-eps model<br />
- 33 -
4. CONCLUDING REMARKS<br />
The results from the <strong>Wind</strong>Sim code have been tested against experimental d<strong>at</strong>a.<br />
We saw th<strong>at</strong> the results turn out to be varying a lot according to grid changing. This grid<br />
dependency shows the need for grid refinement or improvement. The first cells above the<br />
ground are essential to capture the physics of the flow. There is an important gradient in this<br />
region. But a too high refinement in z-direction towards the ground causes long thin cells,<br />
which may lead to numerical inaccuracy. Therefore a more refined grid in x and y directions<br />
should be tested. This can not be done without a digitalis<strong>at</strong>ion from a more accur<strong>at</strong>e map of<br />
the <strong>hill</strong>. Exponential distribution, th<strong>at</strong> has not been tested in this study, might improve the<br />
results.<br />
Unfortun<strong>at</strong>ely, the complete results of the <strong>Askervein</strong> <strong>hill</strong> experience have not been available<br />
for this work. Additional experimental results concerning turbulence quantities could<br />
contribute to further analysis of the <strong>simul<strong>at</strong>ions</strong> for this study.<br />
This case still raises questions about separ<strong>at</strong>ion. The question to know whether or not the<br />
separ<strong>at</strong>ion bubble exists is crucial. Such a phenomenon affects the whole velocity <strong>field</strong>, not<br />
only in the separ<strong>at</strong>ed region.<br />
In fact, it seems th<strong>at</strong> separ<strong>at</strong>ion occurs or almost occurs. Unfortun<strong>at</strong>ely, there is not yet simple<br />
applicable rules concerning rough wall turbulent separ<strong>at</strong>ion. The slope of the <strong>hill</strong>, as well as<br />
surface roughness, are sensitive factors for separ<strong>at</strong>ion. Finnnigan et al (1990) established th<strong>at</strong><br />
for rough cones, a 20 degree slope is the lower limit to ensure steady separ<strong>at</strong>ion. For the<br />
<strong>Askervein</strong> <strong>hill</strong>, geometrical parameters have been measured to be approxim<strong>at</strong>ely H=104 m<br />
and L=220 m (see figure), yielding a maximum slope of the order of 14 degrees.<br />
<strong>Wind</strong> direction<br />
H/2<br />
L H/2<br />
Figure 4.1. Normal cross section of the <strong>hill</strong> with not<strong>at</strong>ions<br />
If there is separ<strong>at</strong>ion -and it seems to be virtually the case- how should it be modelled? Is the<br />
modelling approach still valid ? Should the assumptions be questioned? Unfortun<strong>at</strong>ely, most<br />
of inform<strong>at</strong>ion we have about such cases come from m<strong>at</strong>hem<strong>at</strong>ical <strong>simul<strong>at</strong>ions</strong>. It should be<br />
noted th<strong>at</strong> carrying out experiments in these separ<strong>at</strong>ed region conditions is not an easy thing<br />
to do, since the velocity never reaches its average value. Measurements have though to be<br />
carried out on a very large time scale.<br />
As emphasised by J.L. Walmsley and P.A. Taylor (1995), pointing out th<strong>at</strong> a lower roughness<br />
gives better results for the <strong>hill</strong> top in a study on the <strong>Askervein</strong> <strong>hill</strong> case, there are still<br />
questions about the roughness length th<strong>at</strong> should be adopted. A lower roughness seems to<br />
give better results for the <strong>hill</strong> top. Should we adopt a varying roughness model?<br />
- 34 -
It is also stressed in this paper th<strong>at</strong> the velocity <strong>field</strong> on <strong>Askervein</strong> may be affected by the<br />
neighbouring <strong>hill</strong>s downwind. These <strong>hill</strong>s may probably produce some upwind blockage. (see<br />
figure 4.2). Actually, in most cases, the speed on the <strong>hill</strong> top is underpredicted. This could be<br />
rel<strong>at</strong>ed with the fact th<strong>at</strong> the topography around the site is not taken into account. It is<br />
assumed to be a fl<strong>at</strong> plain, but even a low <strong>hill</strong> downwind the <strong>Askervein</strong> <strong>hill</strong> could explain th<strong>at</strong><br />
the model provides lower velocities than the measured ones.<br />
Figure 4.2. Contour map of <strong>Askervein</strong> <strong>hill</strong>.<br />
Source : P.A. TAYLOR and H.W TEUNISSEN (1986)<br />
"The <strong>Askervein</strong> Hill project : overview and background d<strong>at</strong>a"<br />
However, the results are almost as accur<strong>at</strong>e as experimental results, as far uncertainty allows<br />
us to judge.<br />
Note th<strong>at</strong> as long as wind energy is the m<strong>at</strong>ter of interest, the most important point is to<br />
predict maximum speed up in the right loc<strong>at</strong>ions, and, if possible, with good accuracy. The<br />
details of flows on the lee side is not relevant for such an applic<strong>at</strong>ion. However, in the interest<br />
of micro scale modelling aimed <strong>at</strong> other purposes-such as pollutant dispersion-, the study of<br />
other cases may be desirable.<br />
- 35 -
5. REFERENCES<br />
A.R. GRAVDAHL (1998) "Meso scale modelling with a Reynolds Averaged Navier-Stokes<br />
solver-Assessment of wind resources along the Norwegian coast", 31st Meeting of experts-<br />
St<strong>at</strong>e of the art on wind resource estim<strong>at</strong>ion, Risø, Denmark October 29-30 1998.<br />
Vector, Tønsberg, Norway<br />
P.K. CHAVIAROPOULOS and D.I. DOUVIKAS (1998) "Mean-flow-<strong>field</strong> <strong>simul<strong>at</strong>ions</strong> over<br />
complex terrain scale", 31st Meeting of experts-St<strong>at</strong>e of the art on wind resource estim<strong>at</strong>ion,<br />
Risø, Denmark October 29-30 1998.<br />
Center for Renewable Energy Sources, Attiki, Greece<br />
L.K. ALM and T.A. NYGAARD (1995) "Flow over complex terrain estim<strong>at</strong>ed by a general<br />
purpose Navier Stokes solver"<br />
Institutt for energiteknikk, Kjeller, Norway<br />
T. UTNES and K.J. EIDSVIK (1996) "Turbulent flow over mountainous terrain modelled by<br />
the Reynolds equ<strong>at</strong>ions"<br />
NTNU, Trondheim, Norway<br />
J.C. KAIMAL and J.J. FINNIGAN (1994) "Atmospheric Boundary Layer Flows"<br />
Oxford University Press<br />
P.A. TAYLOR and H.W TEUNISSEN (1986) "The <strong>Askervein</strong> Hill project : overview and<br />
background d<strong>at</strong>a"<br />
Atmospheric Environment Service, Downsview, Ontario, Canada<br />
K.J. EIDSVIK and T. UTNES (1997) "Flow separ<strong>at</strong>ion and hydraulic transitions over <strong>hill</strong>s<br />
modelled by the Reynolds equ<strong>at</strong>ions, Journal of wind engineering and industrial<br />
aerodynamics"<br />
NTNU, Trondheim, Norway<br />
H.W. DETERING and D. ETLING (1985) "Applic<strong>at</strong>ion of the E-epsilon model to the<br />
<strong>at</strong>mospheric boundary layer"<br />
Institut für Meterologie und Klim<strong>at</strong>ologie, Universität Hannover, Germany<br />
D.R. LEMELIN, D. SURRY and A.G. DAVENPORT (1988) "Simple approxim<strong>at</strong>ions for<br />
wind speed-up over <strong>hill</strong>s"<br />
Boundary Layer <strong>Wind</strong> Tunnel Labor<strong>at</strong>ory, University of Western Ontario, London, Canada<br />
J.L. WALMSLEY and J. PADRO (1990) "Shear stress results from a mixed spectral finitedifference<br />
model : applic<strong>at</strong>ion to the <strong>Askervein</strong> <strong>hill</strong> project d<strong>at</strong>a"<br />
Atmospheric Environment Service, Downsview, Ontario, Canada<br />
J.L. WALMSLEY 1 and P.A. TAYLOR 2 (1995) "Boundary-layer flow over topography :<br />
impacts of the <strong>Askervein</strong> study"<br />
1 : Atmospheric Environment Service, Downsview, Ontario, Canada<br />
- 36 -
2 :Department of Earth Atmospheric Science, York University, Ontario, Canada<br />
J.R. SALMON 1 , A.J. BOWEN 2 , A.M. HOFF 3 , R. JOHNSON 2 , R.E. MICKLE 2 , P.A.<br />
TAYLOR 2 , G. TETZLAFF 3 and J.L. WALMSLEY 2 (1987) "The <strong>Askervein</strong> <strong>hill</strong> project :<br />
mean wind vari<strong>at</strong>ions <strong>at</strong> fixed heights above ground"<br />
1 : Contractor, Ontario, Canada<br />
2 : Dept of Mechanical Engineering, University of Canterbury, New Zealand<br />
3 : Institut für Meterologie und Klim<strong>at</strong>ologie, Universität Hannover, Germany<br />
F.M. WHITE (1974) "Viscous fluid flow"<br />
McGraw-Hill Publishing Company<br />
PHOENICS document<strong>at</strong>ion<br />
CHAM Ltd<br />
- 37 -