CFD wake modeling using a porous disc - WindSim
CFD wake modeling using a porous disc - WindSim
CFD wake modeling using a porous disc - WindSim

Create successful ePaper yourself
Turn your PDF publications into a flip-book with our unique Google optimized e-Paper software.
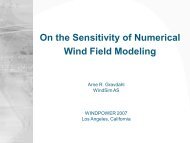
<strong>CFD</strong> <strong>wake</strong> <strong>modeling</strong> <strong>using</strong> a<strong>porous</strong> <strong>disc</strong>Giorgio Crasto
Actuator <strong>disc</strong>• Single <strong>wake</strong>s over flat terrains are modeled with<strong>WindSim</strong>•The tower and the nacelle of the wind turbine aremodeled by solid cells• The rotor is modeled by a <strong>porous</strong> <strong>disc</strong> providing aresistive force which is calculated from the thrustcoefficient C T• Comparisons of <strong>CFD</strong> results are presented againstexperimental data, wind tunnel tests from Vermeer et al.[1]. The numerical results are further compared againstthree analytical models for <strong>wake</strong>s [2,3,4].
Actuator <strong>disc</strong>The thrust, momentum sink for the axial flow, is supposed unformlydistributed on the swept area (uniform pressure drop):1t T T 22/ A C uAxial induction factor:u u1 aBy definition1a u1 1 C T 2Betz’s theory
Actuator <strong>disc</strong>Figure 1. Perspective view of the actuator <strong>disc</strong>, streamlines and isosurface of turbulent kinetic energy (1,4 m 2 /s 2 , U e 10 m/s at 500m a.g.l.).
Height [rotor diamaters]Actuator <strong>disc</strong>10TNO WT TNO WT TNO WT TNO WT-15D <strong>CFD</strong> 2D <strong>CFD</strong> 6D <strong>CFD</strong> 8D <strong>CFD</strong>8D downstream2D downstream6D downstream10.10 0.2 0.4 0.6 0.8 1 1.2Velocity ratioFigure 2. Vertical profiles of normalized velocity from TNO Wind Tunnel tests(solid black lines), from Vermeer et al. [1], predicted by the actuator <strong>disc</strong> <strong>CFD</strong>model (coloured lines).
Comparisons with analytical models• Analytical models:• 1. Jensen model [2]• 2. Larsen model [3]• 3. Ishihara et al. model [4]Cases: z 0 0,03m z 0 0,0001mC T 0,80 a bC T 0,31 c d
Comparisons with analytical modelsCT0.90.80.70.60.50.40.30.20.100 5 10 15 20 25 30undisturbed velocity [m/s]
Normalized-Wind-DeficitComparisons with analytical modelsCase a: C T = 0,80; z 0 = 0,03 m (onshore)10.90.8case a (Ct 0,8; z0 0,03m)Wake model 1Wake model 2Wake model 30.70.60.50.40.30.20.10-20 -10 0 10 20 30
Normalized-Wind-DeficitComparisons with analytical modelsCase b: C T = 0,80; z 0 = 0,0001 m (offshore)1case b a (Ct (Ct 0,8; z0 z0 0,0001m) 0,03m)Wake model 110.9Wake model 22Wake model 330.80.70.60.50.40.30.20.10-20 -10 0 10 20 30
Normalized-Wind-DeficitComparisons with analytical modelsCase c: C T = 0,31; z 0 = 0,03 m (onshore)1case c a (Ct 0,31; 0,8; z0 0,03m)Wake model 10.9Wake model 2Wake model 30.80.70.60.50.40.30.20.10-20 -10 0 10 20 30
Normalized-Wind-DeficitComparisons with analytical modelsCase d: C T = 0,31; z 0 = 0,0001 m (offshore)1case case d (Ct a (Ct 0,31; 0,8; z0 0,0001m) 0,03m)Wake model 1 10.9Wake model 2 2Wake model 3 30.80.70.60.50.40.30.20.10-20 -10 0 10 20 30
Turbulent Intensity [%]Comparisons with analytical modelsCase a: C T = 0,80; z 0 = 0,03 m (onshore)1009080706050403020100-20 -10 0 10 20 30
Turbulent Intensity [%]Comparisons with analytical modelsCase b: C T = 0,80; z 0 = 0,0001 m (offshore)1009080706050403020100-20 -10 0 10 20 30
Turbulent Intensity [%]Comparisons with analytical modelsCase c: C T = 0,31; z 0 = 0,03 m (onshore)1009080706050403020100-20 -10 0 10 20 30
Turbulent Intensity [%]Comparisons with analytical modelsCase d: C T = 0,31; z 0 = 0,0001 m (offshore)1009080706050403020100-20 -10 0 10 20 30
Conclusions• An actuator <strong>disc</strong> concept is applied to model awind turbine in RANS simulations of a singleWECS <strong>wake</strong>. A uniform pressure drop is appliedon the <strong>disc</strong>; the value of the pressure drop iscalculated from the thrust coefficient and axialinduction factor. From comparison with WT [1]tests the wind deficit predicted by the <strong>CFD</strong>simulations is the under predicted in the near<strong>wake</strong> (2D diameters downstream), the level ofwind deficit is instead correctly predicted at 6Ddownstream while in the far <strong>wake</strong> the winddeficit is overestimated. When comparing thepresented actuator <strong>disc</strong> to some analyticalmodels the best match is found to the Larsen[3].
Future steps• Automatization of the process:– Reading of the layout of the wind farm fromthe .ows file– Automatic generation of the grid– Reading of the thrust curve from the .pwsfile• Investigation of:– Rotational effects (swirling)– Introduction of turbulence sources in theactuator <strong>disc</strong>– Possible nesting technique to improve thegrid design
References[1] VERMEER L.J, SØRENSEN J.N., CRESPO A.(2003). WIND TURBINE WAKE AERODYNAMICS.PROGRESS IN AEROSPACE SCIENCES 39(2003) 467–510.[2] KATIC, I., HØJSTRUP, J., JENSEN, N.O. "ASIMPLE MODEL FOR CLUSTER EFFICIENCY."EWEC PROCEEDINGS, 7-9 OCTOBER 1986,ROME, ITALY.[3] LARSEN, C. G. "A SIMPLE WAKECALCULATION PROCEDURE." RISØ-M-2760,1988.[4] ISHIHARA, T., YAMAGUCHI, A., FUJINO, Y."DEVELOPMENT OF A NEW WAKE MODELBASED ON A WIND TUNNEL EXPERIMENT."GLOBAL WIND POWER 2004.