Volume 3, ISSUE1/2012 - Review of Applied Socio-Economic ...
Volume 3, ISSUE1/2012 - Review of Applied Socio-Economic ...
Volume 3, ISSUE1/2012 - Review of Applied Socio-Economic ...
You also want an ePaper? Increase the reach of your titles
YUMPU automatically turns print PDFs into web optimized ePapers that Google loves.
________________________________________________________________________________________________<br />
ISSN: 2247-6172<br />
ISSN-L: 2247-6172<br />
<strong>Review</strong> <strong>of</strong> <strong>Applied</strong> <strong>Socio</strong>- <strong>Economic</strong> Research<br />
(<strong>Volume</strong> 3, Issue 1/ <strong>2012</strong> ), pp.117<br />
URL: http://www.reaser.eu<br />
e-mail: editors@reaser.eu<br />
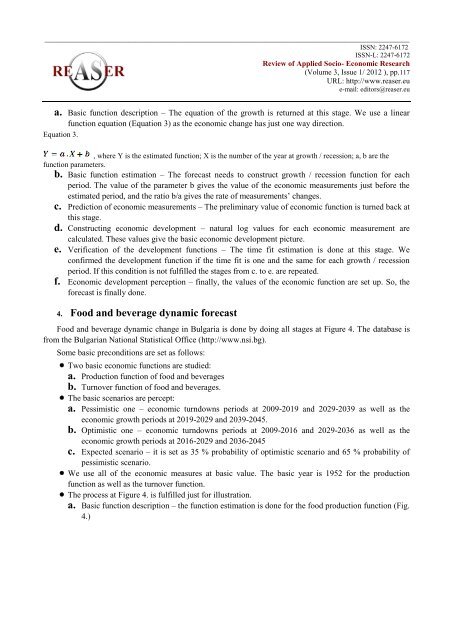
a. Basic function description – The equation <strong>of</strong> the growth is returned at this stage. We use a linear<br />
function equation (Equation 3) as the economic change has just one way direction.<br />
Equation 3.<br />
, where Y is the estimated function; X is the number <strong>of</strong> the year at growth / recession; a, b are the<br />
function parameters.<br />
b. Basic function estimation – The forecast needs to construct growth / recession function for each<br />
period. The value <strong>of</strong> the parameter b gives the value <strong>of</strong> the economic measurements just before the<br />
estimated period, and the ratio b/a gives the rate <strong>of</strong> measurements’ changes.<br />
c. Prediction <strong>of</strong> economic measurements – The preliminary value <strong>of</strong> economic function is turned back at<br />
this stage.<br />
d. Constructing economic development – natural log values for each economic measurement are<br />
calculated. These values give the basic economic development picture.<br />
e. Verification <strong>of</strong> the development functions – The time fit estimation is done at this stage. We<br />
confirmed the development function if the time fit is one and the same for each growth / recession<br />
period. If this condition is not fulfilled the stages from c. to e. are repeated.<br />
f. <strong>Economic</strong> development perception – finally, the values <strong>of</strong> the economic function are set up. So, the<br />
forecast is finally done.<br />
4. Food and beverage dynamic forecast<br />
Food and beverage dynamic change in Bulgaria is done by doing all stages at Figure 4. The database is<br />
from the Bulgarian National Statistical Office (http://www.nsi.bg).<br />
Some basic preconditions are set as follows:<br />
Two basic economic functions are studied:<br />
a. Production function <strong>of</strong> food and beverages<br />
b. Turnover function <strong>of</strong> food and beverages.<br />
The basic scenarios are percept:<br />
a. Pessimistic one – economic turndowns periods at 2009-2019 and 2029-2039 as well as the<br />
economic growth periods at 2019-2029 and 2039-2045.<br />
b. Optimistic one – economic turndowns periods at 2009-2016 and 2029-2036 as well as the<br />
economic growth periods at 2016-2029 and 2036-2045<br />
c. Expected scenario – it is set as 35 % probability <strong>of</strong> optimistic scenario and 65 % probability <strong>of</strong><br />
pessimistic scenario.<br />
We use all <strong>of</strong> the economic measures at basic value. The basic year is 1952 for the production<br />
function as well as the turnover function.<br />
The process at Figure 4. is fulfilled just for illustration.<br />
a. Basic function description – the function estimation is done for the food production function (Fig.<br />
4.)


