Volume 3, ISSUE1/2012 - Review of Applied Socio-Economic ...
Volume 3, ISSUE1/2012 - Review of Applied Socio-Economic ...
Volume 3, ISSUE1/2012 - Review of Applied Socio-Economic ...

You also want an ePaper? Increase the reach of your titles
YUMPU automatically turns print PDFs into web optimized ePapers that Google loves.
ISSN: 2247-6172<br />
ISSN-L: 2247-6172<br />
<strong>Review</strong> <strong>of</strong> <strong>Applied</strong> <strong>Socio</strong>- <strong>Economic</strong> Research<br />
(<strong>Volume</strong> 3, Issue 1/ <strong>2012</strong> ), pp. 45<br />
URL: http://www.reaser.eu<br />
e-mail: editors@reaser.eu<br />
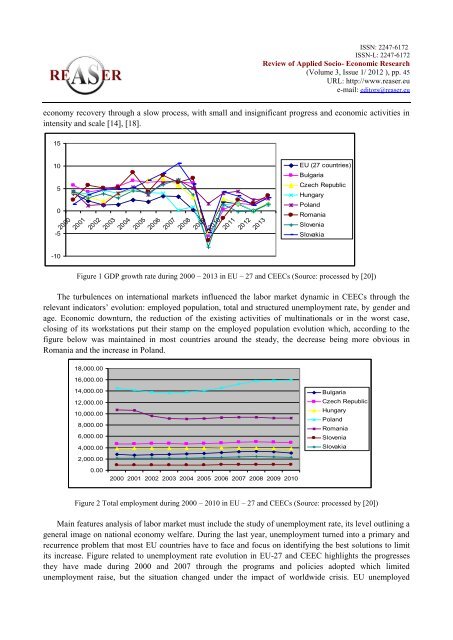
economy recovery through a slow process, with small and insignificant progress and economic activities in<br />
intensity and scale [14], [18].<br />
15<br />
10<br />
5<br />
0<br />
-5<br />
-10<br />
2000<br />
2001<br />
2002<br />
2003<br />
2004<br />
2005<br />
2006<br />
2007<br />
2008<br />
2009<br />
2010<br />
2011<br />
<strong>2012</strong><br />
2013<br />
EU (27 countries)<br />
Bulgaria<br />
Czech Republic<br />
Hungary<br />
Poland<br />
Romania<br />
Slovenia<br />
Slovakia<br />
Figure 1 GDP growth rate during 2000 – 2013 in EU – 27 and CEECs (Source: processed by [20])<br />
The turbulences on international markets influenced the labor market dynamic in CEECs through the<br />
relevant indicators’ evolution: employed population, total and structured unemployment rate, by gender and<br />
age. <strong>Economic</strong> downturn, the reduction <strong>of</strong> the existing activities <strong>of</strong> multinationals or in the worst case,<br />
closing <strong>of</strong> its workstations put their stamp on the employed population evolution which, according to the<br />
figure below was maintained in most countries around the steady, the decrease being more obvious in<br />
Romania and the increase in Poland.<br />
18,000.00<br />
16,000.00<br />
14,000.00<br />
12,000.00<br />
10,000.00<br />
8,000.00<br />
6,000.00<br />
4,000.00<br />
2,000.00<br />
0.00<br />
2000 2001 2002 2003 2004 2005 2006 2007 2008 2009 2010<br />
Bulgaria<br />
Czech Republic<br />
Hungary<br />
Poland<br />
Romania<br />
Slovenia<br />
Slovakia<br />
Figure 2 Total employment during 2000 – 2010 in EU – 27 and CEECs (Source: processed by [20])<br />
Main features analysis <strong>of</strong> labor market must include the study <strong>of</strong> unemployment rate, its level outlining a<br />
general image on national economy welfare. During the last year, unemployment turned into a primary and<br />
recurrence problem that most EU countries have to face and focus on identifying the best solutions to limit<br />
its increase. Figure related to unemployment rate evolution in EU-27 and CEEC highlights the progresses<br />
they have made during 2000 and 2007 through the programs and policies adopted which limited<br />
unemployment raise, but the situation changed under the impact <strong>of</strong> worldwide crisis. EU unemployed