Volume 3, ISSUE1/2012 - Review of Applied Socio-Economic ...
Volume 3, ISSUE1/2012 - Review of Applied Socio-Economic ...
Volume 3, ISSUE1/2012 - Review of Applied Socio-Economic ...

You also want an ePaper? Increase the reach of your titles
YUMPU automatically turns print PDFs into web optimized ePapers that Google loves.
ISSN: 2247-6172<br />
ISSN-L: 2247-6172<br />
<strong>Review</strong> <strong>of</strong> <strong>Applied</strong> <strong>Socio</strong>- <strong>Economic</strong> Research<br />
(<strong>Volume</strong> 3, Issue 1/ <strong>2012</strong> ), pp. xxx-xxx<br />
URL: http://www.reaser.eu<br />
e-mail: editors@reaser.eu<br />
deficiency <strong>of</strong> the method employed, although economically a negative figure is possible, supposing<br />
some degree <strong>of</strong> disinvestment or the selling <strong>of</strong> capital stock <strong>of</strong> Area A to Areas B and (C+D+E). Some<br />
other procedures used for a capital stock derivation had produced the same results.<br />
Due to the very short employment series relevant to the investigated period, reference to a very<br />
limited amount <strong>of</strong> coefficients can be made. The results have also to be treated with<br />
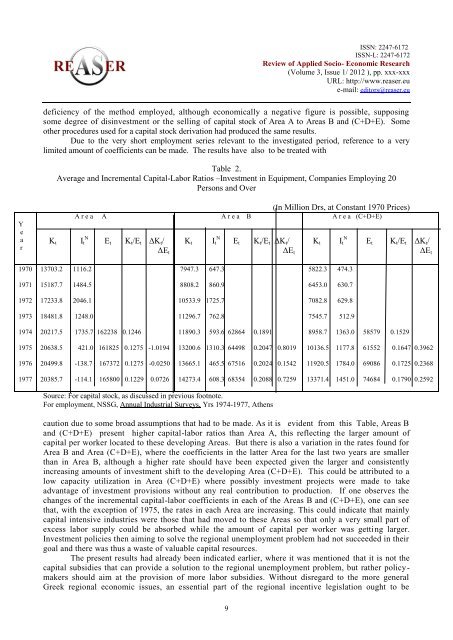
Table 2.<br />
Average and Incremental Capital-Labor Ratios –Investment in Equipment, Companies Employing 20<br />
Persons and Over<br />
Υ<br />
e<br />
a<br />
r<br />
K t<br />
A r e a<br />
I t<br />
N<br />
A<br />
E t K t /E t ΔK t /<br />
ΔE t<br />
K t<br />
I t<br />
N<br />
A r e a<br />
B<br />
E t K t /E t ΔK t /<br />
ΔE t<br />
(In Million Drs, at Constant 1970 Prices)<br />
K t<br />
A r e a (C+D+E)<br />
I t<br />
N<br />
E t K t /E t ΔK t /<br />
ΔE t<br />
1970<br />
13703.2 1116.2<br />
7947.3 647.3<br />
5822.3 474.3<br />
1971<br />
15187.7 1484.5<br />
8808.2 860.9<br />
6453.0 630.7<br />
1972<br />
17233.8 2046.1<br />
10533.9 1725.7<br />
7082.8 629.8<br />
1973<br />
18481.8 1248.0<br />
11296.7 762.8<br />
7545.7 512.9<br />
1974<br />
20217.5 1735.7 162238 0.1246<br />
11890.3 593.6 62864 0.1891<br />
8958.7 1363.0 58579 0.1529<br />
1975<br />
20638.5 421.0 161825 0.1275 -1.0194<br />
13200.6 1310.3 64498 0.2047 0.8019<br />
10136.5 1177.8 61552 0.1647 0.3962<br />
1976<br />
20499.8 -138.7 167372 0.1275 -0.0250<br />
13665.1 465.5 67516 0.2024 0.1542<br />
11920.5 1784.0 69086 0.1725 0.2368<br />
1977<br />
20385.7 -114.1 165800 0.1229 0.0726<br />
14273.4 608.3 68354 0.2088 0.7259<br />
13371.4 1451.0 74684 0.1790 0.2592<br />
Source: For capital stock, as discussed in previous footnote.<br />
For employment, NSSG, Annual Industrial Surveys, Yrs 1974-1977, Athens<br />
caution due to some broad assumptions that had to be made. As it is evident from this Table, Areas B<br />
and (C+D+E) present higher capital-labor ratios than Area A, this reflecting the larger amount <strong>of</strong><br />
capital per worker located to these developing Areas. But there is also a variation in the rates found for<br />
Area B and Area (C+D+E), where the coefficients in the latter Area for the last two years are smaller<br />
than in Area B, although a higher rate should have been expected given the larger and consistently<br />
increasing amounts <strong>of</strong> investment shift to the developing Area (C+D+E). This could be attributed to a<br />
low capacity utilization in Area (C+D+E) where possibly investment projects were made to take<br />
advantage <strong>of</strong> investment provisions without any real contribution to production. If one observes the<br />
changes <strong>of</strong> the incremental capital-labor coefficients in each <strong>of</strong> the Areas B and (C+D+E), one can see<br />
that, with the exception <strong>of</strong> 1975, the rates in each Area are increasing. This could indicate that mainly<br />
capital intensive industries were those that had moved to these Areas so that only a very small part <strong>of</strong><br />
excess labor supply could be absorbed while the amount <strong>of</strong> capital per worker was getting larger.<br />
Investment policies then aiming to solve the regional unemployment problem had not succeeded in their<br />
goal and there was thus a waste <strong>of</strong> valuable capital resources.<br />
The present results had already been indicated earlier, where it was mentioned that it is not the<br />
capital subsidies that can provide a solution to the regional unemployment problem, but rather policymakers<br />
should aim at the provision <strong>of</strong> more labor subsidies. Without disregard to the more general<br />
Greek regional economic issues, an essential part <strong>of</strong> the regional incentive legislation ought to be<br />
9