Volume 3, ISSUE1/2012 - Review of Applied Socio-Economic ...
Volume 3, ISSUE1/2012 - Review of Applied Socio-Economic ...
Volume 3, ISSUE1/2012 - Review of Applied Socio-Economic ...

Create successful ePaper yourself
Turn your PDF publications into a flip-book with our unique Google optimized e-Paper software.
assets<br />
revenue<br />
assets<br />
revenue<br />
assets<br />
revenue<br />
assets<br />
revenue<br />
Average market<br />
share <strong>of</strong> assets<br />
Average market<br />
share <strong>of</strong> revenue<br />
ISSN: 2247-6172<br />
ISSN-L: 2247-6172<br />
<strong>Review</strong> <strong>of</strong> <strong>Applied</strong> <strong>Socio</strong>- <strong>Economic</strong> Research<br />
(<strong>Volume</strong> 3, Issue 1/ <strong>2012</strong>), pp.89<br />
URL: http://www.reaser.eu<br />
e-mail: editors@reaser.eu<br />
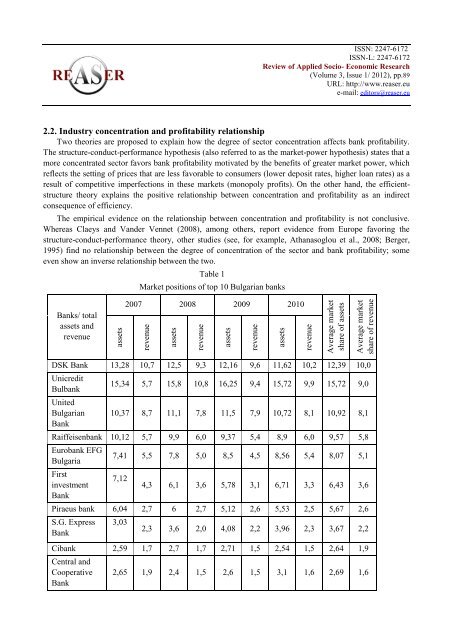
2.2. Industry concentration and pr<strong>of</strong>itability relationship<br />
Two theories are proposed to explain how the degree <strong>of</strong> sector concentration affects bank pr<strong>of</strong>itability.<br />
The structure-conduct-performance hypothesis (also referred to as the market-power hypothesis) states that a<br />
more concentrated sector favors bank pr<strong>of</strong>itability motivated by the benefits <strong>of</strong> greater market power, which<br />
reflects the setting <strong>of</strong> prices that are less favorable to consumers (lower deposit rates, higher loan rates) as a<br />
result <strong>of</strong> competitive imperfections in these markets (monopoly pr<strong>of</strong>its). On the other hand, the efficientstructure<br />
theory explains the positive relationship between concentration and pr<strong>of</strong>itability as an indirect<br />
consequence <strong>of</strong> efficiency.<br />
The empirical evidence on the relationship between concentration and pr<strong>of</strong>itability is not conclusive.<br />
Whereas Claeys and Vander Vennet (2008), among others, report evidence from Europe favoring the<br />
structure-conduct-performance theory, other studies (see, for example, Athanasoglou et al., 2008; Berger,<br />
1995) find no relationship between the degree <strong>of</strong> concentration <strong>of</strong> the sector and bank pr<strong>of</strong>itability; some<br />
even show an inverse relationship between the two.<br />
Table 1<br />
Market positions <strong>of</strong> top 10 Bulgarian banks<br />
Banks/ total<br />
assets and<br />
revenue<br />
2007 2008 2009 2010<br />
DSK Bank 13,28 10,7 12,5 9,3 12,16 9,6 11,62 10,2 12,39 10,0<br />
Unicredit<br />
Bulbank<br />
United<br />
Bulgarian<br />
Bank<br />
15,34 5,7 15,8 10,8 16,25 9,4 15,72 9,9 15,72 9,0<br />
10,37 8,7 11,1 7,8 11,5 7,9 10,72 8,1 10,92 8,1<br />
Raiffeisenbank 10,12 5,7 9,9 6,0 9,37 5,4 8,9 6,0 9,57 5,8<br />
Eurobank EFG<br />
Bulgaria<br />
First<br />
investment<br />
Bank<br />
7,41 5,5 7,8 5,0 8,5 4,5 8,56 5,4 8,07 5,1<br />
7,12<br />
4,3 6,1 3,6 5,78 3,1 6,71 3,3 6,43 3,6<br />
Piraeus bank 6,04 2,7 6 2,7 5,12 2,6 5,53 2,5 5,67 2,6<br />
S.G. Express<br />
Bank<br />
3,03<br />
2,3 3,6 2,0 4,08 2,2 3,96 2,3 3,67 2,2<br />
Cibank 2,59 1,7 2,7 1,7 2,71 1,5 2,54 1,5 2,64 1,9<br />
Central and<br />
Cooperative<br />
Bank<br />
2,65 1,9 2,4 1,5 2,6 1,5 3,1 1,6 2,69 1,6