Volume 3, ISSUE1/2012 - Review of Applied Socio-Economic ...
Volume 3, ISSUE1/2012 - Review of Applied Socio-Economic ...
Volume 3, ISSUE1/2012 - Review of Applied Socio-Economic ...

Create successful ePaper yourself
Turn your PDF publications into a flip-book with our unique Google optimized e-Paper software.
________________________________________________________________________________________________<br />
ISSN: 2247-6172<br />
ISSN-L: 2247-6172<br />
<strong>Review</strong> <strong>of</strong> <strong>Applied</strong> <strong>Socio</strong>- <strong>Economic</strong> Research<br />
(<strong>Volume</strong> 3, Issue 1/ <strong>2012</strong> ), pp. 30<br />
URL: http://www.reaser.eu<br />
e-mail: editors@reaser.eu<br />
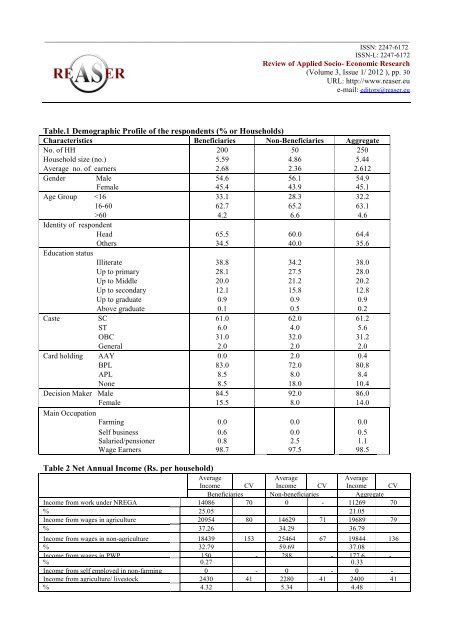
Table.1 Demographic Pr<strong>of</strong>ile <strong>of</strong> the respondents (% or Households)<br />
Characteristics Beneficiaries Non-Beneficiaries Aggregate<br />
No. <strong>of</strong> HH 200 50 250<br />
Household size (no.) 5.59 4.86 5.44<br />
Average no. <strong>of</strong> earners 2.68 2.36 2.612<br />
Gender Male 54.6 56.1 54.9<br />
Female 45.4 43.9 45.1<br />
Age Group 60 4.2 6.6 4.6<br />
Identity <strong>of</strong> respondent<br />
Head 65.5 60.0 64.4<br />
Others 34.5 40.0 35.6<br />
Education status<br />
Illiterate 38.8 34.2 38.0<br />
Up to primary 28.1 27.5 28.0<br />
Up to Middle 20.0 21.2 20.2<br />
Up to secondary 12.1 15.8 12.8<br />
Up to graduate 0.9 0.9 0.9<br />
Above graduate 0.1 0.5 0.2<br />
Caste SC 61.0 62.0 61.2<br />
ST 6.0 4.0 5.6<br />
OBC 31.0 32.0 31.2<br />
General 2.0 2.0 2.0<br />
Card holding AAY 0.0 2.0 0.4<br />
BPL 83.0 72.0 80.8<br />
APL 8.5 8.0 8.4<br />
None 8.5 18.0 10.4<br />
Decision Maker Male 84.5 92.0 86.0<br />
Female 15.5 8.0 14.0<br />
Main Occupation<br />
Farming 0.0 0.0 0.0<br />
Self business<br />
Salaried/pensioner<br />
Wage Earners<br />
Table 2 Net Annual Income (Rs. per household)<br />
Average<br />
0.6<br />
0.8<br />
98.7<br />
Income CV<br />
Average<br />
Income CV<br />
Average<br />
Income CV<br />
Beneficiaries Non-beneficiaries Aggregate<br />
Income from work under NREGA 14086 70 0 - 11269 70<br />
% 25.05 21.05<br />
Income from wages in agriculture 20954 80 14629 71 19689 79<br />
% 37.26 34.29 36.79<br />
Income from wages in non-agriculture 18439 153 25464 67 19844 136<br />
% 32.79 59.69 37.08<br />
Income from wages in PWP<br />
%<br />
150<br />
0.27<br />
- 288 - 177.6<br />
0.33<br />
-<br />
Income from self employed in non-farming 0 - 0 - 0 -<br />
Income from agriculture/ livestock 2430 41 2280 41 2400 41<br />
% 4.32 5.34 4.48<br />
0.0<br />
2.5<br />
97.5<br />
0.5<br />
1.1<br />
98.5