long-term care use and supply in europe: projections for germany ...
long-term care use and supply in europe: projections for germany ...
long-term care use and supply in europe: projections for germany ...

You also want an ePaper? Increase the reach of your titles
YUMPU automatically turns print PDFs into web optimized ePapers that Google loves.
LONG-TERM CARE USE AND SUPPLY IN EUROPE | 25<br />
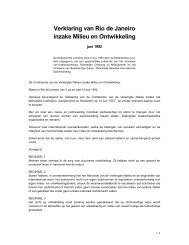
reverse <strong>for</strong> the other countries. Another relevant f<strong>in</strong>d<strong>in</strong>g is that <strong>use</strong> of <strong>for</strong>mal <strong>care</strong> <strong>in</strong>creases much less<br />
steeply with age <strong>in</strong> Spa<strong>in</strong> than it does <strong>in</strong> the Netherl<strong>and</strong>s <strong>and</strong> Germany. By contrast, <strong>use</strong> of <strong>in</strong><strong>for</strong>mal <strong>care</strong><br />
hardly <strong>in</strong>creases with age <strong>in</strong> the Netherl<strong>and</strong>s, while it does steeply rise with age <strong>in</strong> Spa<strong>in</strong> <strong>and</strong> Germany.<br />
The different age gradients suggest that the impact of population age<strong>in</strong>g on the numbers of <strong>for</strong>mal <strong>and</strong><br />
<strong>in</strong><strong>for</strong>mal <strong>care</strong> <strong>use</strong>rs can be expected to differ considerably between the three countries.<br />
Figure 3.2 Predicted probabilities of <strong>care</strong> <strong>use</strong>, by age<br />
0.45<br />
0.4<br />
0.35<br />
0.3<br />
0.25<br />
0.2<br />
0.15<br />
0.1<br />
0.05<br />
0<br />
GE NL ES GE NL ES GE NL ES GE NL ES GE NL ES<br />
65-69 70-74 75-79 80-84 85+<br />
In<strong>for</strong>mal only Formal only In<strong>for</strong>mal <strong>and</strong> <strong>for</strong>mal<br />
Data: SHARE Wave 1 <strong>and</strong> Wave 2, pooled data, weighted results, own calculations.<br />
Figure 3.3 shows <strong>care</strong> <strong>use</strong> probabilities by ho<strong>use</strong>hold composition. While <strong>in</strong> the Netherl<strong>and</strong>s <strong>and</strong><br />
Germany persons liv<strong>in</strong>g alone have a higher predicted probability of us<strong>in</strong>g any <strong>for</strong>m of <strong>care</strong> than persons<br />
liv<strong>in</strong>g with others, the reverse holds <strong>for</strong> Spa<strong>in</strong>. This could be a reflection of compositional differences. In<br />
all three countries both the probability of becom<strong>in</strong>g widowed or los<strong>in</strong>g one’s partner <strong>and</strong> the probability<br />
of <strong>care</strong> dependency rise with age. Hence, on average, older persons liv<strong>in</strong>g alone can be expected to need<br />
<strong>and</strong> <strong>use</strong> more <strong>care</strong> than persons liv<strong>in</strong>g with their partner. In Spa<strong>in</strong> however, this tendency could be offset<br />
to a certa<strong>in</strong> extent by the high co-residence rate of older dependent persons <strong>and</strong> their adult children.<br />
Another relevant f<strong>in</strong>d<strong>in</strong>g is that, <strong>in</strong> Spa<strong>in</strong>, probabilities of us<strong>in</strong>g <strong>for</strong>mal <strong>care</strong> are not much higher <strong>for</strong><br />
persons liv<strong>in</strong>g alone compared to persons liv<strong>in</strong>g with others, while <strong>in</strong> the Netherl<strong>and</strong>s <strong>and</strong> Germany,<br />
older persons liv<strong>in</strong>g alone have a much higher probability of us<strong>in</strong>g <strong>for</strong>mal <strong>care</strong> than persons liv<strong>in</strong>g with<br />
others.